BOME/USDT BullishMeme Coin Bome bullish, break the trendline, trend is change of character.
Let's see.
BINANCE:BOMEUSDT

BOMEUSDT 1DBOME ~ 1D Analysis
#BOME This trade is very high risk. Buy gradually from here with a short -term target of at least 10%+.

BOME to Boom 500% by end of March?Price action has corrected 85% since mid November, a number of reasons now exist to have long exposure. They include:
1) Price action and RSI resistance breakouts.
2) Regular bullish divergence. Look left.
3) Falling wedge confirmation forecasts circa 550% extension.
Is it possible price action

BomeusdtBOME/USDT Breaks Downtrend: A Potential Price Explosion Ahead?
BOME/USDT has successfully broken above its descending trendline on the daily timeframe, signaling a potential shift in market sentiment. Several technical and market-based factors suggest that a strong upward move could be on the horiz

Bomeusdt trading ideaBOMEUSDT has achieved a major breakout from a falling wedge, with price stabilizing above the wedge after a pullback. The accumulation zone presents a key buying opportunity, with the immediate target aligned with the proposed neckline and the final target clearly outlined on the chart. Additionally

Did we hit the bottom on BOME? Is it time for a rise to 0.0105?Currently, on BOME, Smart Money has created an equality pattern AB=CD.
Point C is at the 68.8 Fibonacci level of wave AB.
Point D is at the 127.2 Fibonacci level of wave AB.
Additionally, on the D1 timeframe, we have a trend reversal candle.
At the moment, the price should bounce upwards to the 61.

#BOME It's nearing the end.This is the result of investing in shitcoins.
Some naive people think that Trump is a savior and a hero who will bring the crypto market to an altcoin season (Alt Season) with his arrival. Unaware that Trump will do something with crypto that will be recorded in history and the Guinness Book of Reco


#BOMEThere are new changes in the market and you need to adapt to them.
Despite the meme coins of famous and well-known personalities, no one is willing to invest in other meme coins, and meme coins that do not have a strong community are doomed to disappear.
People who are looking for meme coins are no

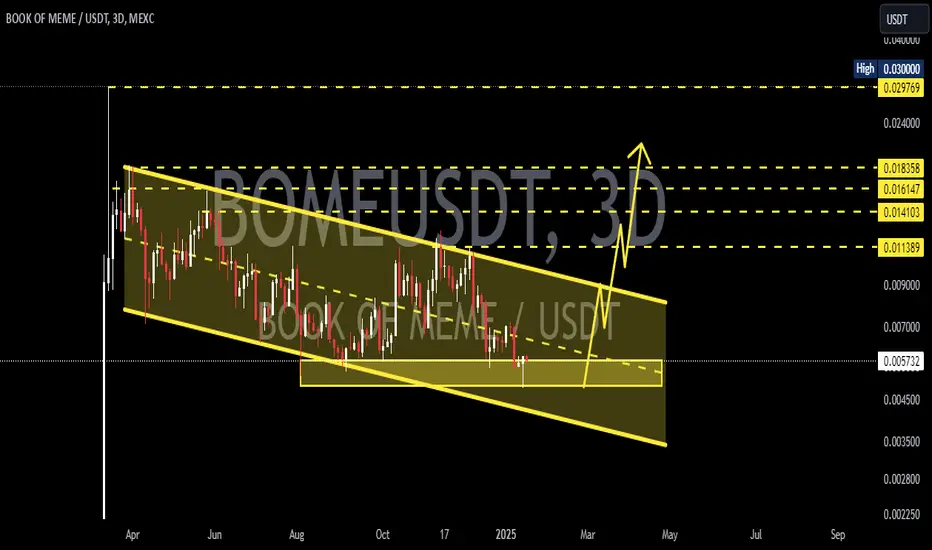
BOMEUSDT 3DBOME ~ 3D
#BOME This trade is very high risk. But if you still have Conviction on this coin,. This support block is very attractive to start buying back,.
See all ideas
Summarizing what the indicators are suggesting.
Oscillators
Neutral
SellBuy
Strong sellStrong buy
Strong sellSellNeutralBuyStrong buy
Oscillators
Neutral
SellBuy
Strong sellStrong buy
Strong sellSellNeutralBuyStrong buy
Summary
Neutral
SellBuy
Strong sellStrong buy
Strong sellSellNeutralBuyStrong buy
Summary
Neutral
SellBuy
Strong sellStrong buy
Strong sellSellNeutralBuyStrong buy
Summary
Neutral
SellBuy
Strong sellStrong buy
Strong sellSellNeutralBuyStrong buy
Moving Averages
Neutral
SellBuy
Strong sellStrong buy
Strong sellSellNeutralBuyStrong buy
Moving Averages
Neutral
SellBuy
Strong sellStrong buy
Strong sellSellNeutralBuyStrong buy
Displays a symbol's price movements over previous years to identify recurring trends.