BONKUSDT UPDATEBONKUSDT is a cryptocurrency trading at $0.003342. Its target price is $0.005000, indicating a potential 60%+ gain. The pattern is a Falling Wedge, a reversal pattern signaling a trend change. This pattern suggests the downward trend may be ending. A breakout from the wedge could lead to a strong upward move. The Falling Wedge is a positive signal, indicating a potential price surge. Investors are optimistic about BONKUSDT's future performance. The current price may be a buying opportunity. Reaching the target price would result in significant returns. BONKUSDT is poised for a potential breakout and substantial gains.
BONKUSDT.P trade ideas

BONK support and resistance levels to watchDaily BONK chart (right chart) showing resistance levels on way up and support trendline below.
Weekly chart (left chart) also shows levels to watch.
Targets are green horizontal line (left chart) then blue horizontal line (right chart) and then red trendline (right chart).
Don't forget to smash that rocket like button!

$BONK consolidation is ending. Ready to pump again.SEED_DONKEYDAN_MARKET_CAP:BONK experienced a significant pump in November 2024 and has been consolidating since.
It touched my refill zone at 0.00002500 and bounced from there. However, its MACD and RSI were showing signs of a significant bearish divergence.
The correction appears to have bottomed out, with a MACD crossover on the 1D chart. This could indicate the potential for another upward pump.
The green lines on my chart mark the possible resistance/support levels.
DYOR!

BONK/USDT: Channel Breakout Signals Potential Wave Rally
1. Price Action
- The asset is currently trading at 0.00003017 USDT
- Clear descending channel formation (marked by yellow lines) from early January to mid-January 2025
- Recent breakout attempt from the upper boundary of the descending channel
2. Trend Analysis
- Overall downtrend since early January
- Formation of higher lows in recent trading sessions
- Possible trend reversal signal with the channel breakout
Here's a concise analysis of the BONK/USDT 4H chart:
Technical Setup:
- Price breaking out of descending channel (yellow lines)
- Current price: 0.00003017 USDT
- Clear bottom formation with higher lows
Potential Targets:
1. 0.000035
2. 0.000040
3. 0.000045
Key Levels:
- Support: 0.000025
- Breakout: 0.000030
- Stop Loss: Below 0.000024
Trend shows bullish reversal potential with a projected upward wave pattern. Watch volume for confirmation.
Risk Management Note:
Always use proper position sizing and consider the volatile nature of this asset. The projected path (green waves) represents a possible scenario but markets can behave unpredictably.

Bonk Elliot wave - Fib LevelsBonk targets for wave 3 and wave 5. Telling my audience with more decription - happy tv

BonkBonk bounced from my support. At the current level there are several support acting on this level.
1. Daily imbalance
2. Weekly low
Now in order to enter this trade, i would like the previous low to be tested. Target mentioned on the chart.

Bonkusdt trading opportunityBONK/USDT recently broke out of a well-defined symmetrical triangle, signaling a potential bullish continuation. The price has remained stable above the breakout zone, reinforcing the strength of this move.
Our initial target aligns with the triangle’s measured move based on a 1:1 ratio, while the extended target area provides further upside potential. The key focus is on the accumulation zone highlighted on the chart, offering an optimal entry for those seeking to ride this trend. Given the asset’s volatility, it’s essential to trade cautiously and avoid excessive leverage.
Let us know your thoughts on this setup!
Our previous view on Bonk is here

Bonk Bullflag break out and retest confirmation. As you can see,Bonk Bullflag break out and retest confirmation. As you can see, I have written the details, the time frame is 4hour. I know I don't write much.

BonkThere are two things to review before we can enter a trade. Over social media, a lot traders are contemplating the idea that we should already be place our bids on the current level and that the trend would give at least 60% pump though here's the issue
1. Market structure on the daily has flip bearish.
2. Trend was unable to claim the previous lows and has come back in the range.
I would suggest would two ways to enter.
1. Reclaim the previous low and make a market structure shift on the lower time frame to confirm the current dip was a deviation
2. See the trend on the new low
The daily fvg gap is currently providing strong support for this trend.

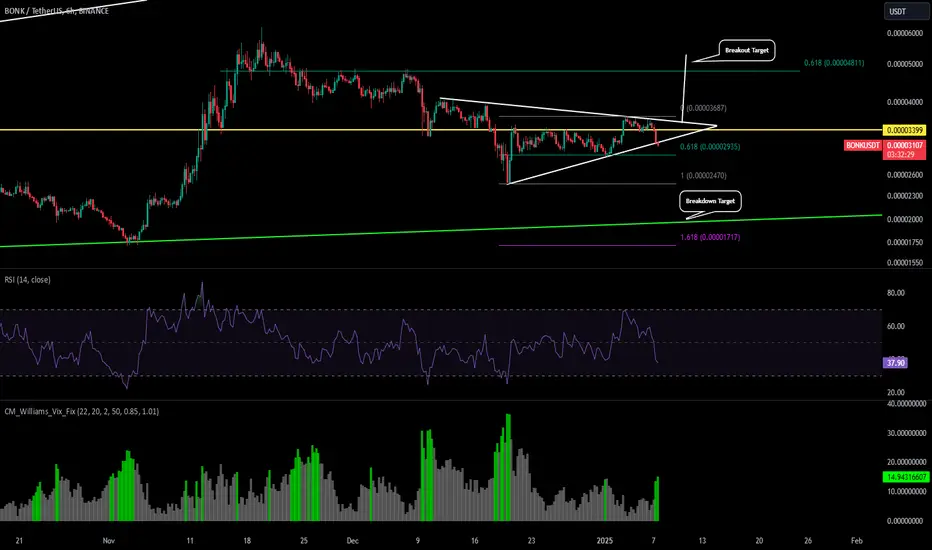
BONK - Testing Critical SupportRight now BONK is slightly below its support trendline (lower white line). It is important to see price come back up and continue to close candles above that white line for the breakout to occur. If we can breakout above our upper white trendline then we could see price expand to the 0.000048-0.000052 level.
But if we see price start closing candles below this support level, and retesting it as a level of new resistance then it could be a signal we have one more collapse coming. That collapse could lead us as low as the green trendline or even 1.618 breakdown target.
Will update this post as price develops.
BONK: Keep an eye on this level!If you're looking to trade BONK at the moment, here's a quick setup that you might find helpful!
The idea is: Buy when the price breaks above $0.000034 and take profits at the levels shown in the chart.
Targets:
1. $0.0000355
2. $0.000038
3. $0.000041
-------------------------------------------
About our trades:
Our success rate is notably high, with 10 out of 11 posted trade setups achieving at least their first target upon a breakout price breach (The most on TW!). Our TradingView page serves as a testament to this claim, and we invite you to verify it!

BONK/USDT, Falling Wedge Breakout with Retest #BONK formed a Falling Wedge pattern on the BONK/USDT pair, which is typically a bullish formation. A breakout has already occurred, and the price is now retesting the upper trendline of the wedge.
The area between 0.0000333 and 0.000032 appears to be a good entry zone for potential longs. If the retest holds, the price may aim for the expected target of 0.000046. However, confirmation of support around the retest level is crucial before entering a long trade. Keep an eye on the price action in this region and implement proper risk management strategies.


BONKUSDT: Short-Term Investment OpportunityBONKUSDT: Short-Term Investment Opportunity
Market Overview
BONK is showing a promising setup on the H4 timeframe, with an accumulation zone between $0.000033 and $0.000035. This setup aligns with high-probability opportunities for short-term gains.
Trade Plan
📌 Entry Point: $0.000033 - $0.000035 – Ideal accumulation range for positioning.
🎯 Target: 20-30% profit – Aligning with short-term market movements.
⏳ Hold Time: 3 days – Optimized for quick returns.
Expand Your Watchlist
In addition to BONK, similar coins with potential setups include:
RAD
PUNDIX
OSMO
PEOPLE
FLOKI
FIS
Diversify your capital and monitor these coins closely for similar buy opportunities.
💡 Note: This is not financial advice. Always conduct thorough research and allocate capital wisely.

WTF it's a crabPossible bullish crab pattern missing one leg down.
It's a harmonic pattern forming very often at the end of the downtrend.
It can make double bottom and finish the downtrend. It is possible to fall further down if this is extended version called deep crab.
Let's wait and see

BONK Market Structure Analysis
#BONK Descending Channel → Accumulation at Strong Support 👀
Strong Old Support: BONK is holding well above the critical support level at $0.00002876, confirming accumulation in this range.
Descending Channel Breakout Potential: The price is consolidating near the bottom of the channel, preparing for a possible breakout.
Target 🎯
🎯 Breakout Target: $0.000062

#BONK/USDT Ready to go higher#BONK
The price is moving in a descending channel on the 1-hour frame and sticking to it well
We have a bounce from the lower limit of the descending channel, this support is at 0.00002974
We have a downtrend on the RSI indicator that is about to break, which supports the rise
We have a trend to stabilize above the moving average 100
Entry price 0.00003107
First target 0.00003278
Second target 0.00003437
Third target 0.00003618

#bonkusdtAfter a deep correction, we can expect that the price surges at least 50% of the correction wave.

Can #BONK Bulls Capture this opportunity for Bullish Rally?Yello, Paradisers! Will #BONK finally break out of its descending wedge and deliver the next big move, or will we witness a deeper correction? Let’s dive in:
💎#BONKUSDT is trading within a classic falling wedge formation and hinting at the possibility of a bullish breakout if key levels are reclaimed. Currently, the strong demand zone at $0.00002490–$0.00002941 is holding steady, showing that buyers are stepping in to defend these levels. If this support continues to hold, we could see #BONK attempt a breakout above the descending resistance around $0.00003192.
💎A clean breakout above this resistance would likely trigger a rally toward the major resistance zone at $0.00003924. Beyond that, #BONKUSD could extend its gains to $0.00004500 or higher, riding the momentum typical of wedge breakouts. However, without significant buying pressure, the price could stall under the resistance, leading to further consolidation.
💎If the demand zone at $0.00002490 fails, the situation flips bearish. A breakdown below this level would invalidate the wedge pattern, opening the door for a move down toward $0.00002000 or lower as sellers take control.
Stay focused, patient, and disciplined, Paradisers🥂
MyCryptoParadise
iFeel the success🌴

probability of wave 4probability of existence
expanding diagonally
It exists. In this case, we are in wave 4 and wave 5 grows at least as much as wave 3. In this case, the minimum wave 5 is -0.00011

$BONKUSDTThis is how I look at BONK in a Long run, a profitable run years ahead. A good long term investment, looking at ROI of more than 80% in a year. My money on $BONK.

BONKTrend is failing to reclaim the previous lows has we would see it moving towards the current lows for more liquidity.
I would think it would sweep the local lows and then move upward

BONKUSDTBONKU break of demand floor looks to be common amongst all crypto usdt pairs.
on technical bonku will show some buy potential by open of new weekly candle, where i expect it to retest the broken demand floor for sell continuation. hope it touches the demand buy zone for upswing.
