BONK/USDT Chart Update.The BONK/USDT chart highlights a potential long trade setup based on technical analysis.
The price appears to be consolidating within a descending triangle pattern, with a breakout opportunity on the horizon.
Support Zone:
A crucial support zone appears between 0.00001697 and 0.00001999, suggesting a potential rebound zone for bullish momentum.
200-Day Moving Average:
The price is approaching the 200-day moving average, which could act as dynamic support.
Ichimoku Cloud:
The cloud suggests near-term bearishness, but a breakout above the resistance could signal a trend reversal.
Long Target Zone:
A green zone extending up to 0.00006239 indicates a high probability target for the next bullish leg.
Trade Setup:
Entry Point: Around the support zone at 0.00001999.
Stop-Loss: Below 0.00001697 to manage risk.
Take Profit Target:
Primary: 0.00004500.
Secondary: 0.00006239 for higher potential profits.
Risk/Reward:
The setup offers a favorable risk-to-reward ratio, making it an attractive option for long trades. However, before entering the trade, confirmation of a reversal (e.g., bullish candlestick pattern or volume spikes) is recommended.
DYOR, NFA
@Peter_CSAdmin
BONKUSDT.P trade ideas

Bonk USDTMost Meme coins have broken their macro structure. Plus the God candle on the left offer no resistance for the macro trend hence it will look for equal highs to consolidate and retrace
How do we play?
There are two options
1. If the trend reclaim the previous lows and holds it. We can enter on retest.
2. We can wait for the trend to completely retrace and then enter.
Both options will have safe entries.

$BONK will dump very low. Short opportunity.CRYPTOCAP:BONK , SEED_DONKEYDAN_MARKET_CAP:FLOKI , CRYPTOCAP:PEPE , and similar coins have seen massive pumps recently. However, these surges are not organic; they are likely manipulated by exchanges or influential whales.
CRYPTOCAP:BONK , for instance, is heavily backed by the Solana community and gets a significant push from Solana enthusiasts.
The issue with these pumps is that they defy normal chart logic, creating large bearish divergences. These divergences eventually need to be corrected, leading to prolonged and painful dumps.
Trading these coins can be straightforward if approached wisely. Wait for a significant dump and for the weekly chart to reset to oversold territory. This process could take up to six months.
The best time to act is when the daily, weekly, and hourly charts align. This alignment often signals when whales ignite a new pump. However, once the coin is pumped, sell quickly and move on to avoid the inevitable harsh dump that follows.
Currently, CRYPTOCAP:BONK is in the process of resetting. Until the MACD and RSI reach their lowest levels, I would recommend staying away from this coin entirely or considering shorting it.
**DYOR** (Do Your Own Research).

UPDATE {BONK}Hello friends
As we told you before, this coin can ATH by maintaining the specified range.
Now, with the loss of the limit, he was able to hit higher bottoms and if he breaks this triangle, we will go for ATH.
If the market falls, we have identified two other good ranges for you that can be suitable for buying.
Be successful and profitable.

BONK - Respecting StructureHere is an update to our last post:
In our last post we were pointing out the importance of the 0.618 golden Fibonacci level. Today, we saw price wick down once more too it and buyers stepped in big time. As you can see, a massive wick formed after touching the 0.618 and continuation to the upside looks likely.

NFA - looks like a breakout soon. Descending channel may break to the upside. RSI and EMA are undersold

BONK 4H. Big Swing Ahead. 12/14/24After reaching a local high, the price retraced and moved into a correction phase. During this correction, the support level at $0.003183 was held, indicating bullish sentiment among buyers.
It’s worth considering opening a position from the current levels, whether for spot trading or a swing position on futures (with low leverage and a small percentage of your deposit). For those concerned about drawdowns, positions can also be accumulated or added from the support level at $0.003183.
Here are my parameters:
Entry Point (EP): Current price
Take Profit (TP): $0.005553, $0.006426, $0.007446
Stop Loss (SL): $0.002587
But remember: your money — your responsibility!
P.S.: I'm aware of the additional zeroes after the decimal; they’ve been omitted for simplicity. All levels are shown on the chart!
DYOR.

I'll point out a nice sign.BONK is showing bullish divergence at the flag formation.
It is a very significant signal. Yes, the supplay is very large,
but in the short moment the most unexpected prices are possible.
Let the day come!


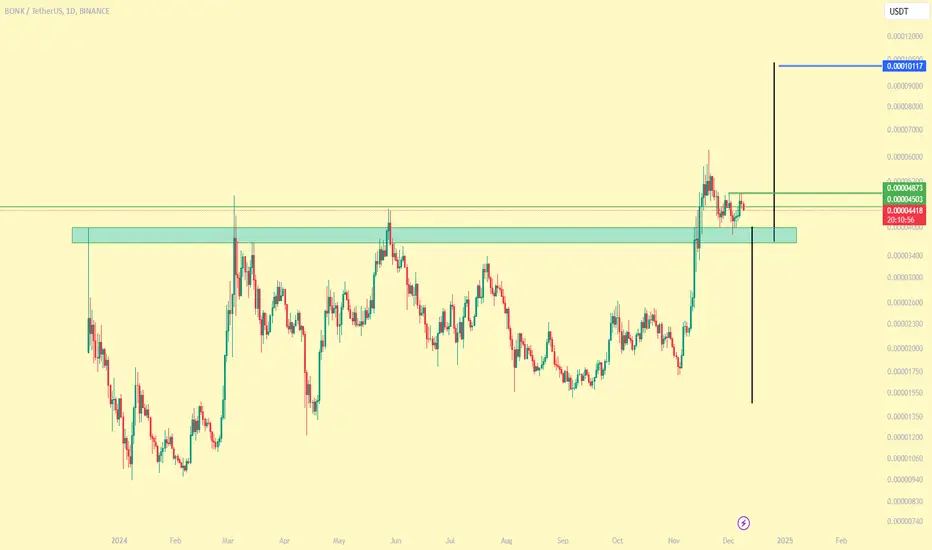
BONK/USDTNice looking setup to go long. I have already entered here... will DCA as we go lower. Entry will be a close above the green line. TP blue line. Price is currently building support above major resistance levels. Price is consolidating since mid November. Time for a run. Enjoy
BONKUSDT: descending triangle breakout!! Join our community and start your crypto journey today for:
In-depth market analysis
Accurate trade setups
Early access to trending altcoins
Life-changing profit potential
Let's analyse BONKUSDT:
TECHNICAL ANALYSIS:
BONK is currently consolidating within a parallel channel. After breaking out of a descending triangle pattern and undergoing a corrective pullback, the price has found support at the 100-day EMA on the daily chart.
The previous breakout led to a significant 135% price surge, and a similar rally is anticipated as the price approaches the upper boundary of the parallel channel. Bullish crossovers in RSI and MACD indicators further support the bullish outlook for BONK.
Key Level:
Entry: CMP to $0.000033
SL: $0.000028
Leverage: 2-3x
Target:
$0.000046
$0.000055
$0.000068
$0.000089
If you find this analysis helpful, please hit the like button to support my content! Share your thoughts in the comments and feel free to request any specific chart analysis you’d like to see.
Happy Trading!!

BONK Price Holds Ground as Indicators Show Recovery SignsBINANCE:BONKUSDT has exhibited resilience on the 1-hour chart, with prices attempting to climb despite bearish undercurrents. The 9 EMA remains below the 20 EMA, hinting at lingering selling pressure. However, the MACD histogram’s gradual rise signals a possible shift in momentum favoring buyers. The RSI’s movement toward neutral levels further reflects a tug-of-war between bulls and bears.
Resistance at $0.00003605 represents the first significant hurdle, with higher targets at $0.00003841 and $0.00004235. On the downside, $0.00003274 provides the nearest support. A breach here could open the way for extended losses.
For bullish positions, entering near $0.00003524 with a stop loss below $0.00003274 may be ideal, targeting $0.00003605. For bearish traders, a short entry on a rejection at $0.00003605 or a break below $0.00003274 could yield returns, with an exit around $0.00003200.

BONK/USDT Analysis#BONK/USDT Analysis
The $BONK/USDT pair is currently trading within a corrective structure, with a strong support zone identified at $0.0000292051, offering a strategic entry opportunity for long positions.
The price is moving within a downward-sloping channel, indicating a consolidation phase, with a potential breakout toward higher levels.
Entry Zone: Around $0.000029
Stop Loss: Below $0.000026 to minimize risk
T1: $0.000068

BONK/USDT- BUY SETUPBINANCE:BONKUSDT
✔︎ENTRY :0.00004358
🏓TARGETS :
✔︎T1 : 0.00005098
✔︎T2 : 0.00006223
✔︎T3 : 0.00007639
✘STOP : 0.00004062
💡Reason for this trade:
This trade gives my trading system a sign of strength:
• My trading system is based on liquidity and reversal zones.
• When the liquidity is swept from one side under certain conditions, we will wait for the price on the other side.
The liquidity will attract the price like a magnet.
• the first side that has been swept:
1- 00
2- 00
3- 00
• Opposite side targets:
1- range low
2- failure swing point
3- sweep HVN
💡Entry setup
1- reclaim HVN
2- GOLDEN zone
3- reclaim HVN
all aligned in same conflunce zone
⚠️WARNING:
• I'm not a financial advisor.
• Do your own research (DYOR).

Bonk - Golden Retest
Looking at our previous post we were identifying the red box as a key level of liquidity for BONK. It was a previous level of old resistance flipped into a new level of support.
We just had a flash crash today across the board for alts so how did this affect BONK? Well actually it might've given bonk the liquidity need to start its next leg!
See we did deviate below our range (red box) but after testing the 0.618 and also the key yellow line around $0.000034 (weekly candle bodies) we have seen massive demand. So far price has moved back up almost 20% from the lows! If we can reclaim the red box around $0.00004 and continue to close weekly candles above that box then this will be the bottom for the next leg.

BONK - Get ready to get BONKED!BONKUSDT - JUST PLEASE OBSERVE THE DOODLE the exact way i drawed. The cyan block if kept with good vol, ret ready for 0.00006616!

BONK BONK is currently forming a symmetrical triangle pattern and has broken out. BONK is above MA 7, and indicates the next bullish direction.
Resistance: 0.00006500
Support : 0.00004250
Target: 0.0001200

BONK/USDT - H4 - Wedge BreakoutThe BONK/USDT pair on the H4 timeframe presents a Potential Buying Opportunity due to a recent breakout from a Wedge Pattern. This suggests a shift in momentum towards the upside and a higher likelihood of further advances in the coming Days.
Possible Long Trade:
Entry: Consider Entering A Long Position Above The Broken Trendline Of The Triangle After Confirmation. Ideally, This Would Be Around Breakout.
Target Levels:
1st Resistance
2nd Resistance
Your likes and comments are incredibly motivating and will encourage me to share more analysis with you.
Best Regards, KABHI FOREX TRADING
Thank you.


BONK Buy Setup (2H)From the point where we've placed the red arrow on the chart, it seems that BONK's correction has begun.
This correction appears to be a diametric pattern that is nearing completion.
As long as the price stays within the green zone, it could move toward the targets. The targets are marked on the chart.
A daily candle closing below the invalidation level would invalidate this analysis.
For risk management, please don't forget stop loss and capital management
When we reach the first target, save some profit and then change the stop to entry
Comment if you have any questions
Thank You


$BONKrsi turning up nearing the moment of truth
got a bag for range high here around .0549
above 200 on H4 and VWAP from last move
invalidation acceptance below white line

