Live buy signal in AxisBank at 1182.6Live Khareedo (Buy) signal in AxisBank at 1182.6. Lets see how much it will rise.
Note: This is not a buy/sell trade call. Use stop loss.
AXISBANK trade ideas

AxisBank could drop to 1150 and 1100 for bounce backAxis Bank could drop to 1150 and 1100 levels for bounce back to 1200 and plus levels.
Note: This is not a buy/sell trade call. Trade at your own will and analysis. Use stop loss too.

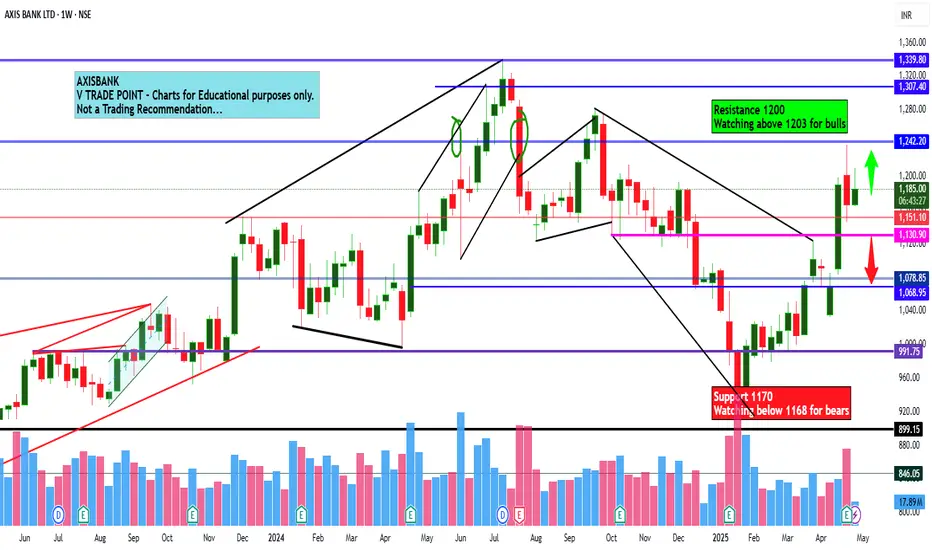
Axis Bank Ltd view for Intraday 5th May #AXISBANK Axis Bank Ltd view for Intraday 5th May #AXISBANK
Resistance 1200-1202 Watching above 1203 for upside movement...
Support area 1170 Below 1180 ignoring upside momentum for intraday
Watching below 1168 for downside movement...
Above 1180 ignoring downside move for intraday
Charts for Educational purposes only.
Please follow strict stop loss and risk reward if you follow the level.
Thanks,
V Trade Point

Axis Bank Ltd view for Intraday 2nd May #AXISBANK Axis Bank Ltd view for Intraday 2nd May #AXISBANK
Resistance 1200 Watching above 1203 for upside movement...
Support area 1170 Below 1190 ignoring upside momentum for intraday
Watching below 1168 for downside movement...
Above 1190 ignoring downside move for intraday
Charts for Educational purposes only.
Please follow strict stop loss and risk reward if you follow the level.
Thanks,
V Trade Point
Axis Bank Ltd view for Intraday 28th April #AXISBANK Axis Bank Ltd view for Intraday 28th April #AXISBANK
Resistance 1175 Watching above 1177 for upside movement...
Support area 1160 Below 1160 ignoring upside momentum for intraday
Watching below 1157 for downside movement...
Above 1170 ignoring downside move for intraday
Charts for Educational purposes only.
Please follow strict stop loss and risk reward if you follow the level.
Thanks,
V Trade Point

63 points dropped #AxisBank after #SignalsWalaJin signal63 points dropped #Axisbank share after generation of Signal "Becho" means sell by my custom designed indicator named SignalsWalaJin
Note: This is not a buy sell trade call. Trade at your own will. Use stop loss too.

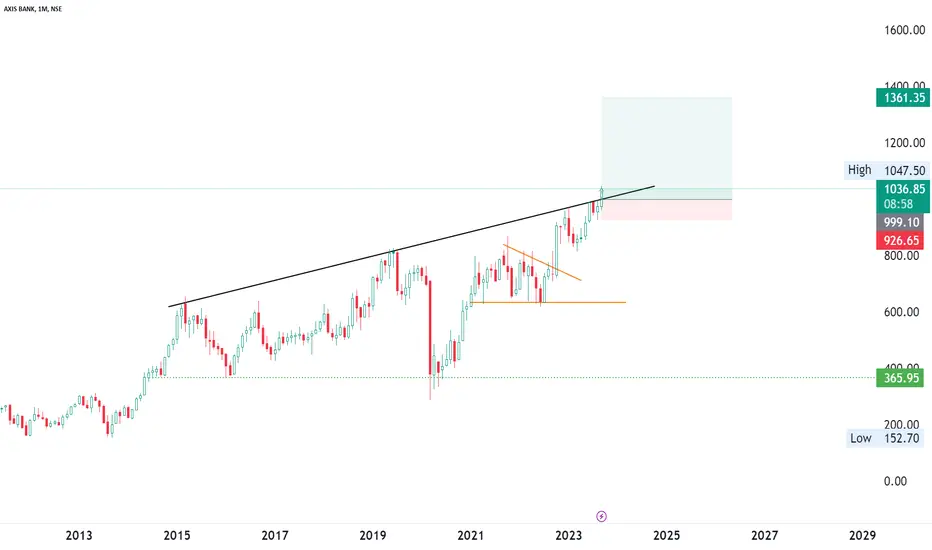
AXIS BANK will touch 1273 than 1349 Soon.Axis bank is in Bull run with cup and handle pattern going to be finish and going to be touch last High soon.

AXISBANK – Classic Cup & Handle Breakout | Targeting 1280 & 1320🧠 Technical Analysis:
AXISBANK has formed a textbook Cup and Handle pattern over the past few months. The breakout above the resistance zone around ₹1199 marks a potential start of a new bullish rally.
🔹 Cup Formation: Rounded bottom between Dec 2024 - Apr 2025
🔹 Handle Formation: Consolidation range in Oct - Dec 2024
🔹 Breakout Candle: Strong bullish candle with increasing volume
🔹 200 EMA: Price is now well above the 200 EMA, adding to the bullish bias
🎯 Targets:
Target 1: ₹1280
Target 2: ₹1320
These levels are based on the measured move technique and previous swing highs.
🛡️ Support:
Immediate support lies around the breakout zone near ₹1199
Next strong support is near ₹1090 (200 EMA)
📊 Volume:
Breakout accompanied by a surge in volume confirms buyer interest and validates the pattern.
📌 Conclusion:
AXISBANK is showing strong bullish momentum with a confirmed breakout from a well-defined Cup and Handle formation. As long as it sustains above ₹1199, the stock could potentially rally toward ₹1280 and ₹1320 in the coming sessions.
📅 Keep it on your radar for bullish continuation setups!
Disclaimer:
This analysis is shared purely for educational and informational purposes and should not be considered as financial advice or a recommendation to buy or sell any security. Always do your own research and consult with a qualified financial advisor before making any investment decisions. Trading and investing involve risk.

AXISBANK 1190 - trend directionAXIS Bank 1190 - has given breakout but as signals are diverging we are negative with the breakout. Fib measured resistance 1214 need to be crossed for bullish confirmation. if fails it will drop back to 1000.

Axis Bank left bearish zoneAxis bank just left bearish zone and entered bullish zone.
Note. This is not a buy sell trade call.

AXISBANK(13 March 2023)→Type of trade:BREAKOUT TRADE(TC09)AXIS BANK (13 March 2023) → Type of trade: BREAKOUT TRADE (TC09) (IN FOLDER)
→ Result of Breakout in hindsight : It was a GENUINE BREAKOUT
RED STICKER - SHORT TRADE - HORIZONTAL LINE BREAKDOWN
---------------------------------------------------------------------------------------------------------------
TRADE OVERVIEW
---------------------------------------------------------------------------------------------------------------
WHEN WE IDENTIFIED THIS SETUP? OFF-MARKET HOURS (DURING H.W) OR LIVE MARKET?

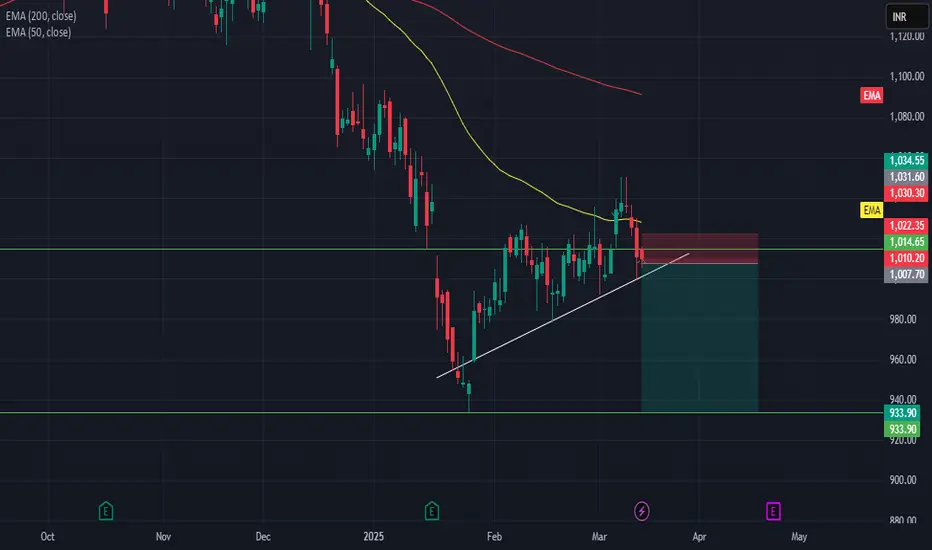
Axis Bank Short Position Axis bank has formed a Death Crossover on chart i.e 50 and 200 Ema Forming a Crossover leading to Downtrend of the prices . The price after making a lower high taking resistance from 50 EMA and now it is moving towards prev. low swing again and seems like it has weakness and could break trendline . Also there is a news Catalyst which is of Indusind Bank which will also help price to move towards low areas .
AXIS BANK trading above AVWAPStock Analysis : 10th March 2025
The stock is trading above the AVWAP. Good to monitor this stock for long term investment.

AXIS BANK--DZ & Trendline Resistance??AXISBANK is still in its bearish trend....
if we clearly observe we have a strong demand zone lies at 884.
On the topside, we have a resistance in the form of trendline.
keep safe here going long in this stock price.
we have strong liquidity above the trendline, after grabbing that liquidity price may again turns to be bearish.
we know already price taken the trendline liquidity below the support levels at 920-960 levels.
If price takes the liquidity again at 920 levels with a strong consolidation will go for long side when it enters in the demand Zone.
Wait and watch levels are trendline Resistance and demand Zone.
fake breakout chances are more above the upside trendline.
if price breaks the trendline strongly then on a pullback we have to look for a buy until avoid buying in this stock price.

AXISBANKNSE:AXISBANK
One Can Enter Now !
Or Wait for Retest of the Trendline (BO) !
Or wait For better R:R ratio !
Note :
1.One Can Go long with a Strict SL below the Trendline or Swing Low.
2. R:R ratio should be 1 :2 minimum
3. Plan as per your RISK appetite and Money Management.
Disclaimer : You are responsible for your Profits and loss, Shared for Educational purpose
Axis BankPrice & Time analysis. It is in at very crucial junction. Bigger trend is down. But we have see some up strength.

AXISBANK KEY LEVELS FOR 18/02/2025//description
// All credit goes to Tony for the concept of this indicator. His Trading View link: www.tradingview.com
// Note: The calculation method in this indicator differs from Tony's, but the concept is derived from his work.
I want to make it clear that I am not a seller, and this method was not taught to me by anyone. The original creator only gave me one clue:
👉 "If you get one level, you get all levels."
Everything else—the way I nail it the method and applied it—is my own work. I respect the original idea, but my approach is independent.
Explanation:
This trading system helps you avoid blind trades by providing confirmation for better entries and exits.
Entry/Exit Points:
- Entry/Exit Lines: Use the BLACK line for long trades and the RED line for short trades, based on confirmation from your trading plan.
- Stop Loss: For long trades, set the stop loss at the RED line below. For short trades, set it at the BLACK line above.
- Take Profit: For long trades, target the next RED line above. For short trades, target the next BLACK line below.
Timeframe:
Use a 5 mins timeframe for trading.
Risk Disclaimer:
This setup is for educational purposes. I'm not responsible for your gains or losses. Check the chart for more details.

Axis Bank Demand ZoneAxis Bank Demand Zone refers to a specific price level or range where Axis Bank's stock is expected to find strong buying interest, potentially leading to a reversal or bounce in its price. This concept is commonly used in technical analysis by traders and investors to identify key support levels.
Key Points:
1. Demand Zone: A price area where buyers are likely to step in, causing the price to rise. It is often identified by previous areas of consolidation, support levels, or areas where the price has reversed upward in the past.
2. How to Identify:
- Look for historical price levels where Axis Bank's stock has consistently found support.
- Use tools like horizontal support lines, moving averages, or Fibonacci retracement levels.
- Analyze volume patterns to confirm increased buying activity at these levels.
3. Why It Matters:
- Helps traders identify potential entry points for buying the stock.
- Provides a risk management tool by setting stop-loss orders just below the demand zone.
- Indicates areas where the stock is likely to reverse or consolidate.
4. Current Demand Zone for Axis Bank:
- To identify the current demand zone, you would need to analyze the stock's recent price action on a chart. For example, if Axis Bank's stock has recently bounced from a price level of ₹1,000 multiple times, that level could be considered a demand zone.

AXISBANK KEY LEVEL FOR 17/02/2025//description
// All credit goes to Tony for the concept of this indicator. His Trading View link: www.tradingview.com
// Note: The calculation method in this indicator differs from Tony's, but the concept is derived from his work.
I want to make it clear that I am not a seller, and this method was not taught to me by anyone. The original creator only gave me one clue:
👉 "If you get one level, you get all levels."
Everything else—the way I nail it the method and applied it—is my own work. I respect the original idea, but my approach is independent.
Explanation:
This trading system helps you avoid blind trades by providing confirmation for better entries and exits.
Entry/Exit Points:
- Entry/Exit Lines: Use the BLACK line for long trades and the RED line for short trades, based on confirmation from your trading plan.
- Stop Loss: For long trades, set the stop loss at the RED line below. For short trades, set it at the BLACK line above.
- Take Profit: For long trades, target the next RED line above. For short trades, target the next BLACK line below.
Timeframe:
Use a 5 mins timeframe for trading.
Risk Disclaimer:
This setup is for educational purposes. I'm not responsible for your gains or losses. Check the chart for more details.

AXIS BANK PROJECTION FOR THIS MONTH 10 FEB2025 TIME 22.45 Axis Bank is one of India’s leading private sector banks, offering a comprehensive range of financial products and services to individuals, businesses, and corporations. Established in 1993 as UTI Bank and later rebranded as Axis Bank in 2007, the bank has grown significantly over the years, establishing a strong presence in both domestic and international markets. Headquartered in Mumbai, India, Axis Bank operates through a vast network of branches, ATMs, and digital platforms, providing seamless banking experiences to its customers. The bank's business operations span across retail banking, corporate banking, and treasury services. In retail banking, Axis Bank offers savings and current accounts, fixed and recurring deposits, credit and debit cards, personal loans, home loans, vehicle loans, and wealth management solutions. Its corporate banking segment caters to large and mid-sized enterprises, offering working capital loans, trade finance, treasury management, and cash management services. Additionally, Axis Bank has a strong focus on digital banking and fintech collaborations, ensuring innovative solutions for customers through platforms like mobile banking, internet banking, and UPI-based services. The bank also actively participates in investment banking, foreign exchange services, and financial advisory, further diversifying its portfolio. With a commitment to sustainability and corporate social responsibility, Axis Bank continues to expand its footprint in India's banking sector, driving financial inclusion and economic growth.

Axis Bank Share Price UpdateAs of the close of trading on Tuesday, February 4, 2025, Axis Bank's share price stood at ₹1,015.45, marking a 2.62% increase from the previous day. This performance surpassed the broader market, with the BSE SENSEX Index rising by 1.81% to 78,583.81. Despite this gain, Axis Bank's shares remain 24.19% below their 52-week high of ₹1,339.55, achieved on July 12, 2024

AXISBANK KEY LEVELS FOR 03/02/2025**Explanation:**
This trading system helps you avoid blind trades by providing confirmation for better entries and exits.
**Entry/Exit Points:**
- **Entry/Exit Lines:** Use the BLACK line for long trades and the RED line for short trades, based on confirmation from your trading plan.
- **Stop Loss:** For long trades, set the stop loss at the RED line below. For short trades, set it at the BLACK line above.
- **Take Profit:** For long trades, target the next RED line above. For short trades, target the next BLACK line below.
**Timeframe:**
Use a 5 mins timeframe for trading.
**Risk Disclaimer:**
This setup is for educational purposes. I'm not responsible for your gains or losses. Check the chart for more details.

AXISBANK - Whats nExt?So after some anticipation from my indian friends for HDFC Bank LTD, here its for AXISBANK ltd. Here breaking blackline with vol, would fill the 1033 the upside tasuki gaps, but high FVG below the line i marked!
