AXISBANK Sell on riseAxisbank running on a range of 830 906 - As last time we saw Break down support 908 and fall was till 830...
now fresh normal support 854. hold than bounce else again we will see towards 830.
Major demand Zone 824CB Break than Ready for journey towards 780 724+++
View will be invalid above 906 916 !!!!
AXISBANK trade ideas

#Axisbank cash : Strong support at 815#Axisbank cash
15.03.2023
Strong Support at 815
(Marking given on chart)
CMP 824

axis bank longaxis bank long from the given 813-816 dz
1st day tf demand
2nd axis has filled the gap of october
targets are 861-866 and 904-908
stop loss is day closing below 813

AXISBANK : Intraday levelsAXISBANK levels marked on chart with daily & H & 15 min chart.
Levels are marked on chart for intraday. Follow price action and become Price action chart Specialist.
Like, Share, Comment for regular updates.
Disclaimer
I am not sebi registered analyst
My studies are Educational purpose only
Please consult with your Financial advisor before trading or investing
I may be 100% wrong as its my personal trade.
First Learn and then remove "L"

AXIS BANK HIDDEN DIVERGENS IN DAILY TFDisclaimer- The risk of loss in trading stock, future,forex and option is substantial and losses may exceed initial investments. Past performance,wherther actual or simulated, is not indicative of future results. By viewing this video you agree that decision to purchase or sell any financial product is the sole responsibility of the person initiating such a transaction, specifically you. and Wealth Depth or this Youtuber is not responsible for your decisions or their consequences. This Video is for educational purpose only.
Thank You...😊

Axis Bank potential Market Fallout: A Break Below 828A downside breakout below the key level of 828 in the market could lead to further price decreases. If the price falls below 828 and remains there, it is likely that the market will experience more fallout. It is important to monitor the market closely and consider adjusting investment strategies accordingly. NSE:AXISBANK

Axis Bank Short SellAxis Bank Short Sell
Gap at 830
short sell at 890
Stop loss at 912
Target 830
Time line - 10 days


Axis BankThis is My View on this Stock . . . for using Smart Money Concepts and get my ideas and candlesticks patterns using . . .

Bullish on AXISBANKhigher high on day chart, which means uptrend. Broke two day high as well day high. SL can be placed at 853.15

AXIS BANKTHE IDEA WILL BE ONLY FOR STUDY PURPOSE .
wait for the breakout till then keep your eye on the stock .


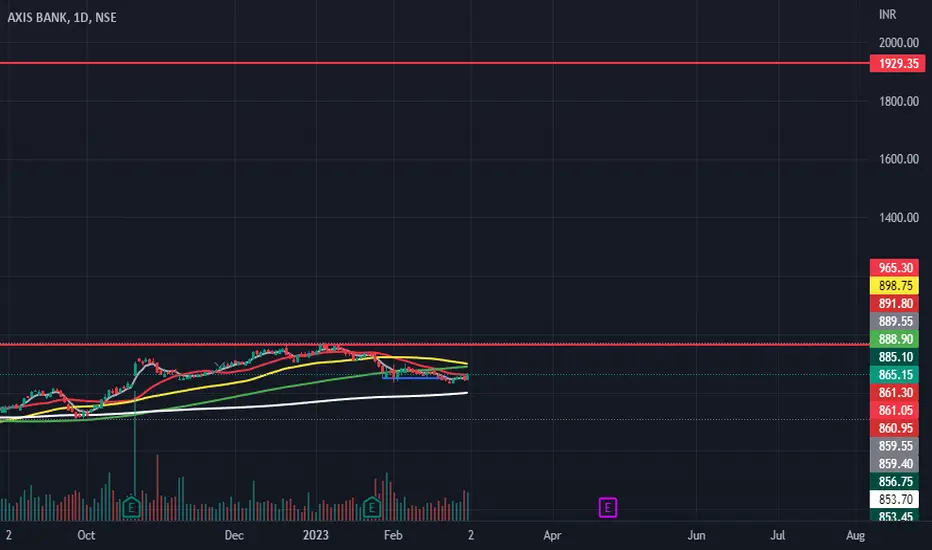
Axis Bank Can be Long for Long-term Targets.Axis Bank Looks good on Charts. Trading below its Book Value.
Its the good time to Accumulate, Buy in Dip Strategy.
Buy Axis Bank.
SL 750
Target 1 : 962 (Short-term).
Target 2 : 1929/1969 (Long Term).
Have A Good Day Traders.
Axis BankAxis Bank Gann reversal date 26-Feb-23
Axis Bank CMP 855
SL 830
Target 900++
Positional / swing.

try to short in few day if you trade in future its good opportunity buy pe 840 axis bank when it goes to 960 here 960 become resistance become resistance

axis bank is looking good with a great entry pointthere is a very good entry point in axis bank as it has completed it's wave cycle there is a very good chance that it can start a new wave cycle from here and if that is so then axis will not go below 846 on a closing basis so there is a very good risk reward trade here target will be around 910 ,915 not more at this point at time axis chart is similar to nifty but without any toxic waste to carry like nifty has to so I am buying axis with stops below 830 on closing basis


Buy Axis Bank for Intraday.Axis Bank Support is near 850.
Buy Axis Bank for Intraday.
Target is 870.
SL 548.

Bullish on AXISBANK if!On the day chart, we have a support candle followed by a confirmation candle. On the 15 mins chart, if it breaks two-day high i.e, 871.95, it is a good opportunity to buy.

AXISBANK Potential for Bearish Drop | 6th February 2023Looking at the H4 chart, my overall bias for AXISBANK is bearish due to the current price being below the Ichimoku cloud, indicating a bearish market.
Looking for a pullback sell entry at 908.00, where the overlap resistance and 50% Fibonacci line is. Stop loss will be at 970.00, where the recent swing high is. Take profit will be at 702.30, where the overlap support is.
Any opinions, news, research, analyses, prices, other information, or links to third-party sites contained on this website are provided on an "as-is" basis, as general market commentary, and do not constitute investment advice. The market commentary has not been prepared in accordance with legal requirements designed to promote the independence of investment research, and it is therefore not subject to any prohibition on dealing ahead of dissemination. Although this commentary is not produced by an independent source, FXCM takes all sufficient steps to eliminate or prevent any conflicts of interest arising out of the production and dissemination of this communication. The employees of FXCM commit to acting in the clients' best interests and represent their views without misleading, deceiving, or otherwise impairing the clients' ability to make informed investment decisions. For more information about the FXCM's internal organizational and administrative arrangements for the prevention of conflicts, please refer to the Firms' Managing Conflicts Policy. Please ensure that you read and understand our Full Disclaimer and Liability provision concerning the foregoing Information, which can be accessed on the website.

Axis Bank for longTrend line support taken, target will be 1021
In monthly time-frame breakout happened , in Day time trend line support taken
Target will be 1021

AXISBANK retracement over ??$AXISBANK 's retracement (daily TF) might be over as it is showing signs of strength on it's rising window. We can look for an intraday entry if the price spends some time at the swing high and then breaks out or we can also enter as a swing trade for a target till the recent swing high on daily TF.
