HAVELLS | SWING | LONGPrice is currently in Stage 2 and forming a base near ATH.
Price is being followed by 20 EMA. Thus, showing momentum.
Need a contraction near highs at a smaller TF to execute an entry.
HAVELLS trade ideas

Havells India LtdTARGET MENTIONED IN CHART - SL 1240
LONGTERM
FUNDAMENTALS
Market Cap
₹ 94,711 Cr.
Current Price
₹ 1,511
High / Low
₹ 1,511 / 1,128
Stock P/E
80.1
Book Value
₹ 110
Dividend Yield
0.51 %
ROCE
22.3 %
ROE
17.0 %
Face Value
₹ 1.00
Price to book value
13.7
Intrinsic Value
₹ 464
PEG Ratio
7.93
Price to Sales
5.26
Debt
₹ 268 Cr.
Debt to equity
0.04
Int Coverage
43.2
Reserves
₹ 6,837 Cr.
Promoter holding
59.4 %
Pledged percentage
0.00 %
EPS last year
₹ 17.1
Net CF
₹ -311 Cr.
Price to Cash Flow
168
Free Cash Flow
₹ -20.6 Cr.
OPM last year
9.58 %
Return on assets
9.89 %
Industry PE
60.5
Sales growth
9.28 %

Havells Intraday level for 10th July #HAVELLS Havells Intraday level for 10th July #HAVELLS
Buying opportunity above 1941
Support area 1910. Below ignoring buying opportunity
Charts for Educational purposes only.
Please follow strict stop loss and risk reward if you follow the level.
Thanks,
V Trade Point

HAVELLS- Look good for Long term potential 10X stock
HAVELLS- Look good for Long term potential 10X stock
Buy Above :- 1242 Averaging Levels 1172
Swing traderStop loss - 1209
Investment Stoploss - 1050
Few targets to Monitor
1387 , 1540, 1701, 1800+
Please comment if you wish to see my analysis for any stocks.
Please do your due diligence before trading or investment.
Thank you.

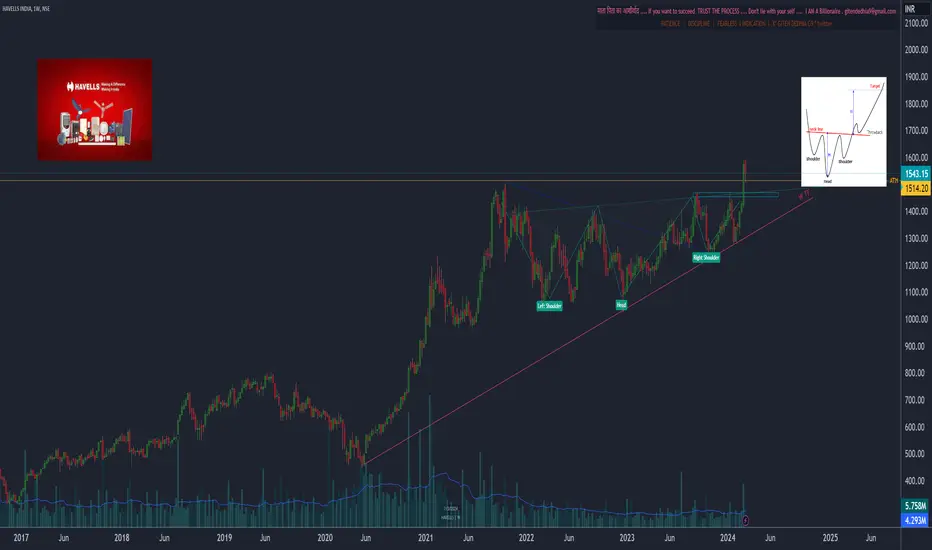
HAVELLS INDIA LTD S/RSupport and Resistance Levels: In technical analysis, support and resistance levels are significant price levels where buying or selling interest tends to be strong. They are identified based on previous price levels where the price has shown a tendency to reverse or find support.
Support levels are represented by the green line and green shade, indicating areas where buying interest may emerge to prevent further price decline.
Resistance levels are represented by the red line and red shade, indicating areas where selling pressure may arise to prevent further price increases. Traders often consider these levels as potential buying or selling opportunities.
Breakouts: Breakouts occur when the price convincingly moves above a resistance level (red shade) or below a support level (green shade). A bullish breakout above resistance suggests the potential for further price increases, while a bearish breakout below support suggests the potential for further price declines. Traders pay attention to these breakout signals as they may indicate the start of a new trend or significant price movement.
Disclosure: I am not SEBI registered. The information provided here is for learning purposes only and should not be interpreted as financial advice. It is important to consult with a qualified financial advisor before making any investment decisions. Tweets neither advice nor endorsement.

Havells At Retest Levels. Swing EntryHavells have given a good breakout from its resistance zone and now at retest levels.
Can consider for swing trading.

Ascending Channel Pattern.3 Years Ascending Channel Pattern Breakout,. Sl 4% to 5%, Reward upto 50% With TSL or we can increase Target According price pattern.

DIFFERENT STAGES OF A STOCK PRICE (TATA COFFEE)It shows the way stock price made a base at the all time highs and finally broke out of it and created another little base before entering the stage 2.

DIFFERENT STAGES OF THE PRICE OF A STOCK (HAVELLS)The price made a base at all time highs thus completing the stage 1 and finally broke out of it to begin the stage 2.


reversing from support Busllish engulphing
target 1600, 1750
SL 1440
self explainatory
strictly educational purpose

havellsIndian consumer goods companies such as makers of cooling systems, beer and ice cream are attempting to capitalise on a hotter-than-usual summer season by cranking up output, launching new products and ramping up spending on marketing.
The world's most populous nation expects 10 to 20 heatwave days, which it describes as temperatures hitting at least 40 degree Celsius in the plains, from April through June this year, versus the normal four to eight days. Already temperatures have crossed 40 degrees in a few cities in the western Maharashtra and Gujarat states.

HAVELLS WITH BULLISH MOMENTUMHavells stock presents an enticing opportunity with a stop loss set at 1450 and a target of 1600. Riding on bullish momentum, let's aim for growth while managing risk effectively

HAVELLSThese are swing ideas which you can add your watchlist and analysis for yourself !
Keep on your radar

havells 1w time frame buy@ 1474 target @ 1678, 1720, 1776 havells 1w time frame
buy@ 1474 target @ 1678, 1720, 1776
symmentric triangle breakout
risk reward 1.5
its just a view trade @ your own risk
sl@ 1298

ALL TIME HIGH BREAKOUT STOCKNSE:HAVELLS
All information on this page is for educational purposes only,
we are not SEBI Registered, Please consult a SEBI registered financial advisor for your financial matters before investing And taking any decision. We are not responsible for any profit/loss you made.

HavellsBreakout spotted with good volume. Daily RSI is approaching overbought levels so it could slightly pull back the price for few days that would allow entry for new participants at some discount from CMP for fresh position, rest looks good.

Swing tradegood pattern forming on 1 month time frame and range is becoming so narrow more possibilities giving break out up side and expect s 30% return from current level,

Havells India- Bullish Structure- New all time High SoonHavells India is looking bullish now, pleae keep a close watch as it will make a new all time high soon if market supports.


havells, good setup formed.havells, if show reversel from here then can enter into it. stoploss can be clearly seen in pic. and yeah trade tabhi lena jab koi reversal dikhe, sidha yahan par mat le lena.
aur comment kar diya karo yaar, comment ke rupee nahi lagte.

Havells (Swing):Havells (Swing):
Havells is attempting to break a major resistance and well set for a 35-40 % up move.
Appropriate supply and demand zones are highlighted with target.
Keep adding between 1300-1375 with a SL around 1200.
Trade offers a RR of more than 1:5.
Note: Do your own due diligence before taking any action.
