Sell signal for TATA CONSULTANCY SERVICES LTD (TCS)Clear sell pressure-volume, came after several upward rejections and breaching the uptrend line.
TCS trade ideas

TCS ASCENDING TRIANGLE BREAKOUT AND RISING WEDGE FORMATIONMarket analysis: Tata consultancy has broken the ascending triangle pattern structure in weekly time frame and formed a rising wedge in daily time frame. Also it has formed a double top in daily time frame. So we can wait for the market to break the neckline to start turning bearish. Can execute trades after the wedge or neckline breakout.


TCSIT pack is in momentum and TCS can lead above 2032, once it convincingly breaks 2032, you can long it for a target of 2120. View is bullish and 2032 shld be ur sl and if rises above, keep trailing the SL.

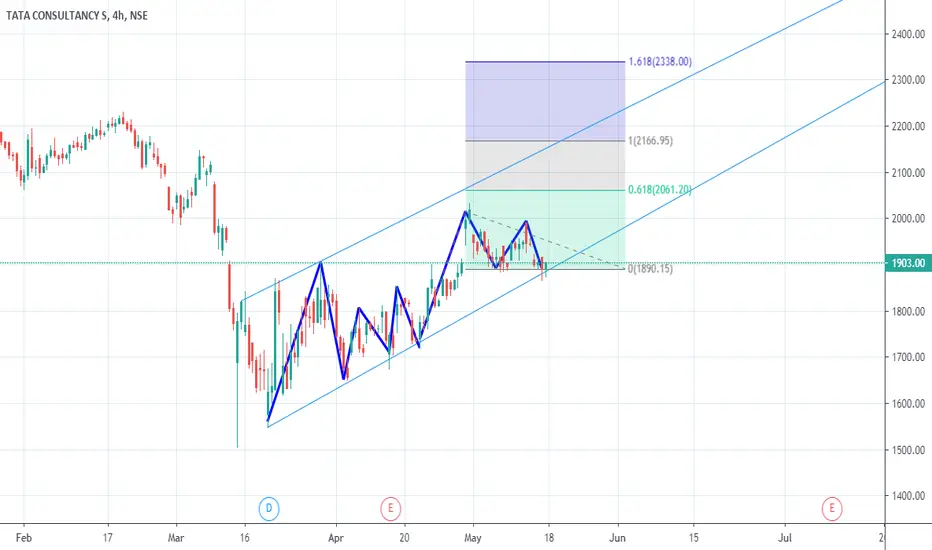
TCS Movements under ZoneBlue trendline has been acting as Support for Uptrend for weeks.
CMP: 2010
Buy Below:2k
Target seen: 2136, 2165
After that there's can be short opportunity if this trendline breaks.

TCS - GO SHORT FOR A RR OF 1:4 BY JUNE 10, 2020TCS - GO SHORT @ CMP WITH A SL OF 2146 AND A TARGET OF 1545. TARGET SHOULD BE ACHIEVED BY 15 JUNE 2020

TATA CONSULTANCY By Elliote Wave.When we Look toward TCS and drawing Elliote Wave, We will get a clear picture of the price trend.
The price is under the waves 5 Impulsive.
At 1860 You see multiple time push upside price we Can consider as good support level at 1930
"EW Trade " Target 2040-2150 for long
Thanks


TCS BULLISH ON CHARTS TCS AS SHOWING A COILING EFFECT AND IS BULLISH ON CHARTS. WE EXPECT 2145 IN THE COMING WEEKS WITH SUPPORT AT 2020. ANY BREAK ABOVE 2040 LEVELS WILL ACT AS CATALYST FOR THE BULLS TO TAKE OVER ...CAN BE A GOOD LONG ABOVE 2040

TCS : BuyLow - SellHighHope you guys are enjoying my work on TCS
Here's price action analysis of TCS with 3 zones: Buy & Sell & NoTrade Zone

TCS-the range needs to break nowTCS is back at the highs of 30 april 2020 i.e.2032. Tcs has a clear big range defined between 1836-2032 now its at the upper end of the range.Tuesday's move and close aand above this level will prompt me to take a positional trade on tcs for a target of 2095/2122.


TCS Short- Triple TopTCS is now about to form triple top at this range of 1990 to 2010. Putting Stop loss at 2020, the short can be initiated at this range.
The target can be taken for 1960 and 1900 on the downside.


TCS - GO SHORT FOR A RR OF 1:5TCS - GO SHORT @ 2035 WITH A SL OF 2147 AND A TARGET OF 1545. TARGET SHOULD BE ACHIEVED BY MID-JUNE 2020

TCS Short at 1900 ST 1970We are doing Analysis of TCS on 1 Hour Timeframe.
The projected target from the breakout is usually the vertical distance from the high to the bottom .
Note: This is only for Educational Purpose this is not an Investment advice.
Please support the setup with your likes, comments and by following on Trading View.
Thankyou
Ankur Verma
Twitter : Ankurverma3838

Head and shoulder patterThere are buy opportunities as the stock is fundamentally strong we can go long in this way

This is my first chart Head and shouter patternPlease have a look at the pattern if you simplly focus more it will head and shouter pattern has been created there are buy opportunity