Bitcoin Dominance Drops: Alt Rally Ahead! Bitcoin Dominance Breakdown Done ✅
#Alts are set to bounce hard! Follow me for alt setups and updates.
Don't miss out!
DYOR, NFA
#Crypto #Altseason
BTC.D trade ideas

BTC dominance 15 month trend has broken, Alt season startBTC dominance 15 month trend has broken, Alt season start?
With alt coins pumping and meme coin mania its a surefire sign. BTC is slowing its gains and the daily BTC dominance trend has broken. This is generally a good sign Alt season is about to start

Bitcoin DomI’m expecting Bitcoin dom to break out and test the 95% range. Close the gap, or at least make an attempt. It hasn’t moved a lot recently, but what it has done is to retrace the breakout, which was the top of the descending Fibonacci channel. Above here, and it’s a magnet to 95% test.

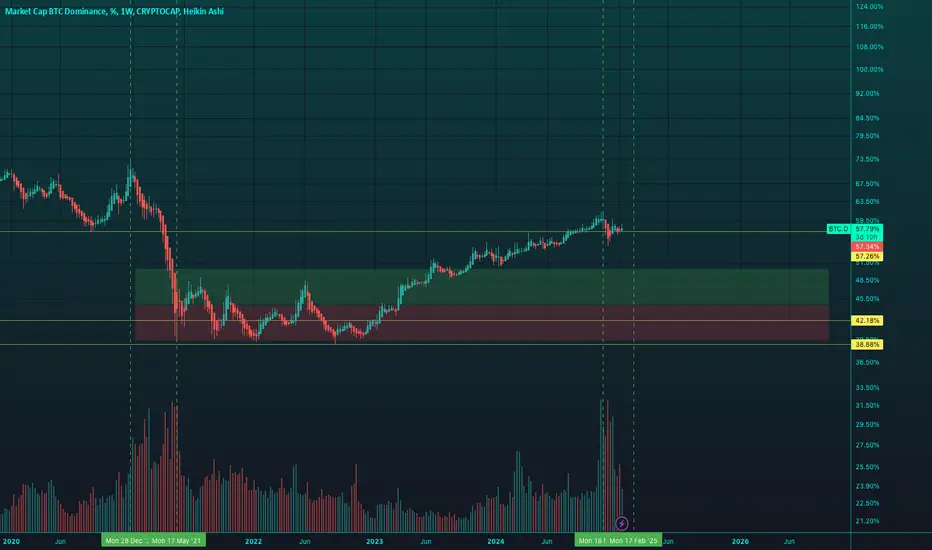
BTC Dominance logarithmic cycle105 days from the previous cycle top to low market dominance at 39%, should see BTC fall into the red zone around mid february and the end of the market.
Also a likely scenario that invalidates this, is a further purchasing in BTC to 150k following on the 3rd wave of the elliot wave pattern from it's previous low.
However in terms of both it's current dominance being lower than previous markets, and DOW, S&P and Russel 2000 being higher in fibonacci at their 4.236 from each market high to low, it's likely BTC hasn't got the strength left in it to perform, considering this is also the end of a 12 year debt cycle It's unlikely BTC has anything futher.
Additionally Pi cycle top indicators on both BTC Market cap and Price haven't triggered yet, so there is a potential it crosses soon. In which case Alt season runs adjacent with BTC price moving to 150 but Dominance slowly falls to 40% or lower over the next 2 months with no alt season continuing on BTC retracement. This essentially marks the retracement period has started, but will push for a higher price, which is similar to the 2021 market with a double top rather than 2012, or 2017 where BTC topped, and then retraced to 0.702 from a 20% correction.
BTC.D G.O.O.D BYEnothing new and the Dominance of Bitcoin Gonna fall
but that's fine bcz for now D is fall but price is rise = market Bull

#BTC Dominance is getting rejected, It's happening!!BTC Dominance has been rejected and is currently dropping on LTF and HTF.
This is good news for altcoins. It looks like the pain may be over, and now we have to wait for January 20th when Trump takes office, at least that’s my plan.
Of course, you’re free to make your own decisions. I’ve already shared a few altcoins earlier, and I’m still holding onto them, including RENDER, ENA, AAVE, XRP, ATH, MANTA, VVAIFU, and a few others.
More updates are coming soon, stay tuned!
Please support us with your likes and comments.
Thank you
#PEACE

My thoughts are giving me no peace with this idea 2 I've updated my expectations regarding the altseason after reviewing the statistics. I believe the growth of altcoins will happen in two phases: first, a drop in Bitcoin dominance to 40%, followed by a recovery to 45-50%, and then a crash below 30%. I'll share any updates if I make any fixes. The scenario is invalidated if dominance rises to 65-70%

bitcoin dominance updateWhile CRYPTOCAP:BTC.D has a lot of room for a sharp decline, #Bitcoin, on the contrary, has a lot of room to rise, which will be the highlight of the #Altcoins season.

Bitcoin Dominance To 42,0%This is not a drill.
Get ready for another 2021.
Except this one will be bigger.
The bull is cocaine and testosterone fueled.
This is going to make the tech bubble of 2000 look like an intra-day move.
Where I personally attended MURDERING everyone with NOKIA calls.

BTC Dominance UPDATE (12H)This analysis is an update of the analysis you see in the "Related publications" section
Market makers always do things to prevent retail traders from identifying the next direction. The support from the previous analysis has been engulfed, but this bounce is for order accumulation.
Based on the data available for this index, it seems we have a triangle instead of a diagonal wave B. The red zone is where candles could be rejected to the downside, and altcoins may perform better compared to Bitcoin.
A daily candle closing above the invalidation level would completely negate this outlook.
For risk management, please don't forget stop loss and capital management
Comment if you have any questions
Thank You

BTC Dominance There was a nice reaction at the red support level. It needs to break lower to confirm wave 3.

Bitcoin Dominance Like Create iHnSInverted HnS in Bitcoin Dominance is a bit scary because this is can indicating bitcoin will dump with altcoin crash or maybe bitcoin pump and altcoin stuck
just wait range breakout for better decision

ALTSEASON There is nothing more bullish than Altcoins right now.Simple charting is always the best.
The BTC Dominance just got rejected and once it crosses under the 1week MA50, it will confirm the start of the new altseason.
This is a pattern that we see every 4 years. The previous rejection and altseason took place in January 2021 and the one before in January 2017.
On top of that, the 1W RSI is getting rejected on its 10 year Resistance trendline.
This is the last call to invest in altcoins.
Follow us, like the idea and leave a comment below!!

Bitcoin Dominance Is About Give a New Life To Altcoins!Hello, Skyrexians!
We have already mentioned the importance of different crypto assets dominance analysis. Today we are goin to update the main one CRYPTOCAP:BTC.D . Last month it makes us nervous with the potential intention to set the new high. Current formation looks like a triangle - trend continuation pattern and it scares many traders. Is this nightmare is going to be true, or altseason is coming?
Let's take a look at weekly time frame. Now we use the combination of our hand made indicators: Bullish/Bearish Reversal Bar Indicator and Fractal Trend Detector . Trend detector started printing the red candles, the bearish trend late in 2023, but those time this tendency shift failed. This time we have seen two red dot on other indicator and after that trend change. In our opinion this is much stronger confirmation that altseason is really coming.
You probably already know that predicted earlier the dominance drop to 27%, but today we are talking about short term forecast, 0.61 Fibonacci level below 50% is the target for February.
Best regards,
Skyrexio Team
___________________________________________________________
Please, boost this article and subscribe our page if you like analysis!

another IHS on BTC.D? Chop chop more?We have successfully completed an IHS on a lower time frame (see my other chart)
Now we seem to have the beginnings of what could be another IHS on a higher time-frame?
Another scary pump of Bitcoin dominance incoming?
Interesting, let's see
(the chart is inverted)

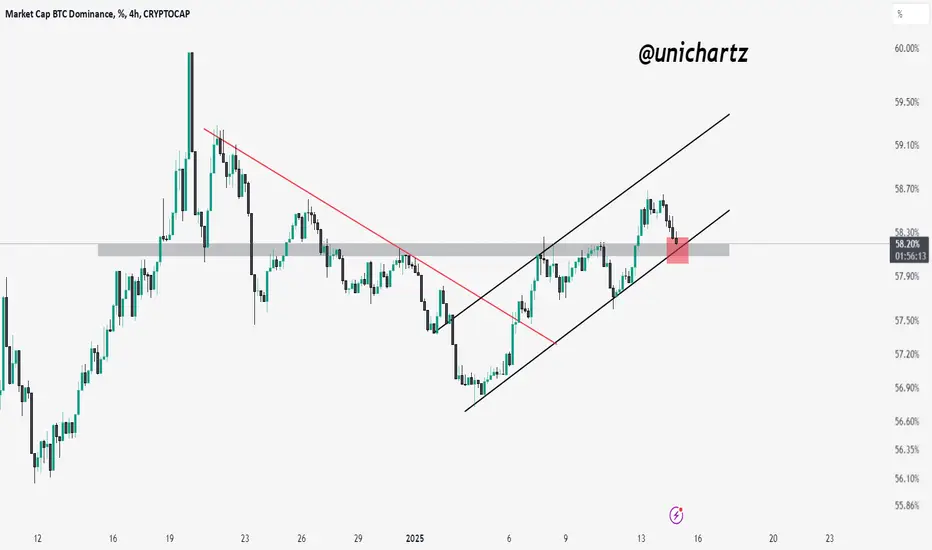
BTC.D Testing Confluence Zone: Will It Break Below?BTC dominance (BTC.D) is currently trading at a critical confluence zone, where the support of a rising channel intersects with a horizontal support level.
Many investors are closely watching this area for clarity on the next directional move. If the marked red zone (area of confluence) is broken, we could witness another leg of altseason as BTC.D trends lower.
Altseason is loading!Btc.D reached to resistant and recently it had a fake out break and trying new test from resistant if it be confirm we can see major altseason that we were waiting for
Hold your alt bag tight

BTC Dominance should dip soon.Looks like we’re close to breaking down for bitcoin dominance this is what I project. Let’s see what happens.

btc dominance$CRYPTOCAP: BTC.D
Today, I will talk about BTC dominance. I think BTC dominance will pump hard, making BTC bullish or strong. I can see BTC dominance can go to the 61-62 level again, making BTC perform better than adults. When BTC dominance reaches the 61.5 level, I will sell my BTC position because BTC dominance will dump from the 61.5 level. That's why I will buy alts coins when BTC dominance is bearish.
Right now I am holding btc

BTC.D updateBTC.D is reaching the midline of the weekly Channel and its daily resistance zone. I personally expect a correction in the coming days which can result in the pumping of the alt coins.
DYOR
Goodluck

$BTC.D: this is how they are cancelling any attempt at altseaonsSomeone is canceling the altseasons.
Every time the altcoin market starts to gain momentum, a sudden CRYPTOCAP:BTC correction halts its progress.
Altcoins are inherently riskier assets, and when fear enters the market, investors sell alts first.
Now that ETF providers hold significant amounts of CRYPTOCAP:BTC and CRYPTOCAP:ETH , they appear to be manipulating the market to maximize their Bitcoin profits. By triggering strategic crashes in CRYPTOCAP:BTC and CRYPTOCAP:ETH , they effectively prevent an altseason from taking off. Each crash leads to massive corrections in altcoins.
Today’s events are a smoking gun. The correlation with CRYPTOCAP:BTC allows ETF providers to instill fear and drive altcoin holders to sell, favoring Bitcoin.
Yesterday, all altcoins looked poised for a breakout. The MACD signaled a daily crossover, indicating sustained growth for the next two months. I even posted that CRYPTOCAP:ETH was likely to hit $3800 within a week—*unless* CRYPTOCAP:BTC crashed.
Guess what happened? CRYPTOCAP:ETH dropped 10% today—entirely due to manipulation.
There’s absolutely no reason for CRYPTOCAP:ETH to decline, except for psychological manipulation tied to its correlation with $BTC.
If altcoin holders don’t realize they’re being played by Bitcoin’s puppet masters, altcoins will continue to lose their appeal.
Investors hate losing money, right? ETF providers aim to redirect the crypto market’s wealth into their “new baby”—Bitcoin.
The result?
- BTC.D’s drop was reversed, driven by fear, as more altcoin investors panic-sell.
- USD.D increased as liquidated investors exited the market.
Where will that money go? Some will inevitably flow back into CRYPTOCAP:BTC because:
- Bitcoin has limited downside.
- Bitcoin is strong.
- Bitcoin is proven technology.
- Bitcoin isn’t a scam.
- Bitcoin is the most recognized and trusted crypto asset.
This marketing strategy is working. It’s been more than four years since we’ve seen a proper altseason.

BTC - Dominance Rise puts ALT Season on IceThe CRYPTOCAP:BTC.D index has developed an Inverse Head & Shoulder pattern on the 2H timeframe, which points to further trouble ahead until we get some certainty and clarity with how the new administration decides to move.
The recent shakedown on ALTs has been driven by higher than expected inflation and repricing of FED reserve rate cut expectations, with no rate cut expected in the next FOMC. Wednesday is a key macro day as the CPI, a key gauge of inflation is due to be released. This data ultimately shapes policy and a hot print could spell more trouble for risk assets.
Having said that, we're only a week a way from the most crypto friendly White House administration taking office.
Will the crypto friendly policies turn the page to enable Risk Assets to surge higher despite inflation woes?

BTC.D Death Cross Formation:
The “death cross” occurs when the short-term moving average (50-day MA) crosses below the long-term moving average (200-day MA).
This is considered a bearish signal, often indicating a potential decline in the market.
In your chart, the highlighted circle represents this potential crossover or the situation after it.
The narrow trendline indicates a symmetrical triangle or wedge formation, where the price consolidates before the breakout.
The breakout direction appears to be initially upward, breaking above resistance but eventually moving downward.
The blue horizontal line at around 59.21% dominance is a key resistance area.
Bitcoin dominance has broken above the triangle for some time but may struggle to remain above resistance.
After initial upward movement, the chart suggests a downward trajectory, possibly retesting lower dominance levels (towards the 55.50% and 54% areas).
This implies a potential altcoin resurgence or broader market uncertainty if BTC.D declines.
The red and green moving averages are important in defining the current trend.
A bearish cross between these moving averages aligns with the death cross narrative and signals caution.
Let me know if you’d like further assistance or adjustments!
DYOR. NFA
