Short Term bitcoin analysis (hour)Bitcoin has been in an upward channel which began at the close of the trading day of March 13 which is banded from top to bottom by about 1400 points.
From the above point of view it clear to the naked eyes that Bitcoin is in an uptrend but there is a caveat to this bullish nature which is the trading day of march 12 which opened at 7940 and closed at 4778.
Since march 12 Bitcoin hasn't closed below or above this prices(7940 and 4778) but because of the bullish channel which I point out, the fundamentals that favours crypto currencies at the moment and price action analysis which is a relative long term view my bias is bullish on Bitcoin.
The big question is where will/can you buy?
In the past 3 days Bitcoin has traded in a range (High 7764 low 7380) and with the long term bias as bullish the best area to buy should be at the low of the range which is 7380 area or 7100 area (this is because there is a strong support zone at this level and if the market makes it to this price area then it is an ideal zone to buy)
If price should close below the lower band of the channel I analyzed above then the bullish run might be over.
Please note: this is not a financial advice but my personal understanding of the bitcoin market.
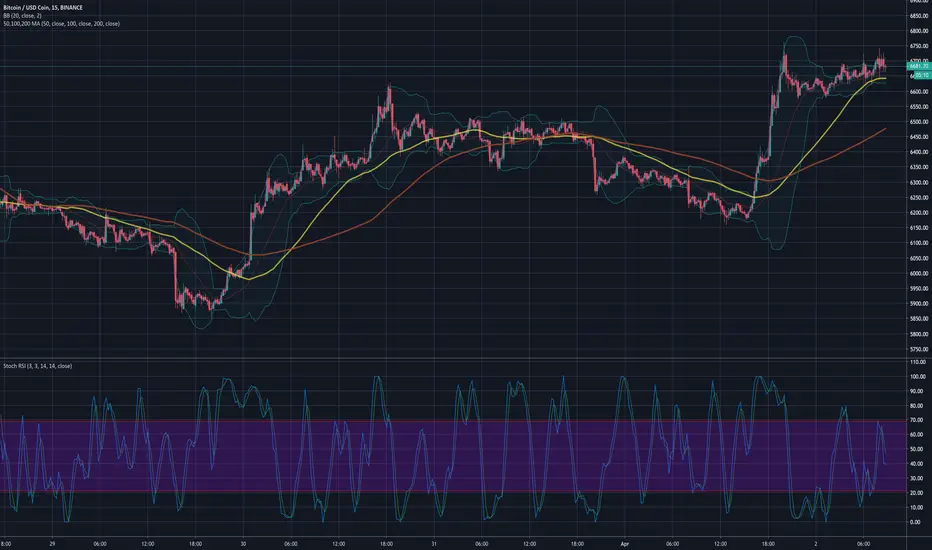
BTCUSDC.P trade ideas


26 day until btc halves rallywhile experts call for dumps for the pass 3 days i had a totally different outlook after rally to bch an bsv halve it dipping but now its new rally until btc halves the big crash expert are calling for will only occur in 26 to 28 days out ..has seen on My TA


BTC/USDWe are at the range low , looking weak below 20,50,200 EMA, Short opportunity Royal
We will notify when to short

Possible Bitcoin short term scenario pre-halvingThis could be a possible short term outcome for Bitcoin pre-halving and post halving. Please take into consideration that we could go lower into the $4,000 price range but if Bitcoin respects the fib lines at the low $5k level then we could be seeing the second higher low into the halving. I would be very excited to see this as the ultimate outcome but we all know this is never clear.


BTC as a leading indicator to financial markets?I woke up this morning and noticed that BTC is down 5%. If we hold at $6900 (or near), will we see financial markets down 5% Monday morning?

BTC is Easter our gift to long?My last update I speculated a really nice leg up 1:1 of the bottom leg. After doing a little more TA I have concluded the center was a triangle. I'm interested anywhere between 6200 and 6300 hundred. Don't get overly paranoid about the to the .01 cent entry. This is the trade I have been waiting for. Patience.

BTCUSD: The road map shows DOWN, DOWN, DOWN ... for now This is why i am BEARISH:
* BTC is trending in the blue descending channel
from July 2019 (Bearish)
* Currently it finds in a rising wedge (brown) -
(Bearish).
* It encounters the top of the descending channel
which probably would push it down.
* A huge falling wedge (black) is busy forming
to support my Bearish bias
* We still have a gap to close at $3570

price estimation based on two past behavior, the price may go down to 5 thousand or raise to 8 thousand area.

BTC Bullish as F*ck after pullback. Speculation 6300 back to 9500 with an equal 1rst leg added to the top. It's all corrective, but the profits are the same .Take it and go.


BTC résistance à 7500 - 7800 ??Salut à tous,
Le BTC continue sa croissance, la tendance reste haussière mais une résistance importante se situe entre 7500 et 7800.
La situation reste délicate au vue de la crise économique, je préconise une short à la zone dessinée.
Je garde une stratégie sur le BUY/LONG, je pense qu'une baisse du BTC va se manifester le mois prochain.
Bon trade

The last low before Bitcoin makes its 2.5/3 year target of $250kLast capitulation point before we correct and move to the upside. I have Pitchforks and Fib Circles on the chart. Understand that this is all speculative and not for certain but from what I am learning as I move forward with this market this is my opinion and future target. Tim Draper continues to be positive on this $250k target.


BTC ABOUT TO START ITS NEXT LEG UP 9:00am TARGETS 7.2k 7.4kNice little long for a short day trade or medium hold to see where top goes!!!
1:1 WXY correction complete. Next wave 3 extension to 5k or 4k?1:1 WXY correction complete with a clear 5 wave count for wave Y and gradual declining volume as bitcoin rises.
4 hour bearish divergence now on the 4H OBV.
If this count plays out, we should be starting wave 3 of 5. If wave 3 is a 1.618 extension of wave 1, I'm expecting this wave to complete somewhere around 5150. A 2.618 extension will see an extension to the 4k region.
Good luck and happy trading!


