Bitcoin to $15,000 or $8,800 ?? What's your Next Target ??My next target is 15k but I would love if the correction be around 8k because I'm gonna buy til I can't no more!!!
BTCUSDC.P trade ideas

Bearish Charts still Intact (Chart 1 of 3 case scenario)To be completely honest, in my opinion I see 3 possible scenarios playing out with 2 being bearish and the 3rd bullish. I'll release a chart for each possibility today with this being the 1st.
This chart needs little to no explanation if you've been following my previous published charts. I believe that those charts are still in play down to the 8.5k-ish territory. We've failed to breakout with each new impulse up and succeeded only in making lower highs each time.
I've been told that my wave analysis is wrong because wave 4 entered into wave 1 price action but you also have to remember wave 4 does not overlap with the price territory of wave 1, EXCEPT in the rare case of a diagonal triangle formation.
I welcome any and all feedback as I'm still pretty new at this and have only been teaching myself for about a year now. Thank you ladies and gents for not being judgemental.

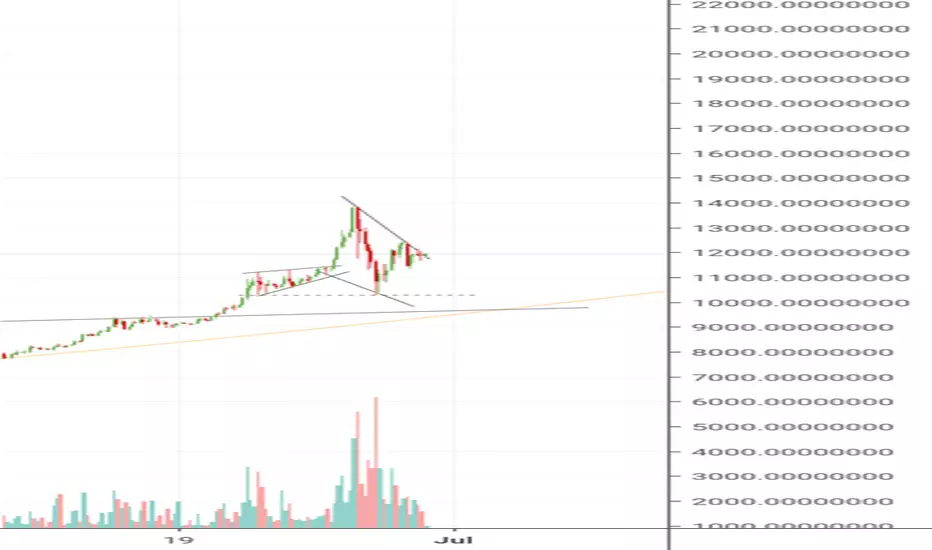
Bitcoin falling (wedge) part 2It keeps defining boundaries, it is also approaching parabola. Not a good time to trade. I am still betting big on usd.

How I see charging for next ''to the moon"At the moment main support line at 10800, if we will break them, we will go to 10k. From there we should go to 12200-correction-13800-correction-16000
I want to believe....

Bitcoin get in touch with its parabolaParabolic advance likely to resume. You better stay around the corner. New highs for confirmation


4th Wave As you can see from both my 2 published charts I believe we will be seeing a sub 9k BTC in the near future some time between July 5th and July 7th. There is a futures gap to fill down at around 8.4k-8.6k and I'm pretty sure we'll fill it. Good entry points for a long imo would be around 8.7k-8.9k depending upon leverage amount. we should break 14k and reach 16.2k before retracing a little and then pushing up to 17k and getting rejected.


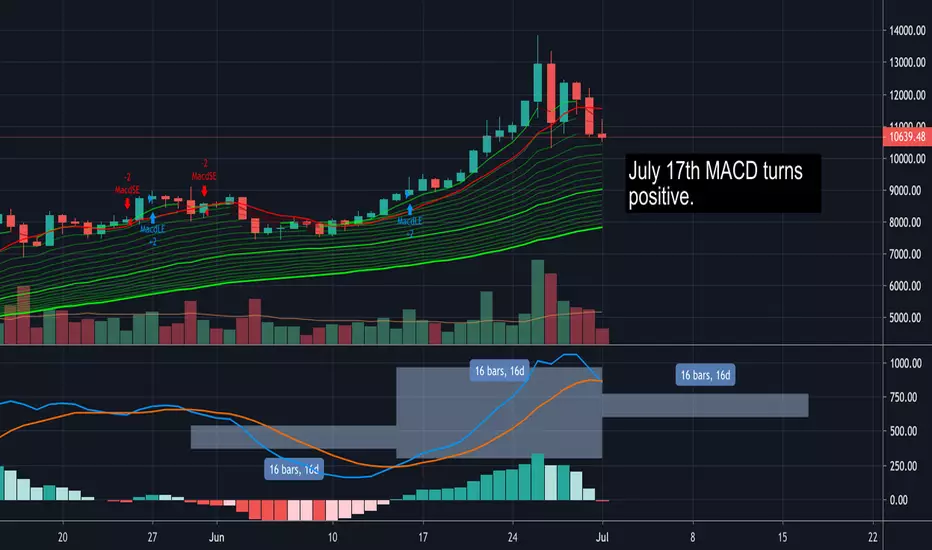
BTC 16 Day MACD Swings - Show Downtrend until July 17th?Just a thought... but maybe this will pan out.
Bitcoin falling (wedge)Bitcoin going down next week or braking out from the wedge. Actually don't care, I'm full cash now. Only If we make a new high, over 14k, I will enter again.

Pop or drop for BTCDecision time once again for BTC as it reaches the apex on the 1HR. Continuation to blast through resistance at $11800 or drop to fill one of the CME gaps ?

to 10k $10700 ishtarget to 10k/$10700 Near the 30th of june into july or before if it break's my trend lines upwards near the 15th 17th my guess would be more approaching the end of june into july

Bitcoin Buy DipsRecommendation:
Buy at / above: 9202.1 Targets: 9221.49 --- 9245.51 --- 9269.56 --- 9293.64
Stoploss : 9178.14
Sell at / below: 9178.14 Targets: 9158.78 --- 9134.87 --- 9110.98 --- 9087.13
Stoploss : 9202.1

NEED ADVICE - PLEASE HELP - WHY IS THIS WRONGI am very new to Elliot Wave analysis. I simply do not know enough to know why my labeling is wrong. Particularly the ABC corrective wave that I used a WXYXZ pattern. I would love for some comment from someone who knows something more than me.

its only a h&s when no one else calls for it Recall earlier this year when BTC formed a textbook h&s - everyone on TV was expecting it and drawing it out, but then it proceeded to breakout upwards instead and pump like crazy. This time, no one is calling for it, so I'll bet it crashes.

BTC Buy Orders for 7200 fill June 13-14 followed by LAMBOThis is based on the MACD on the daily.
Not financial advice, I am a retard.

BTC strugging with resistanceBitcoin struggling to turn resistance into support once again after Thursdays drop on the 4 Hr chart.
What will this bring for the coming week . . .


savage rejectionafter a great run up we have seen our first savage rejection for a long time.
IMO this could mean we have topped out for now, there may be a pull back from the whales

