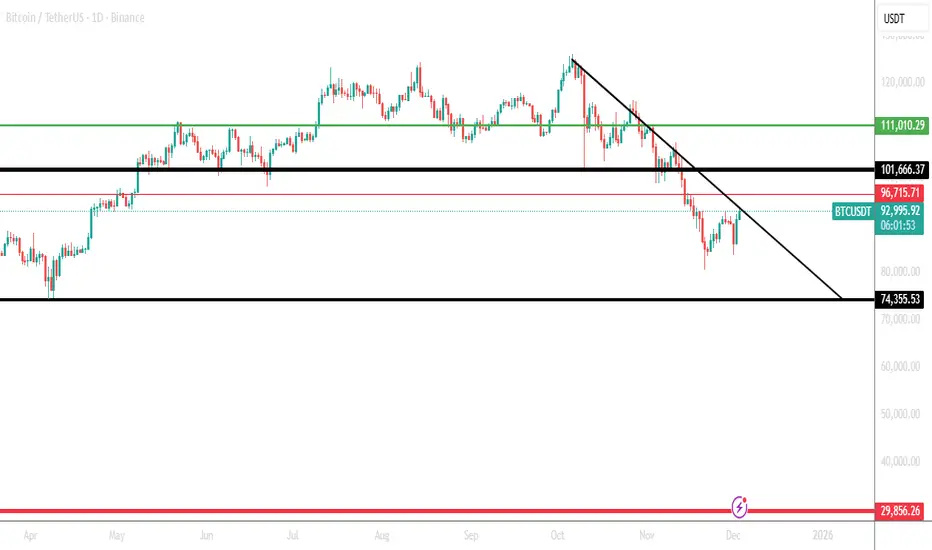
Bitcoin needs to break above the 101–103k zone.Bitcoin needs to break above the 101–103k zone.
If it manages to do that, the next target would be around 111k.
If it does not reach that level and does not break the downward trendline, then the next important level is 73k.
This area is likely to be strongly defended by investors to prevent the price from reaching it or falling below it.
If the price drops below that zone, then the bottom for the next cycle would be around 30k.
This is purely a technical analysis view.
If I personally wanted to invest, I would focus on prices that include the digit “5” in Bitcoin’s price.
I would be looking to enter at:
105k
135k in case of further upside
75k
35k in case of deeper downside
These levels are not guesses and not the result of a simple mathematical formula.
They come from a technical view of Bitcoin.
After Bitcoin broke below the 50-week moving average the week before last, the price quickly dropped by about 20%.
Right now, Bitcoin is breaking the 200-period moving average consecutively on the 3-hour timeframe. This is a positive sign, and it is also forming a low followed by a higher low. Along with the volume, this is creating a positive divergence.
But my final assessment to the question:
“Has the bearish wave really reversed now?”
My answer is: 0 out of 3.
That is my honest answer, not based on emotion or trying to please anyone.
In the end, and always: this is not investment advice.
Note: I am only translating and polishing your own analysis here, not adding any investment recommendation from my side.
Trade ideas
BTC target is $100KBTC is technically forming a double bottom on the daily timeframe (a trend-reversal pattern). The target sits around 100K. With the upcoming Fed meeting and a potential rate cut, we could break out toward 105K, and I wouldn’t rule out a move to 110K — a test of the 50/200-day MAs — as the market shifts into short-trend expectations.

The possibility of btc fallingBTC is testing the upper boundary of an ascending channel near $93,600–$93,700.
Price action shows a potential double-top or rising wedge pattern—often bearish.
Volume is declining, suggesting weakening bullish momentum at resistance.
A brief pump toward $94,000 is possible, but a rejection could trigger a drop to $92,500 or even $91,000.
Break above $94,000 would invalidate the bearish setup and signal further upside

BTCUSD: Onchain data: Good Buy?A. Onchain current landscape:
- MVRV Ratio: Dropped from 1.83 to 1.64
- Well below the 2.0 "heated market" threshold
- Far from the 3.5 "overheated" danger zone
Interpretation: Market is NOT overextended; substantial upside room remains
- Net Unrealized Profit/Loss (NUPL): Declined from 0.45 to 0.39
Entered "Anxiety" zone, trending toward "Fear". Historically, NUPL below 0.40 marks excellent accumulation zones
Signal: Weak hands being shaken out, strong hands accumulating
B. Exchange Flow Dynamics: Smart Money is Accumulating
Critical Pattern Observed:
- Nov 11: -2,579 BTC (outflow - accumulation)
- Nov 12: -659 BTC (outflow - accumulation)
- Nov 13-14: +777 BTC, +5992 BTC (large inflows during panic selling)
- Nov 15-16: Mixed flows, continued selling pressure
- Nov 17: -4,036 BTC massive outflow
Analysis: The -4,036 BTC outflow on Nov 17, as price stabilized around $92k, is the first reversal signal. Smart money accumulated aggressively at depressed prices while retail capitulated.
C. SOPR Analysis: Capitulation in Progress
Spent Output Profit Ratio (SOPR) Timeline:
- Nov 11-12: Above 1.0 (healthy profit-taking)
- Nov 13-17: Below 1.0 (0.989-0.994)
Critical Insight: When SOPR falls below 1.0, it means investors are selling at a loss, a classic capitulation signal. This typically marks local bottoms and excellent entry points for patient buyers.
It means, we need to be patient and accumulate on key supporting levels.
D. Supply Dynamics: Weak Hands Exiting
Supply in Profit: Dropped from 73.6% to 64.5%
35.5% of BTC supply is now underwater (up from 26.4%)
This reset creates a stronger foundation for the next leg up
Investors who bought near the top are capitulating, clearing sell pressure
Whale Accumulation: Follow the Smart Money
BTC whales added ~30,000 BTC during the dip
Value: ~$3 bln in fresh whale accumulation
E. Technical levels:
- Strong supporting zone: 85000-88000.
- Confluence with descending channel's lower bound.
F. The Edge:
While headlines scream "crypto winter" and retail capitulates in fear, seasoned investors recognize this as a gift, a chance to accumulate a scarce, institutional-grade asset at a 26-30% discount from all-time highs, with clear onchain evidence of smart money accumulation.
Analysis by: Dat Tong, Senior Financial Markets Strategist at Exness

Weekly crypto review: BTC macro + short-term bearish lookBitcoin Bitcoin is closing its second consecutive week below the 50-week moving average. Throughout this growth cycle (since the 2022 lows), price has always found support at these levels.
Chart:
Historically, closing below this level for more than two weeks in a row has almost always marked the start of a macro-correction cycle or ‘crypto winter,’ rather than just a standard drawdown.
Chart:
On RSI:
The Weekly RSI, which maintained an uptrend throughout 2024 and almost all of 2025, decisively broke its long-term support line in November. As long as RSI remains above the support line, the bullish cycle structure usually holds; however, a downward breakdown often coincides with the completion of a growth phase.
Chart:
The combination of these two signals—dropping below the 50-week average and the RSI support breakdown—sharply increases the probability that the market has already entered a macro-correction phase. In my view, the probability of this scenario is currently over 80%.
On 200W MA
In all past cycles, the final Bitcoin bottom formed specifically around the 200W MA. Currently, this sits near 66k, and by mid-2026, it could rise to the 73–75k range, fitting a scenario of a further 15–20% decline from current levels.
Chart:
Expectations for the week:
I see potential for another correction wave as long as price remains below 93k. In the coming days/week, it is logical to expect a bounce (already in progress) toward this resistance zone; however, without sustained consolidation above it, the risks of another drop toward 75–70k remain high.
Chart:
If the market does test the 75–70k zone, a local bottom may form there, triggering a powerful bearish rally toward the falling 200-day average. This is the ‘dead cat bounce’ scenario with potential upside of around +40%, typically used to regroup positions in the middle of a bearish phase

BTC — [2D] WEEK 49 TREND REPORT | 12/05/2025BTC — WEEK 49 TREND REPORT | 12/05/2025
Ticker: BINANCE:BTCUSDT
Timeframe: 2D
This is a reactive structural classification of BTC based on the weekly chart as of this timestamp. Price conditions are evaluated as they stand — nothing here is predictive or forward-assumptive.
⸻
1) Current Trend Condition [ Numbers to Watch ]
Current Price @ 89,200
• Trend Duration @ +98 Days ( Bullish )
• Trend Reversal Level ( Bullish ) @ 103,400
• Trend Reversal Level ( Bullishh Confirmation ) @ 103,400
• Pullback Support @ 100,002
• Correction Support @ 79,436
⸻
2) Structure Health
• Retracement Phase:
Correction (approaching 61.8%)
• Position Status:
Unstable (price below both structural layers)
⸻
3) Temperature :
Cooling Phase
⸻
4) Momentum :
Bearish
⸻
Author’s Note
DOWNWARD STRUCTURAL ALIGNMENT
This mark identifies a moment where the market showed clearer alignment with downside direction. It does not predict future movement, but acknowledges where weakness became more evident within the prevailing structure. Its relevance remains only while price continues to hold beneath key structural boundaries.
⸻
Methodology Overview
This classification framework evaluates directional conditions using internal trend-interpretation logic that references price behavior relative to its structural layers. These relationships are used to identify when price movement aligns with the framework’s criteria for directional phases, transition points, or regime shifts. Visual elements or structural labels reflect these internal interpretations, rather than explicit trading signals or preset indicator crossovers. This framework is observational only and does not imply future outcomes.

05/12/2025 - BTC hail mary
I believe BTC could go up with the help of the new release, but that is just what I think.

BTC on MonthlyDear Traders
i see btc may visit for now 67k then go back up max target 150k
lets see if this can play

BitcoinBitcoin at 150k remains in play. The inverse head and shoulders structure is still valid and price continues to respect the neckline. As long as structure holds, upside continuation remains the higher probability outcome.

Bitcoin: Final Pump Before the Fall?Over the past five to six days, Bitcoin ( BINANCE:BTCUSDT ) has been attempting to recover from previous weekly declines, and it still appears to be in a corrective phase. This analysis builds on my previous idea, and if you’d like a deeper look at Bitcoin’s mid-term chart, you can check out the 4-hour timeframe in that previous analysis .
Now, a key point for Bitcoin traders is that, despite the recent rally in the S&P 500 ( SP:SPX ) over the past few days, Bitcoin hasn’t been able to keep pace. While it had a good correlation with the S&P 500 in the past, it didn’t experience a similar upward movement this time. Therefore, once the S&P 500 corrects, we may also see Bitcoin resume its downward trend.
Currently, Bitcoin seems to be near a resistance zone($92,200-$88,400) and Cumulative Short Liquidation Leverage($91,570-$89,660). It also appears to be forming an ascending channel over the past few days, indicating a corrective structure.
From an Elliott Wave perspective, Bitcoin seems to be completing microwave C of the microwave Y of the main wave 4, and we can expect this corrective phase to end soon, leading to another downward move. A break of the lower line of the ascending channel would confirm the end of this Wave 4.
I expect that after the Cumulative Short Liquidation Leverage($91,570-$89,660), Bitcoin will resume its decline and move towards the Support zone($86,200-$85,130).
Cumulative Long Liquidation Leverage: $86,000-$85,000
Cumulative Long Liquidation Leverage: $83,249-$81,840
Cumulative Long Liquidation Leverage: $80,263-$78,131
First Target: $86,290
Second Target: $83,800
Stop Loss(SL): $92,229
Points may shift as the market evolves
Note: At lower price levels, Bitcoin’s price includes several Cumulative Short Liquidation Leverages, each potentially causing further price drops. However, if the S&P 500 starts another correction, these levels may break more easily.
Note: Overall, trading in crypto has become a bit challenging lately, with less volatility, so it’s wise to be cautious and manage your capital carefully.
Note: If Bitcoin breaks through the resistance zone($92,200-$88,400) around $92,229, we can expect a renewed upward trend and hope for a bullish movement.
💡 Please respect each other's opinions and express agreement or disagreement politely.
📌Bitcoin Analysis (BTCUSDT), 1-hour time frame.
🛑 Always set a Stop Loss(SL) for every position you open.
✅ This is just my idea; I’d love to see your thoughts too!
🔥 If you find it helpful, please BOOST this post and share it with your friends.

BITCOIN SIGNAL: ONE MORE DUMP BEFORE PUMP??? (warning)Yello Paradisers! Enjoy the video!
And Paradisers! Keep in mind to trade only with a proper professional trading strategy. Wait for confirmations. Play with tactics. This is the only way you can be long-term profitable.
Remember, don’t trade without confirmations. Wait for them before creating a trade. Be disciplined, patient, and emotionally controlled. Only trade the highest probability setups with the greatest risk to reward ratio. This will ensure that you become a long-term profitable professional trader.
Don't be a gambler. Don't try to get rich quick. Make sure that your trading is professionally based on proper strategies and trade tactics.

BTC/USDT: Bullish Pullback Into Demand ZonePrice is currently pulling back after a strong upward move and is approaching a key intraday demand zone (highlighted in orange). This zone has previously acted as a support base for continuation moves and aligns with the current short-term structure of higher lows.
The circled area represents a potential liquidity sweep / reaction point, where price may wick into the zone before buyers step in. If bullish momentum returns from this level, a continuation toward the marked target area above is likely.
Key Points:
🔸 Trend: Short-term bullish structure still intact.
🔸 Demand Zone: Watching for reaction inside the highlighted support area.
🔸 Bullish Signal: A clean bounce or strong bullish candle from this zone.
🔸 Target: Next upside zone around the 94k–95k range (as indicated on chart).
🔸 Invalidation: Break and close below the lower demand zone would weaken this bullish scenario.
This setup suggests a potential buy-the-dip continuation if support holds and momentum returns.

Memecoin Gains (Loss) showing a potential $BTC turnaround soon. The MCG (Meme Coin Gains) indicator has triggered a low risk time for $BTCUSDT. This indicator has been quite good for detecting swing bottoms on bitcoin.

BTCUSDT.P - December 3, 2025Bitcoin is attempting to reverse from a prior downtrend, trading above a short-term rising trendline and pushing into a key resistance band around 93,000–94,300. The chart highlights a bullish scenario targeting the 112,000 area if price can clear this resistance and hold above the stop zone near 97,800. A failure to break and sustain above resistance, coupled with a break below the trendline, would favor a corrective move back toward the 87,300 profit level marked on the chart. Momentum is improving but remains vulnerable around resistance, making this a pivotal area for trend confirmation.


BITCOIN SIGNAL: SELL EVERYTHING NOW!!!!!!!? (big)Yello Paradisers! Enjoy the video!
And Paradisers! Keep in mind to trade only with a proper professional trading strategy. Wait for confirmations. Play with tactics. This is the only way you can be long-term profitable.
Remember, don’t trade without confirmations. Wait for them before creating a trade. Be disciplined, patient, and emotionally controlled. Only trade the highest probability setups with the greatest risk to reward ratio. This will ensure that you become a long-term profitable professional trader.
Don't be a gambler. Don't try to get rich quick. Make sure that your trading is professionally based on proper strategies and trade tactics.

BITCOIN → Retest of the 94,000 zone of interest...BINANCE:BTCUSDT.P is rebounding from its interim low of 80,000. However, it is still too early to talk about a bull market, as a countertrend correction is forming under the current circumstances.
Globally, Bitcoin is in a downtrend, with the zone of interest for a countertrend correction being 94,000-95,000. The market structure is bearish, and a retest of the break-even zone could trigger a downward movement within the trend.
After a strong liquidation to 80K, the market is forming a pullback, which is a basic phenomenon. There is no confirmation of a trend reversal yet, and the fundamental background is neutral, without clear support. Various analytical services suggest that the market is in a cleansing phase and has so far only liquidated short-term traders, reaching a cumulative average break-even price. A classic pullback. Technically, the zone of interest or magnet for the medium-term market is 75K (on the daily timeframe).
Resistance levels: 93,000, 94,000, 97,300
Support levels: 89,000, 86,000
In the current situation: a bearish trend, weak purchasing power, and a weak fundamental background, I consider a pullback to be the primary reaction to the 93-94K zone. However, the market is not constant, and if support appears (news or other drivers) and Bitcoin manages to stay above 95K, then growth can be expected.
Sincerely, R. Linda!

How to Build a Consistent Execution Checklist on TradingViewMost trading mistakes don’t come from bad strategy, they come from inconsistent execution.
An execution checklist removes guesswork and replaces it with structure.
When your actions follow a routine, your results stabilize.
TradingView gives you everything you need to build a checklist that stays visible, actionable, and tied directly to your chart.
1. Define Your Core Conditions
Before any trade, the bigger picture must be clear.
Start your checklist by answering three questions:
What is the higher-timeframe direction
Where is price relative to key levels
Is price approaching with strength or weakness
Use TradingView’s drawing tools to mark support, resistance, value zones, and session highs and lows.
Add a simple text note on the chart listing your core conditions so they are always visible.
If the market context fails this first screen, the trade is already invalid.
2. Build Confirmation Criteria
Once structure is confirmed, you move to evidence.
Mark confirmation areas directly on your chart:
Liquidity pools
Fair value zones or imbalances
Previous session highs and lows
Asian range or New York open
If your strategy uses indicators, document exact conditions:
Moving average position and slope
Volume behavior
VWAP location
Volatility expansion or contraction
Define rules that don’t change based on emotion.
Confirmation should prove your bias, not justify your urge to trade.
3. Validate Risk Before Execution
Every setup must survive a risk checkpoint before it’s allowed to go live.
Your checklist must answer:
Where is my invalidation level
How much capital am I risking
Does this violate any daily limits
Is the reward worth the risk
Use TradingView’s long or short position tool to visualize risk directly on the chart.
Save it as a template so your risk process stays uniform across all trades.
No trade is valid if risk isn’t clean.
4. Create a Pre-Execution Routine
A checklist only works if you actually follow it.
Add a short pre-trade process directly to your chart notes using checkboxes or bullet points:
Example execution checklist:
Market phase confirmed
Level identified
Confirmation present
Risk valid
Entry condition active
Walk through this list before clicking buy or sell.
If one item fails, the trade fails.
Over time, this routine removes emotional impulse completely.
5. Review and Refine Weekly
Your checklist isn’t static, it evolves.
Every week ask:
Where did I break my rules
What conditions led to losses
Which confirmations work best
What rules saved me from bad trades
Use TradingView’s trade replay and journaling features to review execution quality, not just profit.
Consistency improves when your system evolves with you.
Final Thought
A checklist doesn’t restrict your trading, it frees you from emotion.
When your process is clear, your confidence increases.
When your confidence increases, discipline follows.
Good traders make decisions.
Great traders execute procedures.
Stay Green!
BITCOIN WILL HIT 80K !BTC can hit the seller at 100 - 104k and then crash to 80k again.
its not financial advice !

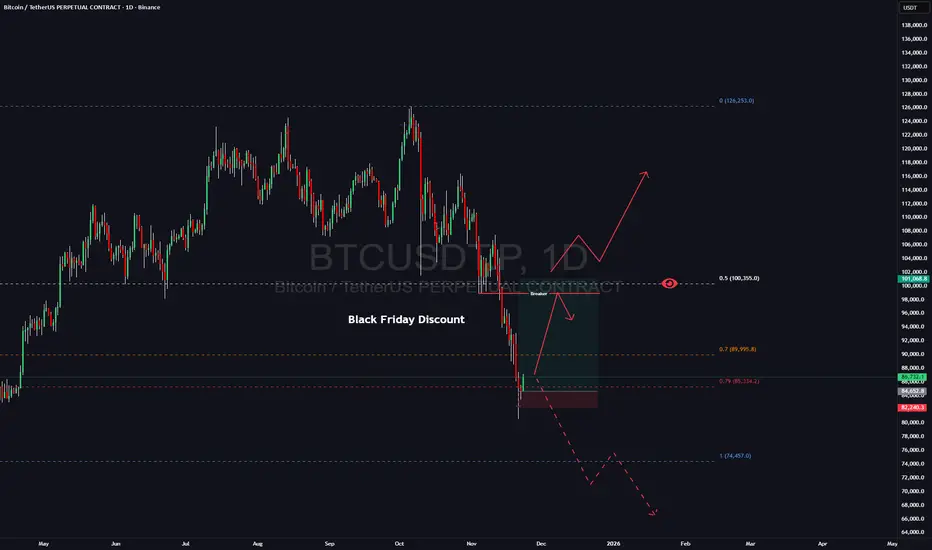
BTC Is Preparing Monster Move: My Bullish Roadmap to New High!A lot of people are already calling for the end of the BTC rally and welcoming a new bear market. Whether that’s true or not — the chart will show. I approach the market with a neutral mindset and let price action speak for itself.Plus dont forget we have Black Friday coming and probably crypto market decided to give you a nice discount)
From my perspective, Bitcoin has simply tapped the weekly discount zone. Historically, BTC often delivers a 20–30% corrective move, which is completely normal within a bullish cycle. And with Black Friday approaching, it seems the crypto market decided to offer its own “discount.”
I’ve taken a long position from this area, with my first target set at 94–96K, where I plan to secure the majority of my profits.
My stop is positioned around 82K — if the market goes against me, I’m fully comfortable with the risk.
I’ve also added some spot positions and will share detailed analysis on those in upcoming posts.
Once we reach the 94–96K zone, I’ll reassess the market. Price can shift in either direction from there, which is why that area is my main profit-taking zone while letting the remainder of the position run.
Follow me for further updates and trade breakdowns.
#BTC Rising Wedge📊#BTC Rising Wedge📉
🧠From a structural perspective, the daily chart correction is not yet over. Currently, it's within the blue resistance zone, so we still need to maintain a cautious approach.
➡️From a chart perspective, a rising wedge has gradually formed within the blue resistance zone. We generally use this model for corrections.
⚠️If we break through the blue resistance zone, it will turn into a support zone. Only then, with a suitable pullback, can we look for long trading opportunities.
🤜If you like my analysis, please like 💖 and share 💬
BITGET:BTCUSDT.P

BTC Reclaims Key Trendline Expecting Bullish WeekendBTC: One More Push to 94K Before Potential Reversal? 📊
USDT.D Elliott Wave Analysis:
Currently tracking Wave B of an ABC corrective pattern on USDT Dominance. This suggests we're in a counter-trend bounce before the final Wave C decline, which historically correlates with one more leg up in BTC.
BTC Technical Setup:
Successfully retested the descending trendline (visible on 4H)
Breaking out of the converging triangle pattern
Target: ~94,000 zone
Timeline: Expecting the move to complete by Sunday night/Monday
Key Observations:
USDT.D showing signs of exhaustion in its corrective bounce
BTC maintaining structure above support
Trendline retest providing confluence for the next impulse move
Trade Considerations:
Watch for momentum slowdown approaching 94K
Monitor USDT.D for Wave C initiation signals
Potential distribution zone forming into Monday session
Risk Management:
This could be the final push before a deeper correction. Consider:
Taking partial profits near target
Trailing stops on remaining positions
Reducing exposure ahead of the weekend/Monday transition

Will Bitcoin Price Under $95,000 Benefit From $2 Billion BuyingBitcoin is trading at $92,047, holding above the critical $91,521 support level while remaining trapped under the month-long downtrend. Recovering from this position requires a decisive breakout, which has yet to materialize despite recent attempts.
Invalidating the downtrend demands a flip of $95,000 into support. Given the ongoing accumulation and tightening exchange supply, such a move remains possible. Additional support from institutional buyers would further strengthen Bitcoin’s path toward $100,000, restoring bullish momentum.
If large holders remain sidelined, Bitcoin may continue to struggle. A failure to sustain support could send BTC back below $89,800 and toward $86,822. This would reinforcing bearish sentiment and delaying recovery attempts.
