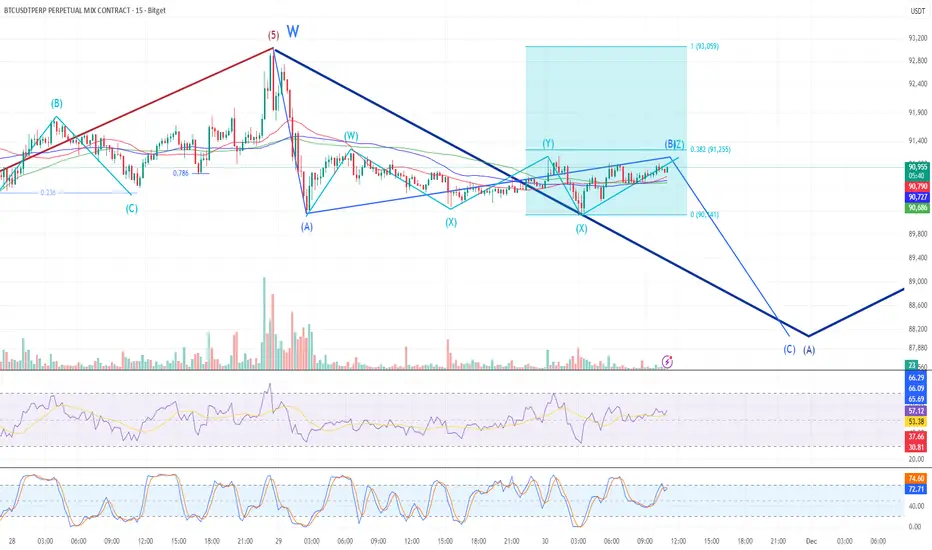
Bitcoin 15-Min Chart – Lower Timeframe Structure of Higher TimefThe higher timeframe ABC correction is being interpreted as a W-X-Y structure on the 15-minute chart, based on internal wave complexity.
Currently in the A wave of the internal ABC within the X leg
Within that A wave, a smaller ABC is unfolding, with the A-B portion nearing completion
Overall structure suggests a complex correction (W-X-Y-X-Z) in progress
At the moment, moving averages are tightly clustered, forming a combined support zone.
➡️ A clean break below this support cluster would strengthen the case for a Wave C move.
Trade ideas
BTCUSDT.PA safe and sound plan has been marked on the chart on 1 day TF.
It might take long time but as soon it will drop to our zone and we see some bullish momentum we are in definitely.
Trading is only patience we cannot just move with moving line.
We need the price to act as we need and once the price starts acting as we decided than it will go where we want to see.
Have a good trading.
Trade once or twice a month is better than trading whole day 24/7.
Make it a peace of mind not stress.
Follow for more.


A safe long setup for cautious peopleThe previous analysis was with a longer-term perspective. In this analysis, a completely safe setup is presented for cautious people. The stop of this setup is placed at the point 87550. If this point is crossed, the short-term upward trend is ruled out.

TradeCityPro | Bitcoin Daily Analysis #235👋 Welcome to TradeCity Pro!
Let’s move on to the Bitcoin analysis. Today is Saturday, it’s the weekend, and market volume and volatility have dropped significantly.
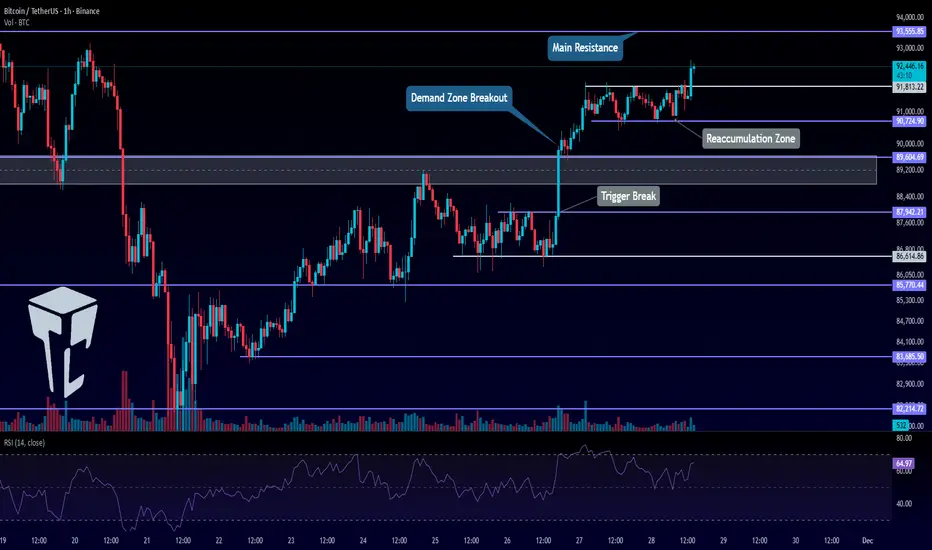
⏳ 1-Hour Timeframe
The long trigger we had yesterday on Bitcoin was broken, but the market didn’t continue upward, instead, it turned into a fake breakout.
⚖️ The main resistance on Bitcoin remains 93,555, and the price didn’t reach this level. Sellers entered the market earlier than expected and took control before price could reach the resistance.
💫 After this fakeout and with the weekend arriving, trading volume has decreased sharply, the difference in volume before and after the fakeout is very noticeable.
🔭 This low volume has caused the price to slowly drift downward with a very weak slope, and it’s currently fluctuating around the 90,724 zone.
📊 Additionally, because volume is so low, the price is not reacting cleanly to levels and is not respecting them, which is normal when market depth decreases.
✅ At the moment, I don’t think the market is in a good condition to open new positions.
💡 The main resistance zone on Bitcoin is still 93,555, and breaking this level will turn the trend bullish.
✨ As long as the price is above 89,000, I do not consider the trend bearish, but this does not mean the market is bullish either.
🎲 Right now, Bitcoin has no clear trend, and for a new trend to form, we must wait for a confirmed breakout either above 93,555 or below 89,000.
❌ Disclaimer ❌
Trading futures is highly risky and dangerous. If you're not an expert, these triggers may not be suitable for you. You should first learn risk and capital management. You can also use the educational content from this channel.
Finally, these triggers reflect my personal opinions on price action, and the market may move completely against this analysis. So, do your own research before opening any position.

BTCUSDT - What's Next? Bullish is over???BTC Daily & 4H Outlook
Bitcoin is showing mixed signals across the 1D and 4H timeframes. On the daily chart, BTC failed to hold the strong support zone and has now officially flipped it into a resistance. The drop also swept liquidity down to the 80.600 area before rebounding from the daily OB, which gives us a temporary relief bounce. Right now, price is pushing upward and may retest the resistance/supply zone above.
If BTC rejects strongly from that resistance, the market could be in trouble again because the downside target reopens toward the 83k–86k region. This area becomes even more important when we look at the 4H chart, where we still have a key support between 85.650–85.000. This zone must hold—if it breaks, then 83k becomes likely, and a worst-case scenario returns us to the 80k sweep zone.
For BTC to reclaim momentum and shift into a bullish structure, the market needs to break out above the major supply at 93.240. A clean breakout and confirmation would show strength and could trigger the next leg toward 98k–100k. If that happens, we may also see a strong positive impact on altcoins.

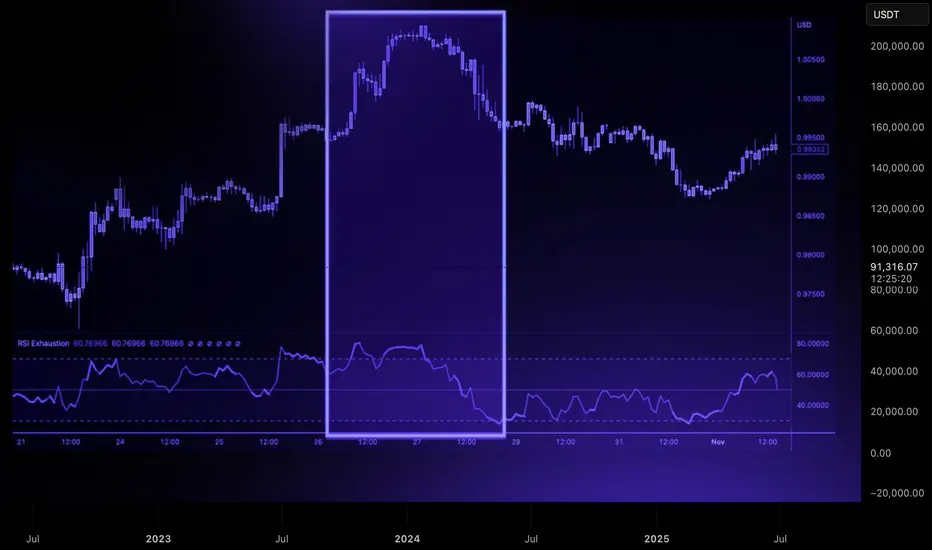
Trend Exhaustion: How to Spot a Reversal Before It HappensReversals rarely start with dramatic candles. They begin quietly, through subtle shifts in momentum and structure that most traders overlook.
A strong trend doesn’t collapse all at once. It loses strength in stages, and those stages are visible long before price turns in the opposite direction.
The first sign of exhaustion is weakening impulse strength. In a healthy trend, impulsive moves are clean and decisive, and retracements are controlled. When each new push produces smaller higher highs or lower lows, it signals reduced participation.
Buyers or sellers are still present, but the force driving the trend is fading.
The second clue lies in how price interacts with liquidity. Strong trends break key levels with conviction. Exhausted trends start reaching above highs or below lows only to reject immediately.
These sweeps show that the market is clearing liquidity without gaining follow-through, often trapping late entries and signaling that larger players are offloading positions.
A third indication appears when structure begins to fracture. An uptrend losing its higher-low sequence or a downtrend failing to maintain lower highs is a shift in narrative. A single break is not confirmation, but when it aligns with slowing impulses and liquidity failures, momentum is clearly changing.
Volatility then begins to compress. Candle ranges shrink, movement becomes less directional, and price enters a tightening pattern.
This compression often precedes expansion in the opposite direction. When a decisive candle breaks out of this cluster, the reversal typically accelerates.
Trend exhaustion is about recognizing when the conditions that supported continuation no longer exist.
By reading momentum, liquidity, and structure together, you can anticipate shifts earlier, manage risk more effectively, and position yourself on the right side of the next move.
BTCUSDT.P - November 29, 2025Bitcoin is trading in a sideways range after a sharp rejection from the 92,900 resistance area, with intraday structure showing lower highs capping price under the 91,200–91,300 band.
A key support shelf sits around 90,200–90,400; holding above this zone could fuel a range breakout back toward 92,900, while a decisive close below it would confirm a bearish rotation and expose the lower support region near 89,000.

BTC SHORT TO 90K THEN BOUNCE TO 91,500Looking for a small move to the down side and then a bounce up to $91,500.
Liquidating both Long and Short positions.

BTC/USDT: Potential Uptrend and Buying OpportunityBitcoin is creating a buying opportunity as it continues to follow a clear uptrend channel. With support from macroeconomic factors and positive momentum from the cryptocurrency market, BTC/USDT has the potential to move upward strongly.
The chart shows that BTC is currently moving within an uptrend channel, supported by the EMA lines. The recovery from the recent bottom around 86,700 USD and the price moving closer to 91,000 USD indicates that the market is starting to regain upward momentum.
Looking at the current price levels, BTC is approaching an important resistance level at 95,500 USD. If this level is broken, the uptrend could extend, pushing the price to higher levels, potentially reaching 100,000 USD. However, if BTC fails to break through the 95,600 USD level and pulls back to test the 86,700 USD support, this would provide a good buying opportunity before continuing the uptrend.
In summary , BTC/USDT is currently on a strong uptrend, and the buying opportunity remains as the price adjusts back to key support levels. Watch the 86,700 USD level as an ideal entry point to take advantage of the upcoming strong rally.

TradeCityPro | Bitcoin Daily Analysis #234👋 Welcome to TradeCityPro!
Let’s move on to the Bitcoin analysis. The market is continuing the upward movement it started earlier.
⏳ 1-Hour Timeframe
Yesterday, after breaking the resistance zone, Bitcoin entered a small ranging box, and now the price has managed to stabilize above this box.
🔔 This range allowed the price to rest, and with new momentum entering the market, Bitcoin is now ready to move toward the 93,555 level.
💥 The RSI oscillator has formed a new momentum low around the 50 level.
✔️ This shows increased bullish momentum compared to the previous leg, because in the previous leg, RSI’s support was at 21.
✨ If this new RSI low holds, the market’s momentum will remain bullish, allowing the price to continue its upward movement.
📊 The triggers we previously had 87,942, 89,000, and 91,813 all activated and are currently in profit.
The next trigger for Bitcoin is at 93,555.
⭐ When the price reaches 93,555, there is a high probability that the market will begin ranging again or enter a correction.
⚡️ So if I see signs of exhaustion or reversal at that level, I will manage risk and take profits on my positions.
❌ Disclaimer ❌
Trading futures is highly risky and dangerous. If you're not an expert, these triggers may not be suitable for you. You should first learn risk and capital management. You can also use the educational content from this channel.
Finally, these triggers reflect my personal opinions on price action, and the market may move completely against this analysis. So, do your own research before opening any position.
THE TREND IS YOUR FRIEND As much as we can see buying activity erupting, we should be aware that the BULL run is over and allow the trend line guide us to the best entries where the bears are waiting

Watch Out! $BTC Trap Ahead!CRYPTOCAP:BTC 1H & 30 mint trend is still bullish, but on lower TF it has shifted to bearish. Be careful don’t get trapped by a small weekend pump.
Wait for my next update

btcusdtBitcoin (BTC) Daily Technical Analysis
Current Market Context:
Price action suggests a bearish intraday bias within the broader context. The setup indicates a potential for a short-term decline towards lower support levels.
Trade Setup Overview:
Direction: Short (Bearish)
Strategy: Fade on strength towards resistance / anticipate breakdown.
Execution Parameters:
Entry Point: $91,630
Rationale: This level is anticipated to act as a point of rejection following a retest of a breakdown level or a minor resistance zone.
Stop-Loss: $92,065
Rationale: Placed just above the recent swing high or a key resistance level. A break above this invalidates the bearish premise and suggests a potential move higher.
Take-Profit Target: $90,365
Rationale: This target aligns with a significant support level where profit-taking or a bullish reversal might occur.
Risk Management:
Risk/Reward Ratio: ~1:4.9
This is an excellent risk-to-reward ratio, where the potential profit significantly outweighs the potential loss.
Position Sizing: Ensure the position size is calibrated so that a loss from this trade remains within your predefined risk tolerance (e.g., 1-2% of total capital).
Technical Justification & Chart Analysis:
This setup implies that Bitcoin is facing selling pressure near the $91,630 - $92,065 zone. A rejection from this area, confirmed by bearish price action (e.g., a bearish engulfing pattern, pin bar, or loss of momentum), could trigger a sell-off towards the $90,365 support level.
The trade's validity relies on the market structure remaining bearish on the lower timeframes (e.g., 4-hour or 1-hour charts). The tight stop-loss requires precise execution.
Conclusion:
This is a high-probability, high-R/R short-term bearish setup. The key to success lies in waiting for confirmation at the entry zone rather than entering blindly. Monitor lower timeframes for bearish confirmation signals before executing the trade.
Disclaimer: This analysis is for educational purposes only and does not constitute financial advice. Trading cryptocurrencies carries significant risk.

BTCUSD SELL CONTINUATION TO 80K.....Still very bearish on btc am only changing bias to once price breaks 93,500 for below this zone is a sell entry for me but if price breaks above 93,500 am positioning for buys to 100k for another sell off for still sell....

Brainiak | Bitcoin begin the Impulsive move?Following the analysis made on December 10, Bitcoin was expected to have a continuation to the upside, with a key support zone around 89,000. The analysis was as follows:
“The price level that offers the highest probability for a bullish continuation is a pullback that does not go below 89,000. The key observation is that the decline must not occur with strong momentum in a V-shaped manner. Instead, the price should retrace slowly and gradually, which would indicate a high probability that this zone can hold as support.
The next level is around 86,000, which is still acceptable, but the market would likely start forming a sideways structure, increasing the chance that price may dip first before moving higher.
The final and least likely scenario is around 84,000. If price tests this area and fails to hold, followed by a breakdown, the market would likely need to move lower before any meaningful recovery.”
Price has since retraced and tested the 89,000 level as expected, followed by a strong and impulsive reaction to the upside. This price behavior significantly increases the probability that the previous corrective structure has indeed completed.
The next key level to monitor is 94,000. If price can successfully break and hold above this level, Bitcoin would have room to continue higher, with the next upside target around 97,000. However, as long as price fails to break 94,000, a pullback remains possible at any time in the short term.

BTC INTO FEB/APR '26 then 4Q recessionBTC trajetcory given wrt the elliot wave structure, ideally chopsolidation at 74k can bring about higher targets but this is my base case wherein we can dip to 65-67k then rebound. Else if we are forming an A to B now then 58k would be the mark for the final dip. Wherever we dip now will tell us how 4Q '26 will look like. Ciao

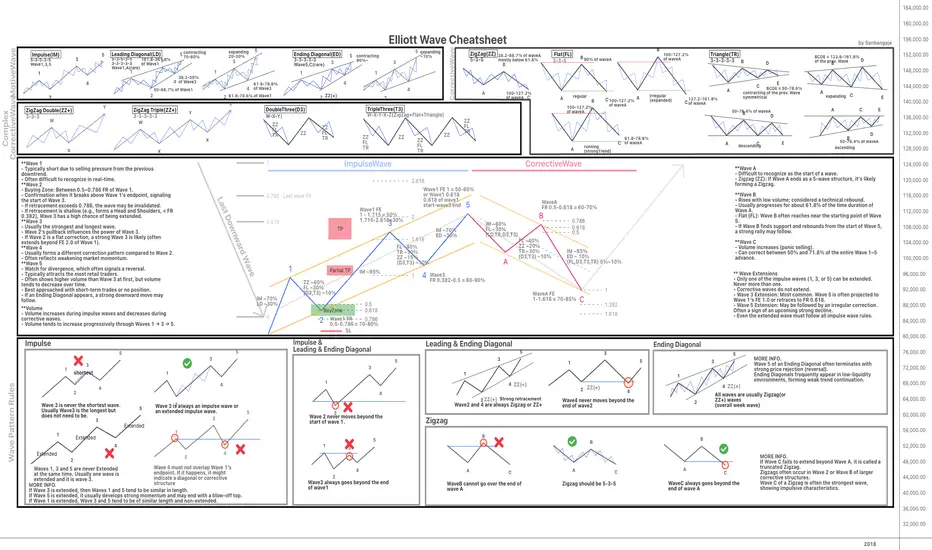
Elliott Wave Rules: Quick Cheatsheet for TradersHello everyone! I'm happy to share this Elliott Wave Cheat Sheet that I personally created during my journey. I hope this guide is helpful to the community.
This chart is designed to provide a quick, at-a-glance overview of the core Elliott Wave principles and patterns. Please note, it is just a summary of the main theories.
To dig into further and truly master the concepts, I highly recommend consulting the foundational texts:
* Elliott Wave Principle: Key to Market Behavior by A.J. Frost and Robert Prechter
* Mastering Elliott Wave by Glenn Neely
** Best viewed with QHD resolution (2560x1440)
** If the chart appears slightly squeezed vertically, you can adjust the aspect ratio by dragging the Price Panel (Y-axis) on the right side of the chart.**
**You can download the PNG version of this chart here:
drive.google.com
Happy Trading!
BTC accumulate shorts (WXY done)For the past weeks all BTC did was go down from 126k, from here we can hypothesize that we are on a wave to the downside and all move the upside are all corrective moves for another low to come.
We can see the W wave as an easy 5 subwave with X as 3 subwaves.
From here on there are 2 scenarios.
1. We are on the verge of the making of the huge wave 3 for a reversal of the trend
OR
2. Our Y wave ends with a truncated and we are ready for the next major wave to the downside.
Right now evidence show we are going for option 2. Why?
a.) Going into the orderflow, we have 25million longs TRAPPED on the high
b.) We have made a liquidity hunt on the last week's high.
c.) We tapped on the VAH of the last week of November
d.) All move to the high were made in a matter of minutes (a clear rejection)
The option 2 scenario will give more conviction if we lose
i.) 91,950 - pwVAH
ii.) 91,350 - pmPOC (MAJOR CONVICTION) if we lose this
All these idea will be defeated if we suddenly show strength here at the top
The only thing that I am to expect for my validation is a series of 4H closes above 93,600, it shows acceptance above value of the range
This idea is not made for a trade but as a guide to what to expect for the following days.

BTC: TRENDLINE SUPPORT & The Key to SurvivalBitcoin is currently respecting this ascending trendline on the 4H chart. As long as price holds above this purple line, the local bullish structure remains intact.
However, a breakdown below this level would signal a potential trend reversal.
🛑 REALITY CHECK:
Technical analysis is only 20% of the game. The other 80% is Risk Management. Whether BTC bounces or breaks this line, you will lose money if you don't calculate your position size correctly based on your Stop Loss.
Don't guess your lot size. Calculate it.
📱 I use my personal tool 'TraderHelper' to calculate the exact position size and fees automatically before every trade.
🎁 It's a free Web App. You can find the access link in my TradingView PROFILE or on my Instagram (@traderhelper_ok).
Trade safe!

BTC: Wait Patiently for the UptrendBTC has slipped into another consolidation phase and entered the buy zone. Simply hold your buy orders and wait patiently for the market to rally upward.
All signals have been 100% accurate for two consecutive weeks. I’ll keep delivering precise signals — act fast to get yours now.

$BTC Update (Simple & To The Point)Prev updates still valid. All major timeframes are still bearish.
Right now, price is trading inside 12h and 4h bullish OB, but there is no strong momentum from this zone.
If 89.5k breaks down, next demand area is already marked on chart. Once price enters that zone, we have two bullish confluences:
1- SSL Sweep: Traders who bought because of bullish news have their stoplosses placed in this area around 75% of those SLs are in current zone, and remaining 25% are sitting in lower $$$ sweep zone.
2- Untested Bullish OB: There is also an untested bullish OB in the same zone, marked in green on the chart.
Bullish shift will only happen if CRYPTOCAP:BTC reclaims 94k zone, which is shown as red box on the chart.
Reminder: This analysis is shared against the trend.
Entire crypto market is risky at the moment so trade carefully and don’t FOMO into top buys just because of a small push.
