Bitcoin Price Prediction Trend : Consolidating between $86,000 (support) and $98,000 (resistance)
Key Levels to Watch
Support : $86,000 – Strong demand zone
Resistance : $98,000 – Key supply zone
Possible Scenarios
Breakout Bullish : Above $98,000 → Target $102,000+
Breakdown Bearish : Below $86,000 → Target $82,000 or lower
Most Likely Short-Term Move : Continued sideways movement within the range
Outlook
Short-Term (1–2 Weeks) : Range-bound with potential for breakout
Long-Term (3–6 Months) : Depends on whether price breaks key support/resistance
BTCUSDT.3S trade ideas


BTC (Y25.P2.E1) Have 2 scenariosHi Traders,
I won't use words as the charts do the job if you can read charts.
Scenario #1, price moves up from here
Scenario #2, price sweeps the lows for liquidity. A fractal is aligned with it.
I'm looking to enter the trade big at the lows with Avwap, EMAs and liquidity making a strong case.
Here are short term levels based on our approach.
All the best,
Regards,
S.SAri

BTC Forming Bullish Structure — But Wait for the Higher LowAfter months of lower lows and lower highs, Bitcoin has finally broken structure by pushing above the previous lower high, officially forming a new higher high (HH). This is an early sign of a potential trend reversal back into bullish territory.
However, before momentum continues upward, a healthy retracement could occur. The key level to watch is the support zone around $91,200. If price pulls back and forms a higher low (HL) here or slightly lower around the $88,700–$87,500 zone, it would confirm the bullish structure and potentially kickstart the next leg up.
Patience is key here — let the higher low form before looking for long setups.

Bullish continuation Price retraced to a level on the 4hrs timeframe.
15mins bearish trend is coming to an end, now we continue bullish

BTC SHORTBTC Failed to push through the resistance at 97 to 98k, hence breaking structure downwards. I identified a strong push down and analyzed a breaker block which will be my entry as seen on the graph.
Targetting PWL as well as previous weeks POC.
Goodluck !

BITCOIN BULLISH BTC/USDT Analysis – GigaAlgo SMC | May 5, 2025
Price has recently tapped into a premium OB zone with strong volume rejection. Although JASMINN ML flags bearish sentiment, the structure still supports bullish momentum up to 96K unless the 93K support fails. If that breakdown occurs, the next significant support lies around 83K, aligning with previous volume zones and the STATION marker.
The GigaAlgo Oscillator shows a deep red bar print, hinting at increasing bearish pressure short-term, while multi-timeframe sentiment shows a mix of red and green — signaling indecision and potential range-bound action.

BTC/USDT Quick Update – May 5 (BTC/USDT – Multi-Timeframe Breakd4H Chart – Short-Term Bearish
Price has clearly broken down from a rising wedge pattern with volume confirmation. RSI is trending downward (~36) and Parabolic SAR has flipped bearish. Expect potential continuation to the $91K–92K support zone. If momentum accelerates, gap-fill toward 88K remains in play.
1D Chart – Neutral to Weak Bullish
Daily structure still intact, but momentum is fading. Price is hovering near dynamic support (200 EMA / cloud base), but the lack of bullish volume suggests caution. RSI is flat (~60), and ADX shows weakening trend strength. A decisive breakdown could lead to retest of 88K–90K area.
1W Chart – Macro Bullish but at Resistance
Weekly chart remains structurally bullish, with higher highs/lows and price well above Ichimoku cloud. However, BTC is approaching a major resistance zone between 98K–$104K, where rejection has occurred previously. RSI (~58) shows mild cooling; bulls must step in soon for a clean breakout.
Final Take:
Short-term trend is clearly bearish, and mid-term momentum is weakening. However, long-term structure remains bullish as long as price holds above the 88K zone. Monitor volume closely at support levels—buyers must defend $91K to avoid deeper retracement.
Trade safe. Plan your entries wisely.
Follow for real-time updates and further ideas.

BITCOIN WEEKLY CHARTBitcoin Break of Supply Roof: Implications for Price Action
Bitcoin’s recent breach of a critical supply roof (resistance zone between $95,000–$98,300) has significant implications for its near-term price trajectory.
this range may represent a "supply roof" where holders accumulated Bitcoin. A breakout suggests these holders are either holding for higher prices or have already distributed, reducing immediate selling pressure.
On-Chain and Fundamental Support
Institutional Demand: Corporate treasuries (e.g., MicroStrategy) and ETFs continue accumulating Bitcoin, reducing available supply.
Negative Funding Rates: Despite price gains, futures markets show neutral-to-negative funding rates, indicating room for leveraged longs to enter.
Post-Halving Scarcity: The April 2024 halving has tightened new supply, with only ~19.86 million BTC in circulation (94% of total supply mined).
Conclusion
A decisive breakout above $98,000 would signal a bullish regime shift, targeting $100,000–$109,000 in May/June. However, traders should watch for volume confirmation and macroeconomic cues to validate the move. Failure to hold gains could see Bitcoin retest lower support, but the broader 2025 outlook remains bullish, with institutional adoption and scarcity dynamics underpinning long-term upside.
Critical events this week: US CPI data (May 30) and ETF flow trends will be pivotal for sustaining momentum.

BTC DROPS 2% FROM A HIGH OF 97,895.26 Price recently made a 2% increase and quickly dropped back. I envisage a buy opportunity from the current market price. target profit is 97,895.
take advantage of this opportunity.

BTC Bias bullish imbalance that ultimately failed to provide expected support. Subsequently, the market executed liquidity sweeps, indicative of stop-loss inducement. Following this, price retraced to a discernible Optimal Trade Entry (OTE) level, which is currently exhibiting respect as a potential pivot point.
The failure of the anticipated bullish reaction at the imbalance suggested underlying bearish strength. The ensuing liquidity sweeps provided the necessary momentum for a directional move. The subsequent adherence to the OTE level now presents a technical confluence warranting attention for potential trading opportunities aligned with the observed market flow.

BTC can move slingshot? - When 87k?BTC as mentioned, have a slingshot move as mentioned above and shall come to the SVP 95,010, where can move up again

BTC/USDT Quick Update – May 4Bitcoin to $102K? Bullish Momentum Still in Play (4H Chart)
Bitcoin is holding strong within an upward channel, showing clear bullish structure with higher highs and higher lows. After breaking out of a long consolidation phase, it’s now finding support around $94.5K and riding along the midline of the ascending trend.
Momentum looks solid, with price above key EMAs and holding structure.
Next major resistance: Sitting at $102,000, which lines up with the top of the channel and a previous supply zone.
Indicators:
RSI is slightly cooling off, suggesting potential short-term consolidation.
ADX still supports a strong trend.
Volume’s dipped a bit, so we may need fresh buying pressure for the next leg up.
If BTC can hold above $94.5K, the bullish structure remains intact. A push to $102K looks likely in the short to mid-term.

Trading Secrets:How To Find The Best Assets To Trade-Part 1Trading keep be a challenge for you and
i understand if you are struggling to understand it.
I made decision yesterday and decided to
learn how to drive a car.This is something
that is life changing and i pray and hope that i will make it.
Its crazy that i never thought about this
idea in order to make money from it.
The key is to learn how to produce and not consume.
The problem with young people is that
all they care about is that dopamine rush.
They are thinking about consuming and not producing,
This is a huge problem and i never
thought about it in the beginning.
When you trade you need to manage risk.
You should not use margin at all.
If you want to use margin then you have to
Be a pro.Otherwise in the video i am only using 10x Margin on Forex.
Then i am only using X2 Margin in stock trading.
This is because these are the best risk levels
for the secret system i am using which
i can not share with you.
But i can share with you my HOT PICKS!!
watch this video to find my HOT PICKS..
Rocket Boost This Content To Learn More
Disclaimer: Trading is risky please risk management
and profit taking strategies.Also Feel free to use a
simulation trading account before you use real money.

BTC (1H) condition 2If market didn't respect this resistance trendline..
then this will be bullish...
but this is my condition 2 . and i don't think this will happen.. but if happened then this will hit again..

Bitcoin Could Rise Toward Its All-Time High"Bitcoin Analysis:
If Bitcoin stabilizes around the $100,000 zone, it could continue its upward momentum and potentially reach new all-time highs. However, if the $98,000–$100,000 resistance range holds strong, we may see a price correction that could bring Bitcoin down to the $68,000 support level.
It’s also crucial to closely monitor macroeconomic factors such as the U.S. Federal Reserve’s interest rate policies, the ongoing trade war, and potential economic recession in the U.S.—these factors can significantly influence Bitcoin’s price direction.

BTCUSDT Bullish FrameworkBTC is coming for All Time Highs.
Any pullback into the Weekly Swing Point, I will be loading up my bag for a run to ATHs.
Let's see .....

BTCUSDT to head towards 106kBTCUSDT is currently trading inside weekly resistance zone WR1 and currently holding inside this zone. However, since it has not been rejected outrightly from there showing the strength and a high probability of it breaking this resistance and moving to the upside towards 106k area. Later we can see pullback from there towards WR1+DS1 zone testing as support and then bounce again from there towards clear sky as depicted on the chart. This structure will also create a giant inverse head and shoulder fueling the upward move later on. However, those we will assess later after more price action is there. But for now, lets focus on this long trade from weekly resistance zone WR1 to 106k.

BTC to hit 98k in coming daysPrice cleared buyside liquidity on the daily and is currently heading for the bottom of the range. Below the bottom sell side liquidity is a 5 minute institutional candle which caused the previous weeks rally. Price to bounce of 96k and head towards 98k in the coming days. Trade carefully

Btcusdt scalpers perspective.On the 15-minute timeframe, BTCUSDT formed a bullish inverse Head and Shoulders (iH&S) pattern. The initial target of $95,000 has already been reached. Further targets are $96,000 and $97,000. The invalidation level for this pattern is below $92,800.

What’s Next for Bitcoin?At the moment, we’re inside a broad consolidation range between 109,951 and 74,456, with the midpoint at 92,204. Based on this, we can see that price is currently trading near the upper boundary of the range — showing strength and aiming for a potential breakout toward a new ATH. Additionally, price remains above the 0.618 Fibonacci retracement level, which reinforces the bullish outlook. We’re also testing the upper band of VWAP, acting as resistance.
Personally, I’d prefer to short — but right now it’s simply not the time. If we try to assess the chart objectively, this is clearly a long setup with a target above 110,000. As for potential shorts: they only make sense if price drops below the midpoint — under 92,204. If we start to break down from that zone, then selling becomes viable, with the first target around 74,456 or even lower. Because in that case, price likely won’t stop at 74,456 — it may push significantly deeper.

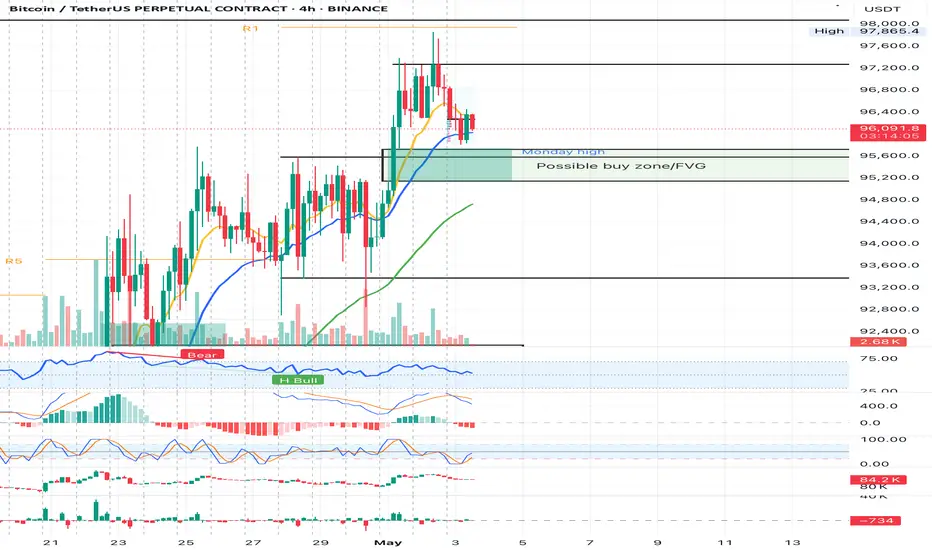
BTC-----Sell around 96300, target 95300-95000 areaTechnical analysis of BTC contract on May 2:
Today, the large-cycle daily level closed with a medium-yang line yesterday, the K-line pattern was single-yin and single-yang, the price was at a high level, and the attached indicator was running in a golden cross. However, although the price broke through the high point yesterday, it did not continue. It is currently in a waving trend. In this way, we still have to look at the range shock trend in terms of trend, and the transaction is still high-altitude and low-multiple; the short-cycle hourly chart showed that the US market rose and broke the high yesterday, and the price retreated under pressure in the early morning. The current K-line pattern is continuous and negative, and the attached indicator is running in a dead cross, so there is a high probability that there will be a demand for a decline during the day.
Therefore, today's BTC short-term contract trading strategy: sell at the current price of 96,300 area, stop loss at 96,800 area, the first target is 95,300 area, and the second target is 95,000 area;
