TradeCityPro | Bitcoin Daily Analysis #83👋 Welcome to TradeCity Pro!
Let’s dive into the Bitcoin analysis and key crypto indices. As usual, I want to review the triggers for the New York futures session.
🔍 Today, I’ll provide the analysis in the 4-hour timeframe, since not much has changed on the 1-hour chart compared to yesterday, and it's better to take a slightly longer-term look at the chart.
⏳ 4-Hour Timeframe
As you can see in the 4-hour chart, we have an upward leg that started from the 84,000 zone and extended to 97,108. Currently, it's ranging between 93,626 and 95,370.
✔️ The main market top lies at 97,108, but the price has formed a range slightly lower, with 93,626 acting as support.
⚡️ There's a strong divergence visible in the RSI — while Bitcoin has formed three consecutive higher highs, RSI has printed lower highs. This divergence was activated when RSI broke below 50, and the price corrected to 93,626.
📊 In my opinion, the market has now digested the divergence, but the impact it had was a correction down to this level. If 93,626 breaks, deeper corrections could follow.
✨ The 93,626 zone overlaps with the 0.236 Fibonacci retracement and forms a PRZ. If this level breaks, we can open a short position. I open this kind of trade in lower timeframes as a scalp and take quick profits, since it’s counter-trend.
🔽 The maximum short-term target I expect for this trade is the 91,945 area. It's possible that the price corrects further or even reverses trend, but it's not logical in my strategy to hold these kinds of trades longer.
🔑 The key supports ahead are 91,945 (which overlaps with 0.382 Fibonacci), and further down are the 0.5 and 0.618 Fibonacci levels.
📈 For a long position, breaking 95,370 is currently the best trigger. You can also enter on a break of 97,139, but there's strong resistance at 98,828 that could halt the upward move.
🔼 If the price corrects and reaches 91,945, you can consider a long entry based on the price’s reaction to the supports I mentioned.
👑 BTC.D Analysis
Let’s move on to Bitcoin dominance. On the 4-hour chart, there’s an ascending channel where price is moving, with multiple touches. Right now, it’s testing resistance at 64.91.
☘️ If this level breaks, dominance could move up to the top of the channel. There’s also a very important static resistance at 65.59. If price reaches this area, we need to watch its reaction.
📅 Total2 Analysis
Now onto Total2. Similar to Bitcoin, it had a bullish leg, but corrected more deeply — down to the 0.382 Fibonacci retracement, and now it’s at the 1.01T support.
⭐ If this zone breaks, the next supports are at the 0.5 and 0.618 Fibonacci levels. There’s also a strong support at 980B, and the major bottom is at 932B.
📉 For a short position, breaking 1.01T is suitable. For a long position, a bullish reaction from this same area is a good trigger. The main long trigger is the break of 1.05T.
📅 USDT.D Analysis
Let’s move to Tether dominance. This indicator has reached a major top at 5.19. If this level breaks, it can move upward.
👀 If it breaks, the next resistance is 5.37. This move would coincide with a market correction or drop.
📊 To confirm a bearish Tether dominance (bullish market), rejection from 5.19 is a good trigger. The main trigger is still the break of 4.99.
❌ Disclaimer ❌
Trading futures is highly risky and dangerous. If you're not an expert, these triggers may not be suitable for you. You should first learn risk and capital management. You can also use the educational content from this channel.
Finally, these triggers reflect my personal opinions on price action, and the market may move completely against this analysis. So, do your own research before opening any position.
BTCUSDT.3S trade ideas

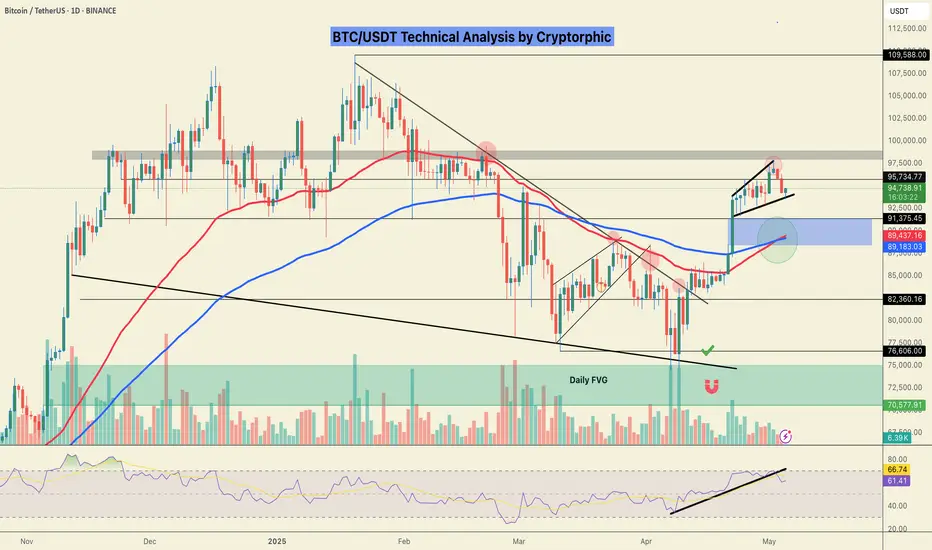
Bitcoin may rebound from seller zone and start to declineHello traders, I want share with you my opinion about Bitcoin. In the past, the price had been consolidating within a broad range, repeatedly rejecting support and resistance zones. The buyer zone between 79100 - 80300 provided a strong base, and from there, BTC began to grow, forming a bullish structure that led into an upward wedge. This growth accelerated once the price broke through the support area and continued upward until it approached the resistance level at 95500, which also overlaps with the seller zone. As the price moved inside the wedge, the bullish impulses weakened. Buyers lost strength near the resistance line of the wedge, and recent price action suggests that sellers are stepping in at the top. We’ve now seen multiple failed attempts to break higher, and the price is consolidating under resistance, forming pressure to the downside. This entire consolidation near the wedge resistance, especially inside a confirmed seller zone, indicates a likely reversal. The current structure shows signs of exhaustion, and if the support line of the wedge breaks, that would trigger a significant correction. Given this context, I expect BTC can make a bearish move toward TP1 at 91500 points. Please share this idea with your friends and click Boost 🚀

Bitcoin Range-Bound in Heavy Resistance – CME Gap Still Open!Bitcoin ( BINANCE:BTCUSDT ), like Gold , has been moving in a Range for the past 5-6 days and is currently in a Heavy Resistance zone($95,950-$88,500) , as it has been in the past few days .
In terms of Elliott Wave theory , Bitcoin appears to be completing a main wave 4 . The main wave 4 structure can take two forms: Double Three Correction(WXY)_Expanding Flat(3-3-5) .
I label this analysis " Short " for the following reasons:
Due to Bitcoin's higher correlation with the S&P 500 Index ( SP:SPX ) these days, I am short on the S&P 500 Index.
China’s president Xi Jinping says Trump lied about them having a phone call ; it is NOT good news for the S&P 500 Index and Bitcoin .
CME Gap($92,525-$91,415) has NOT filled yet, and I think Bitcoin will NOT start the next bullish rally before filling the CME Gap.
I expect Bitcoin to drop to at least $92,830 and then decline to the Support zone($92,000-$91,400) if the Support lines are broken.
Cumulative Short Liquidation Leverage: $96,741-$95,520
Note: If Bitcoin can touch $97,000, we should expect more pumping.
Note: If Bitcoin goes below the 100_SMA(Daily), we should expect a fall.
Please respect each other's ideas and express them politely if you agree or disagree.
Bitcoin Analyze (BTCUSDT), 1-hour time frame.
Be sure to follow the updated ideas.
Do not forget to put a Stop loss for your positions (For every position you want to open).
Please follow your strategy and updates; this is just my Idea, and I will gladly see your ideas in this post.
Please do not forget the ✅' like '✅ button 🙏😊 & Share it with your friends; thanks, and Trade safe.

Bitcoin Potential UpsidesHey Traders, in today's trading session we are monitoring Bitcoin for a buying opportunity around 95,000 zone, Bitcoin is trading in an uptrend and currently is in a correction phase in which it is approaching the trend at 95,000 support and resistance area.
Trade safe, Joe.

Bitcoin Buy Opportunity: Last Chance To Buy Below $100,000Bitcoin isn't trading at $78,800 nor $80,000 nor even $85,000 but still, even a small retrace is good to buy; even a small retrace is better to buy and enter a new trade than when prices are moving up.
A strong support range consisting from the lows of December 2024, January and February 2025 can be seen mapped on the chart. The lows on these date produced a support range between $89,250 and $94,250.
Bitcoin is now not trading within this range but if it does go there let me be the one to tell you that this would be an amazing entry zone and buy opportunity. This is marked green on the chart.
The truth is that when Bitcoin goes bullish it never looks back, it grows and grows and grows but, since we are set for the 2025 bull market and several new All-Time Highs, any retraces should be bought strong because there might not be another chance like this available.
Whenever the market goes red, that's the time to buy strong, go LONG and prepare for the continuation of the bullish trend.
Whenever the market turns green, we just let it grow and secure small portions of profits when resistance is hit. Rinse and repeat.
Right now Bitcoin is red but it won't be red for too long. See the trade-idea below to understand how Bitcoin will behave around this resistance zone:
It is the inverse image of the February drop. It will range a few days around this zone and then produce a very strong advance. This is your last chance to accumulate below 100K while Bitcoin is still low.
Once Bitcoin moves above 100K, 90K is gone. Just like $75,000, it is gone for this entire cycle. Just like $80,000, you cannot buy at $80,000 anymore. The same for $85,000 or anything below 90K.
This is the last chance to buy Bitcoin below $100,000 before the continuation of the bullish trend. This opportunity can remain open for a few more hours just as it can last a few days. But it won't be available for too long. Make your decision now, Crypto is going up.
Thanks a lot for your continued support.
Namaste.

BTC LONGA beautiful pullback to the 0.618 Fibonacci level is possible, right before the CME market opens. This could present a potential long entry opportunity.

2 options but both are bullish!CRYPTOCAP:BTC is consolidating but wants to make a next leg next week. Or we break out out of the falling wedge or after some more consolidation in the ascending wedge.
either way bullish!!!

TradeCityPro | Bitcoin Daily Analysis #87👋 Welcome to TradeCity Pro!
Let’s get into the analysis of Bitcoin and major crypto indices. As usual, I’ll review the triggers for the New York Futures session.
⏳ 1-Hour Timeframe
On the 1-hour timeframe, Bitcoin moved sideways yesterday as I mentioned, and after the RSI exited the Overbuy zone, it corrected down to the 102391 area.
🔍 This was a very minor correction, mainly due to the RSI leaving the Overbuy zone. Currently, the oscillator has reset, and if it re-enters Overbuy, we can confirm the start of bullish momentum.
✨ Now the candle has closed above the 103642 area, and if the price stabilizes above this level, it could move toward the main resistance at 106247.
📊 In my opinion, the price will move toward 106247 and then enter a correction because the breakout of 103642 was accompanied by increased volume, and if this volume continues, the probability of this move increases.
📉 If the correction starts from the current level, the first support we have is 102391, and after that, there is no solid support until 99337.
🧩 The reason I’m not using Fibonacci to find support zones is that the price hasn’t confirmed the start of a correction yet, and a proper top hasn’t been formed. I’m waiting for that top and confirmation of the correction before identifying key correction levels.
✔️ For now, only these two support levels are important, and as long as the price is above 99337, the trend remains bullish.
📈 For opening a position today, the Bitcoin trigger at 103642 has been activated and is currently getting a pullback. If you get confirmation from this pullback, you can enter a position — but be careful, there's a very important resistance at 106247 and that zone is highly significant.
👑 BTC.D Analysis
Let’s move to Bitcoin dominance. Yesterday, dominance had a slight correction and pause, and today it broke the 63.61 area and is moving toward the 63.23 support.
⚡️ It seems there’s strong bearish momentum in dominance, and if it continues to drop, I believe it could easily break 63.23 and move further down.
📅 Total2 Analysis
Let’s check out Total2. Yesterday, the 1.17 trigger for this index also activated, and you could open positions on altcoins.
💥 The next resistance we currently have is the 1.22 area, and considering the drop in Bitcoin dominance, this index can easily move toward that resistance.
🔔 At the moment, I can’t give you any trigger on this index — you can only enter based on confirmation from individual coins.
📅 USDT.D Analysis
Now let’s look at Tether dominance. This index has also continued its move and after a short pause, broke below 4.65 and is moving downward.
🎲 For now, the trend in dominance is bearish, which pushes the market upward.
❌ Disclaimer ❌
Trading futures is highly risky and dangerous. If you're not an expert, these triggers may not be suitable for you. You should first learn risk and capital management. You can also use the educational content from this channel.
Finally, these triggers reflect my personal opinions on price action, and the market may move completely against this analysis. So, do your own research before opening any position.


BTC - Bulls vs Bears! Who will win?current market context
the chart displays btcusdt on the 1-hour timeframe, currently in a consolidation phase following a strong impulsive move to the upside. this phase is characterized by a range-bound price action forming a horizontal channel, with clear resistance near the top of the range and support near the bottom. the price is fluctuating between these two levels, indicating temporary equilibrium in the market where neither buyers nor sellers have established dominance.
consolidation structure
this range is acting as a reaccumulation zone, typically formed after a significant move when the market pauses to either absorb liquidity or distribute orders before the next impulsive leg. within this range, traders are positioning themselves for a potential breakout, and institutional players may be accumulating or offloading large positions depending on market intent. the balance within the range suggests that market participants are awaiting a catalyst before committing in size to a direction.
bullish breakout scenario
if price breaks above the range high, it would signal bullish continuation. such a breakout would likely occur with increased volume and a strong momentum candle, confirming buyer interest and initiating an expansion move. this move could target new highs, potentially opening the path toward all-time highs as the breakout clears short-term liquidity and invalidates local bearish structures. the green projection on the chart visually outlines this potential path, where the breakout leads to higher prices with minimal resistance above.
bearish breakout scenario
alternatively, a breakdown below the range low would indicate a shift in short-term market sentiment and a break in bullish structure. this scenario would likely trigger sell-side liquidity and initiate a quick move toward lower fair value gaps. these gaps, left unmitigated during the previous bullish rally, now serve as potential targets for price to fill. the red arrow illustrates a scenario where price pierces below support, accelerates lower, and seeks inefficiencies and demand zones around the \$98,000–\$95,500 levels. this breakdown would likely be sharp, driven by stop-loss triggers and sell-side imbalances.
range as a decision zone
the current structure represents a critical decision zone. the upper and lower boundaries are pivotal breakout levels, and the outcome of this consolidation will determine the short- to medium-term market direction. traders should exercise caution while price remains within the range, as fakeouts or liquidity sweeps are common near such levels. confirmed structure breaks and volume surges should serve as validation tools before entering directional trades.
liquidity and volume considerations
liquidity resting above and below the range acts as fuel for the eventual move. the longer the range holds, the more liquidity builds on either side, increasing the probability of a strong expansion when price finally breaks out. volume analysis will be key in validating the breakout’s legitimacy—without accompanying volume, the breakout could fail and result in a false move or whipsaw.
summary
this setup provides a high-probability environment for breakout traders and those waiting to trade the trend continuation or reversal. the market is compressing within a well-defined range, and a decisive breakout is likely imminent. preparation, not prediction, is the priority—wait for confirmation of structure shift and volume expansion before committing to either side.

the big short is inevitablefrom the look of thinks I don't know what will Mae the crypto market crash but the crash seems to be inevitable.we can see BTC DROPPING TO as low as 75k and the further drop will be expecting however everything depends on the future events

TradeCityPro | Bitcoin Daily Analysis #82👋 Welcome to TradeCity Pro!
Let’s dive into the analysis of Bitcoin and key crypto indicators. As usual, I’ll walk you through the futures triggers for the New York session.
⏳ 1-Hour Timeframe
As you can see, yesterday the price stabilized below 95370 and completed a downward leg to 93626, reacting exactly to the level I pointed out in the previous analysis.
✔️ I mentioned earlier that you could enter a short position after breaking 95370 — but remember, this position is against the higher timeframe trend, so the downward move will likely end once it hits the first support, since the market momentum remains bullish on larger timeframes.
💥 Currently, the price has reacted to 93626 and seems to be resting from the previous downward move. I believe a new range box may form between 95370 and 93626 — if that happens, I’ll go long on a break above 95370.
🔽 For short positions, given the bearish momentum in this timeframe, we can look to re-enter on a break below 93626 in the next retest.
📊 Watch volume and RSI today. The volume of red candles has been much higher than bullish ones, which increases the chance of a deeper correction. If you’re shorting, keep a tight stop-loss, take profits quickly, and treat it as a scalp trade.
📈 For long positions, since it’s against the short-term trend, you’ll need a wider stop — but if the correction ends and a new bullish leg begins, the trade may stay open longer.
🧩 As for RSI: as long as it stays below 50, market momentum is bearish. A break below 30 and entry into oversold increases the likelihood of more downside.
👑 BTC.D Analysis
Bitcoin dominance broke 64.77 yesterday and retraced to 64.60. If this downward move continues, we could see early signs of a trend shift.
✨ Important note: dominance has been in an uptrend on higher timeframes, so a break of 64.60 only confirms a short-term correction. Don’t take it as a trend reversal just yet.
💫 If dominance continues to drop and the market rises, altcoins could outperform Bitcoin. Conversely, if dominance rises again, Bitcoin will rally more than altcoins.
📅 Total2 Analysis
Total2 broke below 1.03 yesterday, retested it, and now looks set to continue downward. The next support is at 1.00 — if you’re already short, consider taking profits at that level.
☘️ We’ll get full trend reversal confirmation with a break below 1.00. For long positions, the 1.05 breakout is extremely important. I strongly recommend not missing that trigger if it happens.
📅 USDT.D Analysis
USDT dominance stabilized above 5.10 yesterday, moving further away from 4.99, and is now testing 5.19. A break above 5.19 would be a strong signal that a deeper market correction is starting.
🔑 On the flip side, a break below 4.99 is still the best and most important trigger to confirm the market’s return to a bullish trend.
❌ Disclaimer ❌
Trading futures is highly risky and dangerous. If you're not an expert, these triggers may not be suitable for you. You should first learn risk and capital management. You can also use the educational content from this channel.
Finally, these triggers reflect my personal opinions on price action, and the market may move completely against this analysis. So, do your own research before opening any position.

Bitcoin Technical Analysis: Bearish Continuation with $95,200 TP
Looking at the Bitcoin/TetherUS chart from TradingView dated May 3, 2025, I can see a clear short-term bearish trend forming with several notable technical patterns.
The price is currently around $96,158.01, showing a decline of -0.17% with a volume drop of -0.75%. Let me correct my analysis for a short position:
KEY Technical Observations
- A descending channel has formed after rejection from the $97,200 resistance level
- Price is breaking down from a consolidation area around $96,327-$96,419
- The green shaded area indicates a projected downward movement targeting $95,349.80
- Consecutive red candles with increasing body size suggest accelerating bearish momentum
Trading Opportunity - SHORT POSITION
This setup presents a bearish continuation pattern with the following take-profit targets:
- TP1: $95,800 (initial target within the projection)
- TP2: $95,350 (projected bottom as indicated by the green zone)
- TP3: $95,200 (key horizontal support line)
Entry point for shorts would be on any retest of the $96,327 resistance (previous support now turned resistance).
Creative Strategy: The Emerald Descent
The green projection zone appears to be forecasting a controlled drop toward the $95,200-$95,350 area. This well-defined bearish channel presents an opportunity to ride the momentum down to these targets.
Set a stop loss above $96,600 to protect against unexpected upside movements.
The declining volume (-0.75%) suggests this move is a continuation rather than a panic sell, making it a more predictable technical play rather than an emotional reaction.

Bitcoin (BTC): We Reached Liquidity Line | Important Zone!Once again, Trump is at his finest, tweeting about another economic news (major trade deals), which pushed decent volatility into the markets, which led Bitcoin to an important liquidity zone near the $100K area.
We are going to monitor this zone now and once we see any clear signs of proper breakout or rejection, we will be looking for direction based on reaction, but as of now we are stuck at that area so as long as we have not broken it fully, we are looking for rejection from here. Let's see.
Swallow Academy

BTC - Accumulation, Manipulation & Distributioncurrent market structure
this btcusdt 1-hour chart illustrates a classic three-phase market structure: accumulation, manipulation, and potential distribution. the price action follows a strong bullish impulse, after which the market enters a sideways range suggesting absorption of previous selling pressure. this kind of behavior is often observed before a continuation of the prevailing trend, but not without intermediate structural games, as seen in the projected manipulation phase.
accumulation phase
the blue highlighted zone marks a consolidation range that serves as an accumulation phase. during this stage, large market participants likely accumulate positions quietly while maintaining the price within a defined range. the tight price action within this zone and relatively small candles are consistent with market absorption, where supply is being matched or outpaced by demand. the repeated rejections of lower prices in this range imply growing buyer interest and strength building beneath the surface.
unfilled fair value gap
beneath the accumulation range lies an unfilled fair value gap (fvg), shown in grey. this price imbalance was left behind during the prior bullish leg and remains a magnet for price action. such gaps often attract price as the market seeks efficiency by mitigating unbalanced areas. the presence of this fvg makes it a likely candidate for a liquidity grab or retest before further bullish continuation.
manipulation setup
the red path outlines a possible short-term manipulation event. this move involves a quick sweep of liquidity beneath the accumulation zone, triggering stop-losses from late long entries and drawing price into the fvg. this is a classic “spring” or “shakeout” scenario designed to trap sellers and create panic, thereby enabling larger players to enter at discounted prices. the manipulation tag here signals a deliberate attempt to create false downside conviction before reversing upward.
re-accumulation and breakout
following the manipulation phase, the green projection shows a sharp reversal and aggressive push upward, initiating a new bullish leg. this move represents re-accumulation, where price quickly exits the range and enters an expansion phase. momentum will likely increase after price breaks back above the original range high, signaling confidence in the trend continuation and drawing in breakout traders. the large green area indicates the expected path toward a new distribution zone.
distribution projection
at the top of the chart, the green box represents a possible future distribution zone. after an extended bullish run, price often enters distribution, where buying interest begins to wane, and larger participants start offloading positions into retail strength. although speculative at this point, its placement reflects the natural progression of a market cycle if the projected bullish move plays out.
market psychology
this chart reflects a clear sequence in market psychology: stealth accumulation, a manufactured dip to create fear (manipulation), followed by a surge fueled by both institutional entries and retail breakout traders. understanding this dynamic helps traders anticipate rather than react, positioning themselves in alignment with likely intent rather than emotional impulses.
summary
the chart outlines a structured bullish scenario with a potential manipulation wick into an unfilled fvg, setting the stage for a continuation higher. if price reacts strongly off the fvg and regains the range, confirmation of bullish intent would be established. this setup emphasizes the importance of understanding liquidity dynamics and price inefficiencies, favoring patient and strategic entries over reactive ones.

Bitcoin: Strong Support —Back To BasicsNotice the black lines on this chart...
The lower line marks the January 2025 wick low.
The second line, a bit higher, matches the December-November 2024 wick low.
Last week Bitcoin smashed this resistance range and is now safely trading above it. The break of this support turned resistance turned once more support is a major bullish development.
The action as it is happening now on the weekly timeframe puts Bitcoin back in the same conditions as before the March 2025 breakdown.
Notice the entire period after the March 2025 breakdown and April recovery, this is a classic stop-loss hunt event, liquidity hunt or bear-trap. The action moved below support just to quickly recover.
This can also be read as a "failed signal."
The bears attempted to move the market lower but failed. A failed signal turns into a strong signal contrary to the initial direction of the move. So if this is a failed bearish signal it translate from a TA perspective into a strong bullish signal. This works because it reveals a double-bullish dynamic. The failed bearish continuation after breakdown reveals bears weakness, the successful recovery reveals bullish strength; two points for the bulls.
Now, the active weekly candle/session did not wick lower to test the "strong support" price range, between $89,250 and $90,500, black lines on the chart, no, instead the action is happening safely above this range.
Bitcoin is super strong right now. Strong support.
If Bitcoin were to move lower and challenge this support zone, this would become a unique opportunity, a very strong opportunity, an amazing opportunity to buy LONG with high leverage or simply accumulate more if you are spot.
If it drops, awesome, a unique buy opportunity.
If it continues higher right away we are good because Bitcoin has been green four weeks straight.
It doesn't get any better and we have the support of the entire Altcoins market which is starting to heat up. I told you we would see slow steady growth, it doesn't happen in a day because are in a long-term bullish phase but oh boy, oh boy, oh girl oh boy it will grow.
By late May 2025, everything will be green 2-3 levels up. That is, minimum 200%-300% up and that is just the start. You've been warned.
Thanks a lot for your continued support.
Feel free to follow if you enjoy the content.
Namaste.

#BTCUSDT: Will Bitcoin Make Any Correction To $90,000?Hey Everyone,
Happy Sunday
Currently, Bitcoin’s price is consolidating within a shorter timeframe, which has heightened the likelihood of it reaching the $90,000 ‘FVG’ region. However, this could be attributed to the hectic week we experienced, with numerous significant market announcements that have heightened uncertainty in the cryptocurrency market. At present, there are two opportunities for Bitcoin: one is riskier, while the other is considerably safer. You can utilise this analysis as a secondary bias.
We extend our best wishes and good luck in your trading endeavours. Your unwavering support is greatly appreciated.
If you wish to contribute, here are several ways you can assist us:
- Like our ideas
- Comment on our ideas
- Share our ideas
Team Setupsfx_🚀❤️

Bitcoin - time to take SL of Buyers adn SellersBitcoin - time to take SL of Buyers adn Sellers
Price reached key resistance POC of a range - i expect a pullback
key zone for long is VWAP + VAH

#BTC/USDT Bullish Crossover in Play!CRYPTOCAP:BTC Update: Bitcoin is currently holding support and showing signs of strength with a bullish EMA crossover — the 50 EMA crossing above the 100 EMA, which historically signals upward momentum based on past fractals.
The lower support zone is marked in blue, in case the price dips further.
Immediate resistance remains at the GETTEX:98K level — a confirmed close above this could trigger a move toward $103K.
Stay tuned for more real-time updates.
Do hit the like button if you like it, and share your views in the comments section.
Thank you
BTC/USD: The Bull Run Isn’t Over yet! (READ THE CAPTION)By analyzing the #Bitcoin chart on the weekly timeframe, we can see that price has finally started rising as expected and has hit all our targets, breaking above $100,000. Bitcoin is currently trading around $103,000, and now we must wait to see if it gets rejected from this level. If there's no rejection and price breaks and holds above $110,000, we could expect higher targets around $130,000 and even $163,000 in the coming weeks. So far, this analysis has delivered over 39% return!
The Previous Analysis :
Please support me with your likes and comments to motivate me to share more analysis with you and share your opinion about the possible trend of this chart with me !
Best Regards , Arman Shaban

A massive f-you move from BTC....??Takes out the relative equal lows of Monday's range.
Bulls get wiped out.

Bitcoin (BTC): Waiting For Re-Test To $92,000 AreaBitcoin has recently formed a fake BOS, which is now sending the price down and forming BOS on smaller timeframes, showing the dominance that sellers are holding currently.
For us to see a proper upward movement or any kind of movement at all, we need to reach some kind of major zone, which would be the area near $92K.
We expect the price to fall near this zone, and once we are there, we will be looking and monitoring for market structure development. If we see dominance from buyers, we go long, and if we see dominance from sellers, then we short there.
Swallow Academy

BTCUSDTHello Traders! 👋
What are your thoughts on BITCOIN?
Bitcoin is currently testing a major resistance zone between $98,000 and $100,000, which also aligns with the 0.707 Fibonacci retracement. This area has previously acted as a strong supply zone, raising the possibility of a short-term rejection.
Scenario 1 – Bullish Breakout:
If price breaks and closes above $100,000, we could see a strong continuation toward $106,000 → $112,000, driven by momentum and possible FOMO.
Scenario 2 – Deeper Pullback Before Continuation:
If Bitcoin gets rejected at resistance, a retest of the lower support zone (previous demand area) may follow.
A successful bounce from that support could reignite bullish momentum in the medium term.
Trading Strategy:
Wait for a confirmed breakout and candle close above $100K for a high-conviction long entry.
Alternatively, look for buy setups on a pullback toward the support zone for a better risk-reward entry.
How are you planning to trade this setup? Breakout or dip-buy? Share your strategy below! 👇
Don’t forget to like and share your thoughts in the comments! ❤️
