Ultimate Guide to Liquidity Sweeps: Trading Smart Money MovesIn the world of Crypto and other financial markets, liquidity sweeps are deliberate price moves designed to capture liquidity sitting above or below key price levels. These moves are not random, they are orchestrated by large players who need to fill significant orders efficiently. By pushing price into zones where stop-losses and pending orders accumulate, these entities access the liquidity required to open large positions without causing excessive slippage.
Liquidity sweeps offer sharp insights into market structure and intent. Understanding how they work and recognizing them in real-time can significantly enhance a trader’s edge, especially in environments dominated by algorithmic and smart money behavior.
Defining the Liquidity Sweep
A liquidity sweep is characterized by a quick push through a well-defined support or resistance level, typically a recent high or low, followed by a swift reversal. These zones are hotspots for stop orders placed by retail traders, such as long stop-losses placed under swing lows or short stops above recent highs. When these stops are triggered, they act as liquidity pools.
Large players anticipate these zones and use them to enter positions. The sweep creates an illusion of breakout or breakdown, luring reactive traders in, only for the price to reverse direction once the necessary liquidity is absorbed. This mechanism reveals the strategic manipulation often present in efficient markets.
Structure and Behavior of a Sweep
The process typically starts with the market forming a recognizable range, often between a defined high and low. Price then consolidates or slowly trends toward one edge of the range, building tension. As the market reaches that boundary, a sudden surge beyond the level occurs, this is the sweep. Importantly, price does not sustain above or below the level. Instead, it quickly retraces, printing a rejection wick or reversal pattern.
Following the reversal, the market often resumes its original trend or begins a new leg in the opposite direction of the sweep. For traders, this offers a clear point of entry and invalidation, allowing for precise trade setups.
Bullish Scenario, Sweep of Lows
When Bitcoin approaches a prior low, especially one that marked a swing point or a support level, many traders place their stop-losses just below that low. This creates a pocket of sell-side liquidity.
In a bullish liquidity sweep, price will spike below this prior low, often triggered by a news event, a large market order, or a sudden increase in volatility. The market will quickly wick below the level, triggering stop-losses and perhaps inviting new short positions. However, instead of continuing lower, price snaps back above the broken level and begins to climb.
This reversal indicates that large players were absorbing liquidity at the lows and are now positioned long. Traders can look for bullish confirmation via engulfing candles, reclaim of the low, or a fast return into the previous range.
Bearish Scenario, Sweep of Highs
Conversely, when Bitcoin grinds higher toward a prior swing high or resistance level, traders anticipating a breakout may enter early, while others have stop-losses on short positions resting above the level.
A bearish liquidity sweep occurs when price spikes above the prior high, triggering those buy stops and breakout entries. Almost immediately, the market reverses, showing rejection at the highs. This action signals that buy-side liquidity has been used by larger players to enter short positions.
Once price fails to hold above the breakout level and begins to drop, the sweep is confirmed. Traders aligned with this read may look for bearish structure to form, such as a lower high, and enter short with a defined invalidation above the sweep.
Common Pitfalls and Misinterpretations
One of the most frequent mistakes traders make is confusing a sweep for a breakout. Liquidity sweeps are often mistaken for the beginning of a new trend leg, leading to premature entries that quickly get reversed.
Another pitfall is ignoring the broader market context. Liquidity sweeps are most reliable when they occur at logical levels aligned with higher time frame bias. Without that alignment, the sweep may simply be part of a choppy, indecisive range.
Lack of confirmation is also an issue. Entering trades immediately after a wick without seeing structure reclaim, volume shift, or candle confirmation can lead to unnecessary losses.
Confirming a Valid Sweep
To increase confidence in a sweep setup, traders should watch for several confirming behaviors. Volume often spikes during the sweep itself, followed by a drop in volatility as the market reverses. Divergences on momentum indicators like RSI or OBV can also support the idea of an exhausted move.
Most importantly, the reaction after the sweep matters more than the sweep itself. If price fails to reclaim the swept level or continues trending, the move was likely a true breakout, not a manipulation.
In high-probability sweeps, price often reclaims the level and begins forming structure in the opposite direction. Watching for breaker blocks, fair value gaps, or inefficiencies being respected in this phase can also strengthen the case for entry.
Conclusion
Liquidity sweeps are one of the clearest footprints left behind by smart money. While they can be deceptive in the moment, with enough practice and context awareness, they become one of the most powerful tools in a trader’s arsenal.
The key lies in understanding that these moves are engineered, not accidental. Recognizing where the market is likely hunting liquidity, and how it behaves after collecting it, can dramatically improve your ability to enter trades with precision, confidence, and clear invalidation.
__________________________________________
Thanks for your support!
If you found this guide helpful or learned something new, drop a like 👍 and leave a comment, I’d love to hear your thoughts! 🚀
Make sure to follow me for more price action insights, free indicators, and trading strategies. Let’s grow and trade smarter together! 📈
BTCUSDT.3S trade ideas

BTC - What a sentiment Change. TA was given 2 days ago.BTC was making bearish signs regarding volume. But CVD had natural movement synced to price. We were mostly bearish and we had eyes on that red box (86300) as our local key level.
2 Days ago : "we are interested on that red box level. 86300-ish"
Bounce was from 86327. 27$ difference 🧐😂
A break down and retest could be nice Short AND a bounce on it and further move up would be sign for a risky Long.
That risky Long was with low Leverage and initial capital.
Long above lower line of green channel, hVn and local previous high was better entry.
I was talking about a fake out during weekend or off days of Easter. That oscillation around hVn was shaking trades ?!
Look at TA of 2 days ago regarding Dominance of Alts and BTC. Alts Dominance played out nicely.
Currently at High of 2nd March and yearly open ( image 3).
Here previous TA of BTC:
Dominance behavior 2 Days ago:
Image 3 :
Follow for more ideas/Signals.💲
Just donate some of your profit to Animal rights or other charity :)✌️

BTCUSDT 60% LONGAscending channel (purple dotted lines)
Strong support zone (green/purple box) around $93,000–$93,400
Key resistance at $94,470 (blue horizontal line)
---
🔼 Long Scenario
Entry criteria
1. Price holds and re-tests the channel floor (~$93,200–$93,400)
2. Break and retest of the minor resistance zone at ~$93,700–$93,800
Targets
First: channel midpoint near $94,200
Final: channel top/major resistance at $94,470
Stop-loss: below the channel floor (e.g. $93,000)
---
🔽 Short Scenario
Entry criteria
1. Clear break of the channel floor (closing below ~$93,000 on the 15m)
2. Failure to reclaim that level promptly
Targets
First: next support around $92,700
Second: deeper support near $92,400
Stop-loss: just above the broken channel floor (e.g. $93,200)
---
🎲 Probabilities
Long continuation: ~60%
Bearish breakdown: ~40%
> Always use proper risk management (position sizing + stop-loss), and if a key level is decisively broken, switch to the opposite scenario.

Market Psychology and ImpressionsHi There,
Right now, BTCUSDT looks like it’s going up, but the price movement isn’t very stable. It could still go higher—but there’s also a chance it might drop. The market is kind of in a tricky area where it’s not clear what will happen next. This is where a Fibonacci tool can be useful to spot areas of interest drawn from a High to Low and take note of 0.618 and 0.5. Never chase the market; only react. Let price come to your area and give you a clear signal in terms of higher lows and lower highs for entry with some confirmation.
This is the kind of situation where people often get caught up in FOMO, jumping in too fast because they’re afraid of missing a big move. But that can lead to getting stuck if the price suddenly moves the other way.
When the market is behaving like this—unpredictable and uncertain—it’s often better to just watch and wait.
Remember: not every move needs to be traded. Sometimes, the best position is no position at all.
Stay sharp and trade smart.
Khiwe.

BTCUSDT 1H – Bearish Divergence + Liquidity Zone Below🟧 BTCUSDT 1H – Bearish Divergence + Liquidity Zone Below
🧠 Market Context:
Price pushed into new local highs but is now showing signs of exhaustion as RSI Bearish Divergence emerges — price made a higher high while RSI made a lower high. This often signals a potential pullback or local top.
🔍 Key Observations:
Bearish Divergence on RSI (highlighted clearly)
Price rejected after a sweep of recent highs
High Volume Node (HVN) and liquidity zone forming below around $90,000–$88,000
Volume imbalance visible near GETTEX:87K –$85k as possible reaccumulation areas
📊 Volume Profile Insights:
Low participation above $94k – potential inefficiency
POC (Point of Control) aligns near $90,594
Major buyer interest zones: $88,074, $86,132, and $85,165
🕐 Timeframe: 1H
📍 Exchange: Binance
🧭 Tools used: RSI, Volume Profile, Order Blocks, Market Structure


Bitcoin will return to $100,000!Bitcoin has broken above the $91,000 zone, just as we anticipated.
On-Chain Insights:
• Long-Term Holders: Mild distribution — profit-taking phase
• Network Activity: Steady — strong and healthy
• Sentiment: Bullish — weak USD and rising institutional inflows
Macro Overview:
• U.S.–China tensions and Fed uncertainty boost Bitcoin’s safe-haven appeal
• Institutions are steadily increasing exposure — a strong positive signal

Bitcoin - take long in 2 casesBitcoin - take long in 2 cases
1st case - low taking
2nd case structure change

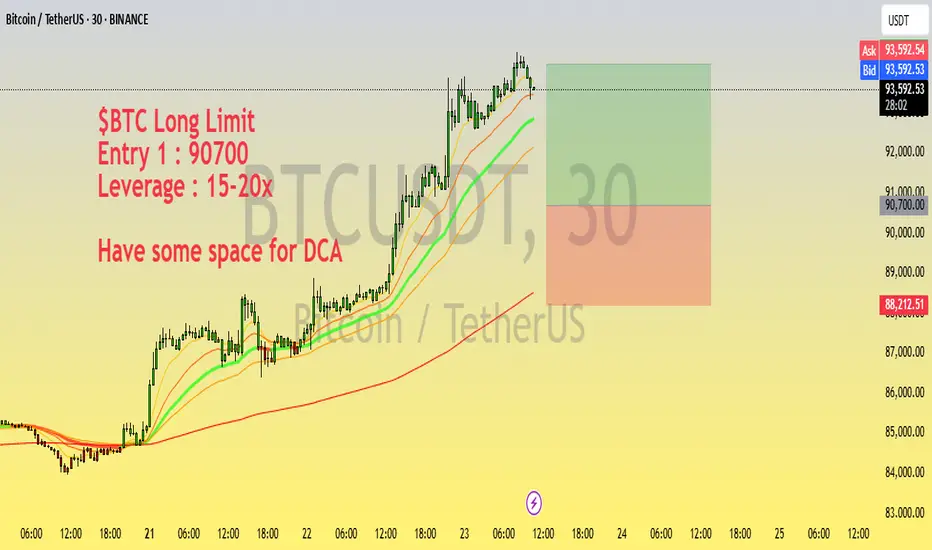
$BTC Long Setup | Entry @ 90700 | 15-20x Leverage | DCA FriendlyLooking to long BTC from the 90,700 zone with a high-conviction setup on support.
Trade Plan:
Entry 1: 90,700
Leverage: 15-20x
Setup: Price holding above key support with bullish structure forming on lower timeframes
Note: Leave room for DCA if price dips further
Monitor closely for reaction around support — tight SL recommended for capital protection.
Disclaimer: Not financial advice. DYOR and manage your risk accordingly.
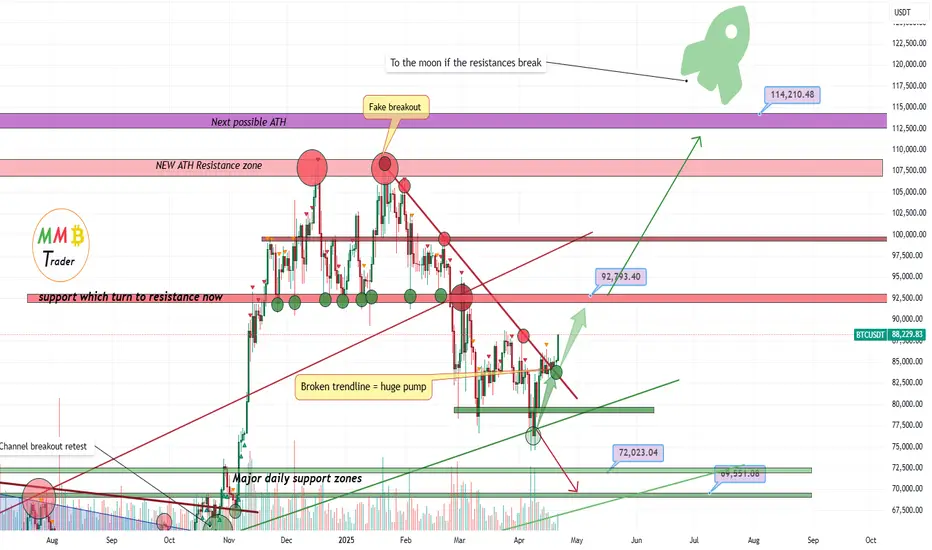
BITCOIN ALL TIME HIGHS IN THE PIPELINEBITCOIN TO ALL TIME HIGHS - WHY?
We have seen bitcoin prive to a discount of the range and showing signatures that it is ready to attack all time highs again with shorts trapped


btcusdtGreetings all, I did a numerological vol from the benchmarks and with that I concluded that we will fall hard at 66-67k dollars. I also want to point out that we have exactly an inverted chart of how the breakout was formed, fractality that has been repeating for a long time, a classic inverted pattern that often flies down after a fake carry up and hard down.

BTC Yearly Camarilla PivotsSo Camarilla pivot points is how I generally trade. Daily, weekly, and monthly usually. However let us pull up the yearly Camarilla on Bitcoin and take a look. These levels were plotted on January 1st and we can see that the bottom so far was hit to the dollar on L3 which is the projected range bottom. Short term I think there could be a pullback. However I would not be suprised to See if we strike Yearly H3 this year before this bull cycle ends. I think anyone calling for crazier targets than that is going to be very wrong. Maybe a wick beyond... but I do not think 150k to 250k s coming in this cycle. The cycle is already mature and in my honest opinion a run up to H3 might be the best we can hope for. Let us see

BTC 20% Gain Easy TargetUpon retest of support near 88,800, long position can be consider after confirmation for the target of 107,000, expected 20% in upcoming days. Must use stop loss at 72,750 to manage your risk.

Bitcoin short from 102k regionPreparing for short at around that region.
102k-105k is a short region for me. I will most likely exit 50% from the markets.
I think summer will be just like any other summer season. Bleed and not much volatility . Q4 2025 and Q1 2026 will most likely be bullish.
Lets see what markets will offer this year.

BTCUSDT Reaches Critical Volume Zone: Potential Reversal?**Executive Summary:**
Bitcoin (BTCUSDT) is currently testing one of the most sensitive areas on its macro volume profile: the 96,000 to 96,500 USDT range. This is a historically significant resistance zone marked by institutional distribution, aligning with a major wall on the VPVR. The current structure suggests a potential buyer exhaustion and opens a highly calculated tactical short opportunity.
---
**Macro Technical Context:**
From the 85,000 USDT base, BTC has rallied with strong institutional confluence:
- Rising Open Interest (new capital, not just a squeeze)
- Sustained positive cumulative delta
- Real volume accompanying all breakouts
The current move has pushed price directly into the most significant volume resistance level since early 2024.
---
**Macroeconomic Backdrop (April 2025):**
Recent global developments add additional layers of complexity:
- The IMF has downgraded global growth forecasts to 2.8% amid aggressive US tariff policies, sparking fears of global economic slowdown.
- Inflation is decelerating slowly, but financial stability risks are increasing, especially in emerging markets with high debt exposure.
- The US economy is under pressure, with reduced 2025 growth projections (1.8%) and potential recession indicators.
Despite this bearish macro backdrop, BTC has acted as a partial hedge, with capital flows possibly seeking alternative stores of value amidst fiat instability.
However, macro headwinds should not be ignored — any surge in risk-off sentiment or liquidity contraction could catalyze aggressive profit-taking.
---
**Area of Interest: 96,200 – 96,600 USDT**
This is a zone where:
- VPVR shows dense prior institutional activity
- Previous breakouts failed
- Potential bull trap setup is likely
---
**Tactical Playbook: Institutional Reactive Short**
**Entry:** Sell Limit at 96,500
**Stop Loss:** 96,950 (above local liquidity)
**TP1:** 94,800 (prior volume cluster)
**TP2:** 93,300 (pre-squeeze area)
**Risk/Reward:** 1:3.2
**Activation Criteria:**
- OI begins to drop within the zone
- Delta turns neutral or negative after failed breakout
- Volume spikes with no follow-through
---
**Retracement Scenarios to Watch**
Even if the short setup plays out, it may not signal trend reversal but rather a healthy retracement within an ongoing bullish structure.
**Expected retracement zones:**
- 94,800 – former breakout zone
- 93,300 – pre-squeeze structure
These areas align with VWAP anchors and previous institutional footprints. If price returns to these zones and OI holds or rises, they offer excellent long re-entry opportunities.
However, if BTC drops below 92k with collapsing OI and negative delta, a larger trend shift may be in play.
---
**Cold Read: Can BTC Retrace Further?**
Yes, and that’s not only possible — it may be technically healthy.
BTC has rallied +13% from 85k to 96k in under 36h. That’s steep. While Open Interest is climbing and delta is still positive, price has now deviated far above both daily and weekly VWAP anchors.
Technically, this creates a reversion risk. If we begin to see exhaustion signals at 96.5k (stalling delta, volume spikes with no follow-through, and flat or declining OI), a pullback becomes not just plausible, but strategic for institutions.
Important: This does *not* invalidate the uptrend. It simply opens room for tactical reloads near 93–94k.
Only if price breaks 92k with clear unwind do we entertain full trend reversal.
---
**Invalidation Triggers:**
- Consolidation above 97,000 with rising OI
- Aggressive delta returns on breakout continuation
---
**Conclusion:**
This setup presents a high-asymmetry counter-trend opportunity, but it requires disciplined execution. Only act with confirmed confluence. If invalidated, the structure supports continuation toward 99,000+.
Traders must also consider macroeconomic pressures that could weigh on risk appetite and crypto liquidity. Meanwhile, pullbacks to key VWAP zones around 93–94k could offer tactical reloads in favor of the prevailing trend.
Stay sharp. The market doesn't care about opinions—only data.
---
**Author:** Pôncio Pacífico
Ex-institutional, now underground.
"Read the flow. Everything else is noise."
---
*Liked the analysis? Drop a comment or follow for real-time tactical updates.*

BTCUSDT TRIANGLE PATTERN IN 30-MI Created This BTCUSDT Chart Analysis In 30-M Tf
ENTRY LEVEL. 84600
Resistance zone : 84800
Target Well Be : 82800
BTCUSDT made Triangle Pattern, It's Take Resistance BTC went to Downtrend Soon

BTCUSD sell setup 15mHello! Friends,
Greetings. Please leave a Like if you like the idea.
Before start talking about technical Let's share your LOVE by giving me LIKES to support this work. Thanks in advance.
BTCUSD possible next move after proper breakdown of this curve line✅

BTC Analysis - Bullish BiasMy current outlook on Bitcoin remains bullish, anticipating a move towards higher price levels.
I am specifically watching for the potential formation of a Fair Value Gap (FVG).
Should an FVG form, I will be looking for price to potentially retrace and touch this gap.
Upon a successful interaction with the FVG, my expectation is for price to then continue its ascent towards the higher levels I have marked on my chart.
I am focusing on identifying confirmed long opportunities based on this potential FVG setup and retest.
Trade safe!

Bitcoin (BTC): Be Careful - This Might be One Big Trap.....Bitcoin has broken the GETTEX:92K area, which on bigger timeframes is near the major resistance zone and from where we were expecting to see some sort of weakness or rejection.
What we got instead was a big liquidation hunting, which led the price into overbought zones on RSI and Bollinger Bands. 10% movement without any correctional moves on Bitcoin is a lot, and so taking that all into consideration, we are expecting at least to see a retest back to the GETTEX:92K area, from where we will get more confirmations of upcoming movements.
If we see that buyers will secure the zone, then we might actually head to upper zones, but if we see that sellers will overtake that zone (which then would mean that we have formed a fakeout), it would be an ideal shorting position - let's wait.
Swallow Academy

Do you think I'm joking ???Chart is speaking itself...
Give me some energy !!
✨We spend hours finding potential opportunities and writing useful ideas, we would be happy if you support us.
Best regards CobraVanguard.💚
_ _ _ _ __ _ _ _ _ _ _ _ _ _ _ _ _ _ _ _ _ _ _ _ _ _ _ _ _ _ _ _
✅Thank you, and for more ideas, hit ❤️Like❤️ and 🌟Follow🌟!
⚠️Things can change...
The markets are always changing and even with all these signals, the market changes tend to be strong and fast!!

Bitcoin Broke falling trendline and retest complete= Heavy pump As we can see the red trendline is already broken and porice is going to test 92K resistance zone and soon after that the resistance there will also break and we are looking for bull market now again and rise and gain for Spots in upcoming weeks.
DISCLAIMER: ((trade based on your own decision))
<<press like👍 if you enjoy💚
Btc repeated consolidation?Could we see another massive consolidation trend like our previous run just as we did it 2020-2021? I think this could be a likely scenario if we breakdown and are rejected from the 86-87k zone. If we breakdown this I think will see a rally into the 93-95k zone.
