BTC bottomed in early AprilTime to shine for true global assets
BTC, cryptos in general
Uncertainty and Gold run is done
Liquidity is back and Tax day was a noneventful
BTCUSDT.3S trade ideas

price increasingGiven the break of the dynamic resistance line, I think the price will rise to the first static resistance line.

BITCOIN - Time to buy again!I might be wrong and this might never happen, but it might come true From a technical perspective!!!
Give me some energy !!
✨We spend hours finding potential opportunities and writing useful ideas, we would be happy if you support us.
Best regards CobraVanguard.💚
_ _ _ _ __ _ _ _ _ _ _ _ _ _ _ _ _ _ _ _ _ _ _ _ _ _ _ _ _ _ _ _
✅Thank you, and for more ideas, hit ❤️Like❤️ and 🌟Follow🌟!
⚠️Things can change...
The markets are always changing and even with all these signals, the market changes tend to be strong and fast!!

BTC Forming Inverse Head & Shoulder on 4H | FIB Zone In Play!Hey Traders!
#Bitcoin is showing an interesting structure on the 4H time frame — an Inverse Head & Shoulders is in the making! Let’s break it down:
📌 Current Structure
✅ Left Shoulder – Completed ✔️
✅ Head – Completed ✔️
🔄 Right Shoulder – Currently forming 🔁
⚠️ Bearish Signals Right Now
❗ Bearish Divergence spotted on RSI (4H)
❌ Price rejected from a key resistance level
🔽 These are classic signals of temporary bearish movement toward the right shoulder
🎯 Right Shoulder Target Zone (GOLD FIB ZONE)
📍 $83,300 – $81,700
This zone aligns perfectly with the Fibonacci golden pocket (0.618–0.65) – a high-probability reversal zone! 🔥
📈 What to Look For Next?
Wait for bullish confirmation before entering a long position:
✅ Bullish divergence on 1H or 4H
✅ Bullish engulfing candle on 4H
✅ Break & retest of the 0.5 FIB level
Once these align — it's GO TIME for a long setup 🚀
Always trade with proper risk management! 🧠💰
🗣 What’s your view?
Are you waiting for confirmation or already in a position? Let’s discuss 👇
💬 Drop your thoughts
❤️ Like if you found this helpful
🔁 Share with your trading crew
✅ Follow for daily #BTC setups & high-probability strategies!
#Bitcoin #BTCUSD #Crypto #TradingView #TechnicalAnalysis #PriceAction #Fibonacci #HeadAndShoulders #CryptoTrading #BTCSetup #InverseHeadAndShoulders #BTCStrategy #DayTrading #SwingTrading

BTC USDT SHORT TRADE SETUPBTC is currently at a strong resistance level , with a high probability of rejection. Additionally, other indicators like the 200 EMA are acting as a magnet, attempting to pull the price back down .

Can bitcoin be like this?Bitcoin now stop dumping on 74k area
this is good enough as long as bitcoin can keep its price to close above that there is a possibility we will retest to the price of 80k again
the worst case scenario if it breaks 74k maybe we will find the price of 68k or even 65k

BITCOIN - Short trade Price Action Update - Wave 2 Done...In this video, I break down the smaller-degree waves near the recent highs and explore the possibility that a minor Wave 2 has completed.
If that's the case, we could see a reversal from here, provided price stays below 88,876. Wave E has been unusually complex and aggressive, but I believe I now have a clear understanding of where we are in the overall structure.
This clarity is key as we look toward the 74,517 target in a Wave (C) of Wave B decline. The critical resistance level remains at 88,876, and a break below 87,997 and 87,513 would offer further confirmation that the reversal is underway.

BITCOIN EXHAUSTIONPrice broke structure (BOS) after forming a higher low at support, triggering a strong bullish rally into premium zones. Multiple targets were met before showing signs of exhaustion near resistance. Current zone could attract profit-taking or a pullback unless buyers reclaim momentum with volume confirmation. Sentiment remains bullish across timeframes—watch for continuation or reversal cues.


BTC NEXT STOP, $88Kish.As you can see, BTC is creating an inverted H&S pattern.
Once we break this trendline resistance(symetric pattern), I think we can see the 88kish resistance level as the next stop which is clearly written in the chart.
I'm watching it, what do you think?

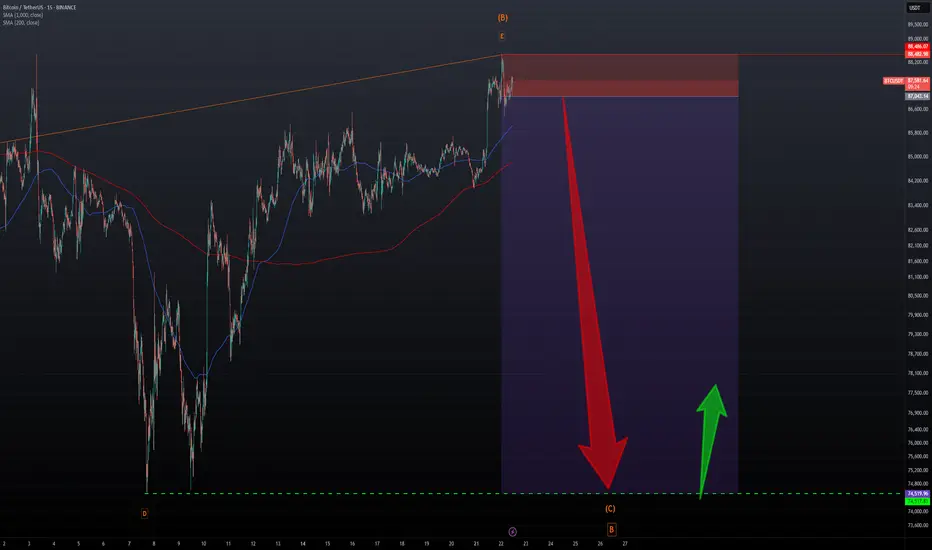
BITCOIN - Short Trade - Take 2 - Downside Target Is 74,517...We're watching for a break below 87,000 to confirm the start of Wave (C), with a target of 74,517.
If price drops below 87,000 without making a new high, it confirms 88,894 as key resistance and an ideal stop level.
For a full breakdown, check out the video linked below in Related Ideas.

BTC Breaks Key Resistance –Pullback Your Last Chance to Enter!?To start today's analysis, it's best to look at the Bitcoin ( BINANCE:BTCUSDT ) analysis I shared with you on April 10 , which can give us good insight and has performed well so far .👇
Bitcoin seems to have finally managed to break through Important Resistance lines as well as the Resistance zone ($86,500-$85,150) . The break volume is also high and could be a good sign for the continuation of the upward trend .
According to Elliott Wave theory , with the breaking of important resistance lines , we should wait for the next 5 impulsive waves , which I will try to analyze step by step in this idea and future ideas.
I expect Bitcoin to attack the Heavy Resistance zone ($95,000-$88,500) for the first time after the pullback to the broken Resistance zone ($86,500-$85,150) (it is better to enter a long position on the pullback ). Basically, assets can NOT break such heavy zones for the first time . ( With very good news, it may break for the first time ).
Cumulative Long Liquidation Leverage: $86,022-$85,539
Cumulative Short Liquidation Leverage: $89,340-$88,000 = Important
Do you think the main uptrend has resumed or will Bitcoin correct again?
Note: The pullback is likely to start from the third point of contact with the Resistance lines.
Note: If Bitcoin falls below $85,100, it seems we should expect further declines.
Please respect each other's ideas and express them politely if you agree or disagree.
Bitcoin Analyze (BTCUSDT), 1-hour time frame.
Be sure to follow the updated ideas.
Do not forget to put a Stop loss for your positions (For every position you want to open).
Please follow your strategy and updates; this is just my Idea, and I will gladly see your ideas in this post.
Please do not forget the ✅' like '✅ button 🙏😊 & Share it with your friends; thanks, and Trade safe.

BITCOIN - Price Action Update - Have We Seen The End of Wave E..Bitcoin appears to be encountering resistance on several fronts: recent highs, the 200-day moving average, and the extended length now required for Wave (C) to complete the larger Wave B Zig-Zag pattern.
A break below the 87,000 level would likely signal the completion of Wave E. Price action remains choppy at the highs due to ongoing uncertainty, but I expect this to resolve soon.
The downside target sits at a minimum of 74,517 to complete the broader Wave B Zig-Zag.

Failed Breakout + Rising Wedge = Bearish Signal for Bitcoin!?Bitcoin ( BINANCE:BTCUSDT ) attacked the Resistance zone ($87,520-$85,840) and the important Resistance line as I expected in yesterday's idea , but it seems that it failed to break .
Bitcoin is moving between two Support and Resistance zones .
From a Classic Technical Analysis , Bitcoin appears to have formed a Rising Wedge Pattern .
From an Elliott Wave theory , Bitcoin appears to have completed a main wave 5 on the 1-hour time frame .
Also, we can see the Regular Divergence(RD-) between Consecutive Peaks .
If we look at the Bitcoin chart in the 4-hour timeframe , a Shooting Star Candlestick Pattern with high volume is clearly visible near the Resistance zone ($87,520-$85,840 ), which could signal a reversal and decline in Bitcoin .
I expect Bitcoin to start declining again after an upward correction and break the lower line of the rising wedge pattern , and reach the targets I have indicated on the chart.
Cumulative Short Liquidation Leverage: $87,708-$86,487
Cumulative Long Liquidation Leverage: $84,520-$83,687
Do you think Bitcoin can finally break the important resistance line? I would like to hear your thoughts.
Note: If Bitcoin breaks above the Resistance zone ($87,520-$85,840), we can expect a pump.
Note: If Bitcoin falls below $81,000, we can expect further declines.
Please respect each other's ideas and express them politely if you agree or disagree.
Bitcoin Analyze (BTCUSDT), 1-hour time frame.
Be sure to follow the updated ideas.
Do not forget to put a Stop loss for your positions (For every position you want to open).
Please follow your strategy and updates; this is just my Idea, and I will gladly see your ideas in this post.
Please do not forget the ✅' like '✅ button 🙏😊 & Share it with your friends; thanks, and Trade safe.

Bullish continuation for BitcoinBitcoin is looking at a larger bullish continuation after breaking above the falling wedge and with bullish divergence observed from the mid-term stochastic oscillator and 23-period RSI. Ichimoku is showing two out of three bullish crossover and a V-shaped bottom formation is underway and may break 89,000-90,000 resistance level. Should it break, near-term target is at 96,700, followed by 115,000.

BTCUSD - Short Trade - Back To The Lows To Complete Wave B...Price has been rejected at the 200-period moving average on the daily time frame.
This presents an opportunity to short back toward the recent lows, completing the complex Zig-Zag structure I mentioned earlier.
A strong resistance level remains above at 88,486, with a downside target set at 74,517.
I’ll be posting a video update shortly.
The resistance penetration did not succeed. The other resistanceThe resistance penetration did not succeed. The other resistance penetration will not succeed. The major resistance penetration on the RSI was successful.

BTC will surge in the coming months and more than you expect!The monthly money supply delayed by 90 days tells you how explosive coming months will be. Be prepared!

BTC short term Wave countAnalyzing a Bitcoin (BTC) form Wyckoff schema in a 4H chart.
We can’t determine if it’s an accumulation or distribution yet. Based on MACD and Elliott Wave Theory, I believe the chart will follow a similar pattern. However, time will determine the outcome. If BTC declines and accumulates within a shorter time frame of Elliot support levels, it could be a long trade opportunity.
(This analysis is not financial advice. Your actions are solely your responsibility.)

Bitcoin - No one expect this move! 20% this week (plan here)Whales are preparing a huge trap for the retail traders, and you probably already know that the trap is this massive falling wedge! Falling wedge patterns are usually bullish, right? But not if they occur at the end of a trend. You probably want to trade wedges that are at the start of a trend. What's more, everyone is watching and buying into this wedge, which brings so much questions - will all retail traders get REKT again? Most likely yes, as usual. You want to do pretty much the opposite of what the majority of retail traders do to be a profitable trader.
You probably already know that Bitcoin is manipulated and controlled by the banks and huge institutions. They control the price and development. Do not be fooled that some average Joe geek from Florida eating McDonald's controls the development. Whales need liquidity to buy because their orders are so huge; they need time to buy as much Bitcoin as possible. That's why they need to push the price down to take all stop losses from retail traders.
The price is below the 20, 50, 100 and 200 daily moving averages - that's a huge downtrend! Also, on the chart we can see a huge previous rectangular range between 108k and 91k. It does make sense if the price will test this range before continuing to the downside. To me, this is indeed a risky speculation. I definitely don't want to speculate on that, because sooner or later Bitcoin will crash to 67k! I don't trust this falling wedge at all! Please tell me, what about you?
Write a comment with your altcoin, hit the like button, and I will make an analysis for you in response.

Bitcoin Lower High Continues ?Bitcoin saw a burst of upside momentum earlier this week, but it may be more of a reaction than a reversal. The move came after a breakout from a short-term range, yet it hasn’t managed to shift the broader trend. The latest push topped out at $88,465, just under the previous key high, failing to signal a true change in direction.
Key Points:
The high at $88,465 wasn’t enough to break the bearish market structure.
Potential downside targets include $74,500 and possibly $67,850 if weakness continues.
Price action is still printing lower highs, and unless a strong breakout clears $88,500 with momentum, sellers are likely to maintain control. A deeper pullback remains a strong possibility, especially if lower support levels are tested and fail to hold. Overall, trend continuation to the downside remains the dominant scenario until proven otherwise.

Bitcoin will Breakout Formed A Next Bitcoin zone lets see how the price will react.
Provider Mr Martin Date 21 April Monday 2025
Bitcoin price Running During between resistance zone 88,500 a waiting for solid breakout zone if the price break the near support will be 81,500 this price suggest to take profit long-term keep sellers are in full control.
The price candles will shows selling side until this resistance breakout then price will likely continue moving downside.
your like's and comments' must and also motivating and will be share more analysis to you.

BTCUSDT at daily resistance, likely to head to 84kThe price has hit the daily resistance as expected in the quoted post. I see a pullback here which is already started. A short trade setup is favorable gere, We take a short in this zone and target towards daily support DS1. The correction can go upto weekly suppor WS1 but lets focus on this short trade first. risking 1.5% for 4.5% win.
