Bitcoin Faces Renewed Pressure as 91,900 Support WeakensHello everyone, looking at BTC on the 4H timeframe, I can clearly see the market leaning decisively to the downside after failing to break through the 93,160 USD zone. The current rebound is quite weak — small candles, thin buying pressure — indicating that the market is simply taking a “technical breath” rather than preparing for any meaningful push upward.
The 91,900 USD level is acting as the nearest support, but the chart reflects clear hesitation from buyers. The expanding red FVGs above show that selling pressure continues to dominate. If BTC slips below 91,500 USD, the bearish structure will extend and price could quickly retreat toward 90,000 – 89,500 USD, where a significant amount of liquidity is waiting.
The news backdrop isn’t helping buyers either: the Fed maintains a hawkish tone, the USD is strengthening, market sentiment has turned cautious, and capital is favouring the sidelines instead of stepping in to support price.
Trade ideas

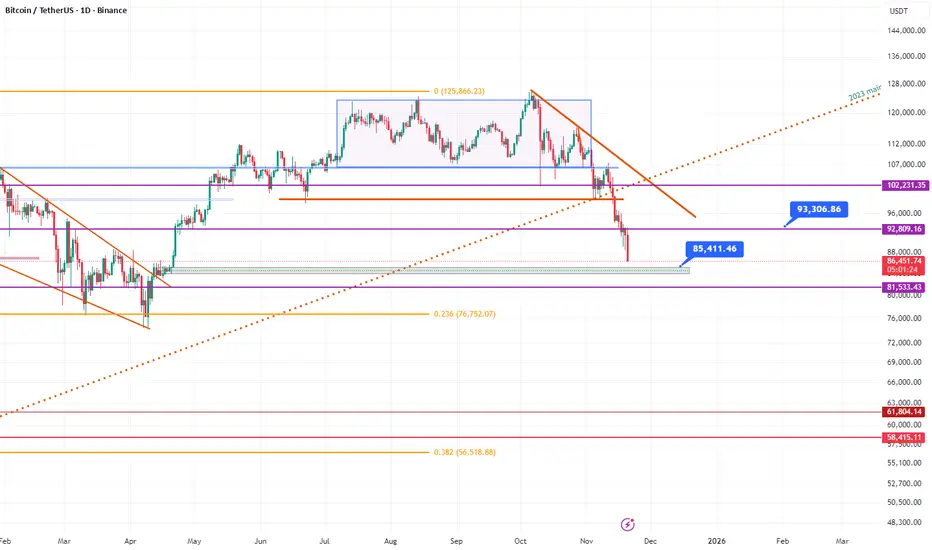
BTCUSD ShortAs you see in the chart, I see many reasons that we can see BTC to the level of 85,000$ by end of the year. So the reasons are:
Head&Shoulder pattern
Started the downtrend channel
The bold blue trendline is what the price is expected to touch.

#BTCUSD #Bitcoin Buy Setup🔼#BTCUSD #Bitcoin #Crypto Buy Setup
Currently Trading At 88564 , Buy On Dip Around 85916 And More Only At 83571 If Comes for The Target 95380—-104400

Rare Global Long Liquidity Imbalance (Order Book Signal)Over the last few days, the Long Zigg indicator has printed a rare extreme reading of 100 at the 10% order book depth — and this level appeared twice in just three days . Other monitored depths are also trading near their recent highs.
The last time we saw similar readings was around March 7, 2025 . After a brief correction, the market moved into a strong growth phase:
• BTC ≈ +70%
• ETH ≈ +225%
• SOL ≈ +166%
Many altcoins extended even further over the following months.
Long Zigg tracks the liquidity imbalance toward longs across the entire market using aggregated order books rather than price alone. It highlights moments when buy-side interest clearly dominates available sell liquidity.
Right now, this signal again shows a notable skew in liquidity to the buy side. I’m watching to see whether the market will react in a similar way to the previous extreme, or if this time will be different.
This is not financial advice and not a trade recommendation — just an observation based on my order book analytics.

BTC END OF A LEGENDARY ERA.BTC — End of a Legendary Era
A decisive break of long-term support signals a major shift in Bitcoin’s market structure. Momentum has shifted, confidence is waning, and the chart suggests the end of an era that has defined the crypto market for years.
THE END.

Bitcoin levels and overlay of previous bear market. This is a long-term Bitcoin price chart (BTC/USDT) on a monthly timeframe from TradingView, spanning from mid-2021 to early 2028 (with the current date being November 21, 2025).
Key elements:
Price action:
Bitcoin peaked around November 2021 at roughly ~$69,000 (all-time high at the time).
It then entered a prolonged bear market throughout 2022, bottoming near ~$15,500–$16,000 in November 2022.
From 2023 onward it has been in a slow, steady recovery and new bull market.
As of November 2025, the price is trading around $88,000–$92,000 and has just broken above the previous all-time high from 2021.
Horizontal lines and Fibonacci retracement/ extension levels:
The chart is overlaid with multiple Fibonacci tools (likely drawn from the 2021 ATH to the 2022 low) showing classic retracement and extension levels:
0.382 (green)
0.5 (orange)
0.618 (golden ratio, blue) – heavily emphasized
0.65, 0.786, 1.0, etc.
Higher extensions: 1.618, 2.0, etc.
The price has repeatedly respected these levels over the years:
Found support near the 0.618 (~$30k–$35k area) multiple times in 2022–2023.
Broke above the previous ATH (1.0 level) in 2024–2025.
Currently trading around the 1.618 extension (~$90k–$100k zone), with some levels drawn slightly differently by the author (e.g., 0.65 instead of standard 0.65/0.786).
Overall structure:
The chart shows a classic post-bear-market expansion where Bitcoin is now targeting common Fibonacci extension levels that many analysts use for bull-market price targets (1.618 × the prior bear-move often gives ~$100k–$140k depending on exact swing points used).

BTC DECODED ANALYSIS REMINDER UPDATES BTC decoded analysis next support, Monthly support is noted at $68,021.7 before BTC tests the quarterly support at $62,772.02.
These supports were updated on Binance on May 27th, 2025, with a brief detailed reminder updated again on October 29th, 2025.
These decoded analysis details are also mentioned in my pinned post.
All my analysis is based on actual fact based skip supports with no predictions.
This message is for educational purposes only, Always DYOR.

BITCOIN — THE SUPPORT LINEBitcoin’s ultimate support for bulls lies between the two black lines shown above.

IM BUYING THE DIP ON BITCOINIM BUYING THIS DIP ON #BITCOIN 📈
Following my plan, level by level!
Later Shorter are gonna be REKT in my opinion! 🔴
That 0.786 fib level daily, will likely act as bottom for tonight! 📈
#BTC price is also on key dem support + highly oversell (H1) & ichimoku.
I wont be surprise to see a bull trap & fake test of the previous levels.
89,000 - 90,000$ next 📈🎯 , Then dump toward 84k- ?
A retest of the 100k previous key support before to see another crash could also be a possibility!? 👀

BTC - Next Bottom in October 2026?This is my second scenario: as long as the previous weekly higher low holds, I remain bullish. However, if any candle closes below 74,500, it signals further downside ahead.”
“This represents my secondary scenario. Bullish bias remains valid while the previous weekly higher low is intact. A candle close below 74,500 would invalidate this structure and suggest additional downside.”
“Bullish while the weekly higher low holds. A close below 74,500 indicates more downside.”

Update for Bitcoin SenarioFirst lets look at Bitcoin scenario that we had in mind
, the divergence in RSI did its job nicely.
Now it seems that we can expect BTC to form a good low at the level of 80-85k for a few days and test the first resistance at 90k channel.

BTC - Next MoveFor those following my Bitcoin Crash prediction from the top, here is a smaller broken down trade that’s the first wave down in this crash.
Entry - 86,500
Stop Loss - 89,600
Take Profit - 36,000
Will report back when the next move is ready, which will likely be a long.
Happy trading.
-DD

TradeCityPro | Bitcoin Daily Analysis #226👋 Welcome to TradeCity Pro!
Let’s dive into today’s Bitcoin analysis. Our new short triggers have activated, and the market is continuing its downward movement.
⏳ 1-Hour Timeframe
After Bitcoin made a fake downward move yesterday, today it formed a lower high below 93,555, and after breaking the 90,489 and 88,825 levels, it is now continuing strongly to the downside.
⭐ A very large amount of selling volume has entered the market, giving full control to the sellers. The downtrend is continuing with strong momentum.
✨ The next support levels are 85,846 and 83,333.If you already have open short positions, you can use these levels for partial profit-taking.
✔️ The RSI oscillator is currently in the oversold zone, around 21.53.Breaking this level could push the bearish move even further.However, if RSI gets supported here, momentum may weaken, and a correction could begin.
💡 If a correction happens, the resistance zones to watch are 88,825 and 90,489.Our main confirmation for a trend reversal will still come after breaking 93,555.
❌ Disclaimer ❌
Trading futures is highly risky and dangerous. If you're not an expert, these triggers may not be suitable for you. You should first learn risk and capital management. You can also use the educational content from this channel.
Finally, these triggers reflect my personal opinions on price action, and the market may move completely against this analysis. So, do your own research before opening any position.

It is looks like have more road to go. Looks like we are going to visit 85430-85450 zone. From Amateur eyes.
BTC Dips Below Key Zone — Is $73K the Next Stop?$BTC/USDT has broken below the support trendline and the key support zone.
The next major support to watch is around the $73K level.
DYOR, NFA

Long opportunity after taking a lowBtc has hit the area where there is a small support. Let see if it can move little upward.

SELL BITCOIN It's ready for the drip just needs to fill some ob- and fvg within the four hour ob-
Keep watching and good luck good trading

BtcusdtI think Bitcoin will bounce from the 77-80K range and touch a new high in the 140K range.
If the 77K range breaks downwards, we should wait for the 60K range.

BTC - UPDATESorry to say I was right again...
CRYPTOCAP:BTC - Bearish correction weekly ongoing & very bearish bias as I explained 📉
Large cap / Medium Mcap #alts money outlflow 📉
I showed you live that it was likely a bearish trend shifting & trend reversal on the weekly outlook, and here we are!
Supports are now weak.
Key levels to watch:
$100,000 - 101,000❌
$95,800❌
$92,000 ❌
$87,000- 88,000 🎯 ⏳
$84,000🎯
$79,000 🎯
$74,000 - 75,000🎯
🟩Following my bias,Monthly momentum remain bullish, and that could just be a bearish correction before to see a new ATH.
Bull setup valid if it hold above SSB (W) at 79,000 or at least 74,000$ low.
🟥On the other hand; If bulls ar unable to hold above 74,000$ support, then #BTC price could dip much lower & momentum could stay bearish for many month.
Worst scenario -- > 63k --> 50k --> 45k - 42k 😱
At the moment, my strategy is to focus on #alts market with solid PA against #BTC such as CRYPTOCAP:ICP or CRYPTOCAP:FARTCOIN , because there are great chances to see big move when #BTC price will stabilize! 📈
Not a financial advice, cautious in this volatile market.


BTCUSDT.P - November 21, 2025Price is in a short‑term downtrend, with a series of lower highs and lower lows after rejecting the highlighted resistance area near 92,300–92,500 and breaking back below intraday consolidation. Loss of upside momentum and a rotation from a prior minor rally confirming sellers’ control and opening the door for continuation toward the marked support area around 88,800–89,200.

another victory added to the winstreekmtops-ai's forecast nailed it yet again
this one was a little harder than usual as the higher time frame is still towards the end of an already long transition
the lesson for me is to trust mtops-ai, as it knows the market better than any human ever could

