RSI-Volume Momentum Signal Score: Trading the Momentum PressureThe indicator used in this chart is an updated version of the RSI-Volume Momentum Score.
The RSI-Volume Momentum Signal Score is a predictive technical indicator designed to identify bullish and bearish momentum shifts by combining volume-based momentum with the Relative Strength Index (RSI). It generates a Signal Score derived from:
• The divergence between short-term and long-term volume (Volume Oscillator), and
• RSI positioning relative to a user-defined threshold. The Signal Score is calculated as follows:
Signal Score = tanh((vo - voThreshold) / scalingFactor) * ((rsiThreshold - rsi) / scalingFactor)
The logic of this formula are as follows:
• If Volume Oscillator >= Volume Threshold and RSI <= RSI Threshold: Bullish Signal (+1 x Scaling Factor)
• If Volume Oscillator >= Volume Threshold and RSI >= (100 – RSI Threshold): Bearish Signal (-1 x Scaling Factor)
• Otherwise: Neutral (0)
The tanh function provides the normalization process. It ensures that the final signal score is bounded between -1 and 1, increases sensitivity to early changes in volume patterns based on RSI conditions, and prevent sudden jumps in signals ensuring smooth and continuous signal line.
This updated version Introduces colored columns (green and red bars) representing momentum pressure directly. These bars:
o Green bars represent bullish pressure when the signal score is +1.
o Red bars represent bearish pressure when the signal score is -1.
o The transition point from one color to another acts as a visual signal of momentum reversal.
LONG SIGNAL: A transition from green bar to red bar indicates that bullish pressure has reached a tipping point—price is likely to rise soon.
SHORT SIGNAL: A transition from red bar to green bar signals bearish pressure is peaking—potential price drop ahead.
These transitions become intuitive signals for bullish or bearish entries, depending on the context.
BTCUSDT.3S trade ideas

Short-Term View Flips Bullish - Key Scenarios to WatchAfter carefully reviewing both macroeconomic sentiment and on-chain developments, my bias for this holiday period has shifted from short to long. Here's why.
🌐 Macro Shifts Supporting the Market:
The recent tone from the U.S. indicates a willingness to sit at the negotiation table with China, a gesture that could ease geopolitical uncertainty and risk aversion.
Key data released suggests that a recession is no longer an imminent concern. Markets love stability, and this could inject short-term confidence into risk assets, including Bitcoin.
📈 My Updated Short-Term Outlook: Based on this new backdrop, I see two main scenarios unfolding:
Clean Break and Hold Above Key Resistance:
If BTC breaks out of the current consolidation zone and holds above the resistance with volume and LTF confirmation, we could see a quick move toward the next major liquidity zone. I will be watching volume flow and delta behavior closely for confirmation before entering.
Shallow Pullback Before Takeoff:
If price retraces slightly into a local support (likely a previous breakout zone), and buyers hold it, this could offer a perfect dip-buy opportunity. This would be my preferred setup for a high-RR long position.
🚨 Stay Flexible, Not Emotional: While I'm leaning long now, I will never insist on a biased view. If key levels break down and LTF shows weakness, I’ll shift accordingly. My strength comes from adaptability — and that’s what separates consistent traders from the crowd.
📌 Follow closely, I only track coins with massive volume increases and strong order flow signals, so every setup is filtered for high potential.
📌I keep my charts clean and simple because I believe clarity leads to better decisions.
📌My approach is built on years of experience and a solid track record. I don’t claim to know it all but I’m confident in my ability to spot high-probability setups.
📌If you would like to learn how to use the heatmap, cumulative volume delta and volume footprint techniques that I use below to determine very accurate demand regions, you can send me a private message. I help anyone who wants it completely free of charge.
🔑I have a long list of my proven technique below:
🎯 ZENUSDT.P: Patience & Profitability | %230 Reaction from the Sniper Entry
🐶 DOGEUSDT.P: Next Move
🎨 RENDERUSDT.P: Opportunity of the Month
💎 ETHUSDT.P: Where to Retrace
🟢 BNBUSDT.P: Potential Surge
📊 BTC Dominance: Reaction Zone
🌊 WAVESUSDT.P: Demand Zone Potential
🟣 UNIUSDT.P: Long-Term Trade
🔵 XRPUSDT.P: Entry Zones
🔗 LINKUSDT.P: Follow The River
📈 BTCUSDT.P: Two Key Demand Zones
🟩 POLUSDT: Bullish Momentum
🌟 PENDLEUSDT.P: Where Opportunity Meets Precision
🔥 BTCUSDT.P: Liquidation of Highly Leveraged Longs
🌊 SOLUSDT.P: SOL's Dip - Your Opportunity
🐸 1000PEPEUSDT.P: Prime Bounce Zone Unlocked
🚀 ETHUSDT.P: Set to Explode - Don't Miss This Game Changer
🤖 IQUSDT: Smart Plan
⚡️ PONDUSDT: A Trade Not Taken Is Better Than a Losing One
💼 STMXUSDT: 2 Buying Areas
🐢 TURBOUSDT: Buy Zones and Buyer Presence
🌍 ICPUSDT.P: Massive Upside Potential | Check the Trade Update For Seeing Results
🟠 IDEXUSDT: Spot Buy Area | %26 Profit if You Trade with MSB
📌 USUALUSDT: Buyers Are Active + %70 Profit in Total
🌟 FORTHUSDT: Sniper Entry +%26 Reaction
🐳 QKCUSDT: Sniper Entry +%57 Reaction
📊 BTC.D: Retest of Key Area Highly Likely
📊 XNOUSDT %80 Reaction with a Simple Blue Box!
📊 BELUSDT Amazing %120 Reaction!
I stopped adding to the list because it's kinda tiring to add 5-10 charts in every move but you can check my profile and see that it goes on..
BTC/USDT VOLUME, W TFIfBitcoin weekly timeframe volume with the 21 moving average
volume has been very low lately
these are usually areas where volume tends to rise
in short this looks like a bottom zone

TradeCityPro | Bitcoin Daily Analysis #66👋 Welcome to TradeCity Pro!
Let’s dive into the analysis of Bitcoin and major crypto indices. As usual, I’m going to review the New York futures session triggers for you in this analysis.
⌛️ 1-Hour Timeframe
Yesterday, the 85126 trigger was activated, but the price hasn’t started its move yet and is still ranging above this level. As I previously mentioned, this trigger is an early entry trigger, and the main trigger for a long position is the breakout of the 85550 level.
✔️ So if you haven’t opened a position on the early trigger, don’t worry, because the main trigger hasn’t been activated yet. If the price moves upward, you can still open a position on the breakout of this main trigger.
Therefore, our long position trigger for today is the 85550 level, and breaking this level could start a new bullish wave.
📊 Make sure to keep an eye on the volume. If the volume increases simultaneously with the price approaching 85550, it would be a positive sign for the bullish trend. Entry of RSI into the overbought zone is another confirmation that could bring bullish momentum.
🔽 For a short position, the main trigger is still the breakout of 83233. However, if you’re looking for an earlier entry, the breakout of 84363 is also suitable.
📚 Overall, be cautious today since it’s Saturday and most market participants are off, but considering that Bitcoin is near a key level, we might still see movement.
👑 BTC.D Analysis
Let’s move on to the Bitcoin dominance analysis. As you can see, dominance has undergone a corrective downward move and has reached the 63.76 level and found support there.
💫 If dominance holds at this support, the next key resistance overhead is 64.12, and breaking this level would initiate the next bullish leg for Bitcoin dominance.
💥 Breaking the 63.76 level would give a temporary confirmation of bearishness in dominance. The next support levels are 63.61 and 63.23.
📅 Total2 Analysis
Let’s move on to the Total2 analysis. Due to the bearish movement in Bitcoin dominance, this index has seen a bullish move and has broken the 954 level.
✨ If the price pulls back to this level and resumes upward movement, and if you already have an open position, you can hold it up to the 980 level. If you missed out, the next trigger would be the breakout of the previous high and confirmation through Dow Theory.
📉 The bearish confirmation for Total2 would be the breakdown of 954.
📅 USDT.D Analysis
Now let’s take a look at Tether dominance. Yesterday, the 5.48 level was broken, and the price is now heading toward the 5.39 support.
🧩 If the 5.39 level in Tether dominance is broken, I strongly recommend having an open position, because this is a very significant support level. Breaking it could start a new trend in the market.
❌ Disclaimer ❌
Trading futures is highly risky and dangerous. If you're not an expert, these triggers may not be suitable for you. You should first learn risk and capital management. You can also use the educational content from this channel.
Finally, these triggers reflect my personal opinions on price action, and the market may move completely against this analysis. So, do your own research before opening any position.

BTCUSDT – Critical Time Pivot Approaching🟡 A major convergence point is forming around April 19, 2025, 19:00 (Bahrain time) , where a long-term symmetrical triangle is set to be resolved. Price is coiling tightly near the apex, suggesting an imminent breakout or breakdown.
Watch volume and RSI closely — momentum is building. This could mark a decisive shift in BTC’s medium-term trend.
📌 Stay alert. The chart is speaking — and it’s almost time.
#Bitcoin #BTCUSDT #PriceAction #CryptoTrading #ChartAnalysis #BreakoutWatch

BITCOIN Smart Money SetupPrice reclaimed a key support zone with a bullish structure shift (CHoCH), followed by a strong rally into a premium resistance area. Volume confirms the push with increased participation. Multiple timeframes show bullish sentiment, and a potential continuation is in play unless rejection from the current resistance zone triggers a reversal. Watch for reaction and volume cues.

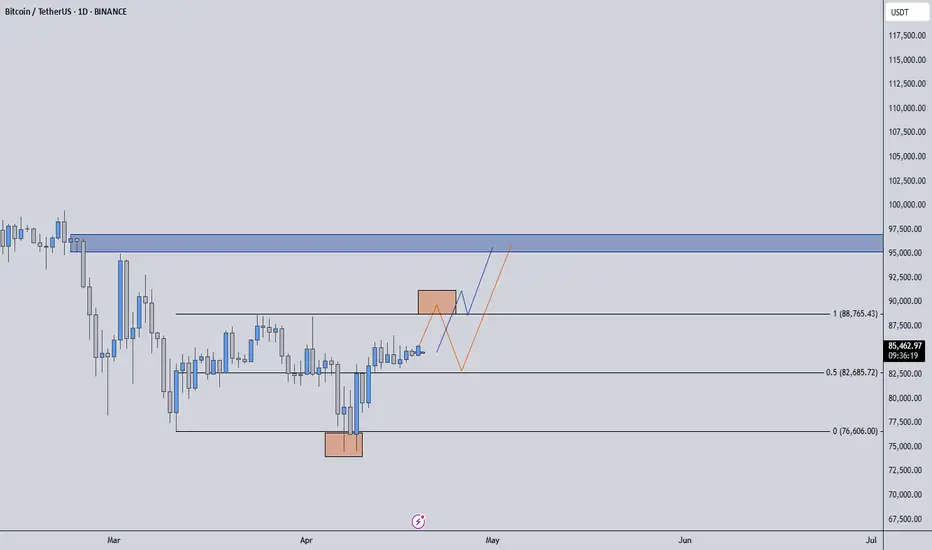
Still no progress for BitcoinHi traders,
Last week Bitcoin consolidated the whole week. The outlook is still the same.
Now we saw a 5 wave pattern up (which could be a leading diagonal wave 1) and a correction down. So we could see the next impulse wave after the finish of the correction.
Or we see one more impulse wave down and after that more upside.
Let's see what the market does and react.
Trade idea: Wait for the (corrective) move down to finish. After that you could trade longs.
If you want to learn more about trading FVG's with wave analysis, please make sure to follow me.
This shared post is only my point of view on what could be the next move in this pair based on my analysis.
Don't be emotional, just trade your plan!
Eduwave

BTCHello friends
We tried to make everything clear on the chart, I hope you like it.
Good luck.
*Trade safely with us*

BTC: Inverse Head & Shoulder Breakout (Time to go All-in) BTC Market Outlook (Multi Timeframe Analysis)
First of all, according to the higher timeframes (Weekly & Monthly), BTC is still in a bullish trend.
However, on the Daily timeframe, structure remains bearish — but we’re now seeing multiple bullish confluences building up:
Inverse Head & Shoulders breakout on Daily TF
Bearish Order Block has been broken, turning into a bullish breaker
On the Shorter Timeframe, we’ve got CHoCH (Change of Character) confirmation
Sell-side liquidity (SSL) has already been swept
All of these factors indicate that this could be a strong long opportunity, possibly the "mother of all buy setup.
Oh, and don’t forget to say thank you later. 😉 BYBIT:BTCUSDT

HelenP. I Bitcoin will drop, thereby breaking trend lineHi folks today I'm prepared for you Bitcoin analytics. Recently, price has been trading in a narrowing structure, forming a triangle pattern with a strong ascending trend line acting as support. This bullish line began developing after the price reversed from the 78500 - 79000 support zone, where buyers showed a clear reaction, initiating a sustained upward move. As the price kept bouncing along the trend line, it gradually climbed toward the upper boundary of the triangle. Eventually, Bitcoin reached the resistance area near 86500, which aligns with the broader resistance zone between 86500 and 87000 points. This zone has previously acted as a ceiling for price action, and once again, it triggered selling pressure. After the rejection from this area, the price corrected back to the trend line and is now hovering near it, testing its strength. Given the structure of the triangle, the repeated rejection from the resistance zone, and the current consolidation under resistance, I expect BTCUSDT to break below the trend line and decline. That's why I set my goal at 82000 points. If you like my analytics you may support me with your like/comment ❤️

BITCOINBitcoin's current liquidity constraints and recent 4-hour chart breakout reflect a tug-of-war between technical momentum and market mechanics. Here's a breakdown of key factors influencing BTC's trajectory:
Why BTC Lacks Liquidity Push
Exchange-Controlled Volatility: Market makers are suppressing rapid price surges to profit from liquidations, with Identified supplied zone as a "liquidity trap zone" where leveraged long positions were targeted. This artificial containment explains the muted liquidity-driven rally despite favorable macro conditions.
Delayed Fed Easing: The Federal Reserve's quantitative tightening persists, delaying a full liquidity injection cycle. While U.S. Treasury drawdowns added $510B since February 2025, Bitcoin’s correlation to liquidity peaks (projected at $6.5T by Q4) remains partial until Fed rate cuts materialize.
Risk-Off Sentiment: Geopolitical tensions and trade policy uncertainty have diverted some institutional capital to gold (recently surpassing $3,200/oz), temporarily capping Bitcoin’s haven appeal.
4-Hour Descending Trendline Breakout: Bullish Signals
Technical Validation: BTC broke above a descending resistance line that governed price action since December 2024,my confirmation will be by a strong close above $85400 on the daily chart. The 4-hour chart shows a bullish flag pattern, with higher lows suggesting accumulation.
Momentum Indicators: A bullish MACD crossover on the daily chart and rising RSI (4-hour) signal growing buying pressure, though the MACD histogram remains tentative.
Upswing Potential vs. Liquidity Risks
Bull Case:
A sustained break above $85,300 could trigger a rally toward $88,000–$92,000 this week, aligning with historical post-halving cycles and ETF inflow momentum.
Bernstein analysts project $150K–$200K by late 2025 if ETF inflows hit GETTEX:70B + and Fed easing accelerates.
Bear Risks:
Exchanges may continue suppressing rallies to harvest liquidity, risking pullbacks to $81K–$84K if $85K fails to hold as it prevented price upswing many times .
Delayed Fed rate cuts or renewed trade tensions could tighten financial conditions, stifling Bitcoin’s macro-driven upside.
Short-Term Outlook
The 4-hour trendline breakout favors a bullish bias, with April targets at FWB:88K – GETTEX:92K if BTC holds above $85K. However, liquidity constraints from market maker tactics and gold’s haven dominance may delay a sustained rally until broader macro catalysts (Fed policy shifts, debt ceiling resolution) emerge. Traders should watch for a daily close above $85,400 to confirm upward momentum where i lookt to target 90k and sell from that zone

BTCUSDT – System-Based Long Signal (3D Timeframe)
📅 April 19, 2025
Yesterday’s 3D candle closed with a clear PSAR flip, shifting from bearish to bullish — an early signal of potential trend reversal.
In addition, price is now trading above the 200 MA, which confirms a return into long-term bullish territory.
🟢 Based on these two system signals, we have a valid long entry setup forming.
However, the system is not fully aligned yet:
⚠️ MLR < BB Center < SMA
This suggests the internal momentum structure is still weak.
We are above 200MA and have a PSAR trigger, but the trend metrics aren't in full confluence.
📌 Strategy suggestion:
- Consider a partial spot entry only
- Avoid leverage until full confirmation
- Wait for MLR to flip above BB Center for added strength
This is a trigger-before-confirmation type of setup — and in such cases, discipline > excitement.

BTCUSDT potential for the next bull run!Trading Scenario: Bullish Breakout
Current Situation: BTCUSDT is currently trading around $85,300, near a resistance area indicated by the purple horizontal line. You've identified this as a key level. Below the current price, It's been marked a support zone (another purple horizontal line). You also have three potential take-profit levels (TP1, TP2, TP3) significantly higher, suggesting you anticipate a strong upward move if resistance is broken.
Entry:
Aggressive Entry: A potential entry could be considered upon a confirmed breakout above the current resistance level (around $86,000). A strong bullish candle closing above this level with good volume could signal the start of the upward momentum.
Conservative Entry: More conservative traders might wait for a retest of the broken resistance as new support before entering a long position. This reduces the risk of a false breakout.
Stop Loss:
A stop-loss order should be placed below the recent support level (around $84,000). This level acted as a floor previously, and a break below it might invalidate the bullish scenario. You could also consider placing it slightly below the entry point if you enter on a retest.
Take Profit Levels:
TP1: $88,500. This is your first target and a logical place to take partial profits or move your stop loss to breakeven to secure the initial gains.
TP2: $93,000. This is your second profit target, representing a more significant move upwards. Consider taking more profits at this level.
TP3: $99,000. This is your final and most ambitious target. It suggests you anticipate a strong and sustained bullish trend.

Bitcoin UP!A new Bitcoin ATH appearance is possible after saying Hello! to our green rising trend line from way back!
Btcusd H4 Technically ScenarioBtc is trading around 84k to 86k we are waiting btc to break the level of 80k and 82k then to enter for short in btc with a target of 1000 pips at least according torectangle pattern showing in btc market so let's wait for breakout then to enter stay safe stay smart trade with Albert And Happy Trading

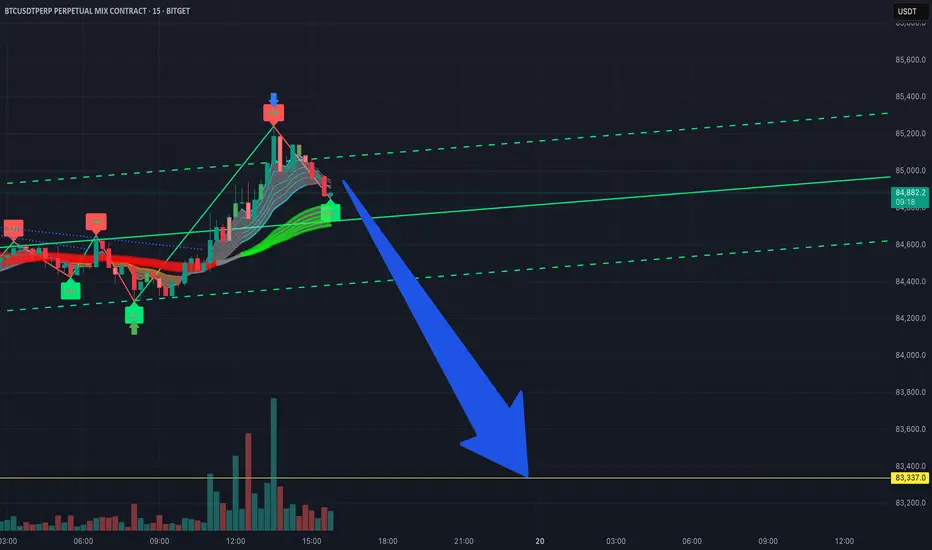
I’m estimating a short target for Bitcoin futures on the 15-minuLooking at the 15-minute chart on Bitget, I'm expecting a potential drop down to around 83,337. Just something to keep an eye on if you're in a short-term trade.
BTC Short TargetsBTCUSD has been in a range entire week and with losing upside momentum BTC can slide down easily over the weekend.
in downwards scenario 2 probable target zones are - 78k to 76.8k and 72.5k to71k

Bitcoin is currently trading around 85,269.35 USDT. Bitcoin is currently trading around 85,269.35 USDT.
Support Zone: A crucial support zone marked in green suggests strong buying interest between 80,000 and 81,000 USDT.
Resistance: The upper trend line indicates resistance; if Bitcoin can break it, it could target levels close to 88,000 USDT.
Bullish Case: A breakout above the upper trend line could lead to an upward rally towards 88,000 USDT or above.
Bearish Case: If the price breaks below the support zone, a downward move towards 75,000 USDT can be expected.
Monitor the trade closely to see how it reacts around these crucial levels. Adjust your strategy accordingly based on the price action. If you have further questions or need analysis on specific indicators, feel free to ask!
If you found this analysis helpful, hit the Like button and share your thoughts or questions in the comments below. Your feedback matters!
Thanks for your support!
DYOR. NFA

Btcusd signal Bitcoin price consolidates above $84,000 on Friday, a short-term support that has gained significance this week. The world's largest cryptocurrency by market capitalization continued to weather storms caused by US President Donald Trump's incessant trade war with China after pausing reciprocal tariffs for 90 days on April 9 for other countries.

Relationship between trendline and StochRSI
Hello, traders.
If you "Follow", you can always get new information quickly.
Please click "Boost".
Have a nice day today.
-------------------------------------
I think that everything used in chart analysis should be objective so that everyone can understand it.
If not, I think that if we start complaining about the different interpretations used in chart analysis, the essence may be damaged.
Therefore, I am trying to present a method that anyone can understand and draw in the same way.
In that sense, I have talked about the method of drawing trendlines several times.
Today, I will explain additional parts that were not covered in the previous drawing methods.
To set it like the StochRSI indicator on this chart,
- Source value: ohlc4
- Setting value: 14, 7, 3, 3 (RSI, Stoch, K, D)
You can set it like this.
-
A trend line is literally a line drawn to find out the trend.
It can also be used to predict how the current trend will change in the future.
However, since a trend line is drawn for chart analysis, what we need to draw importantly is the support and resistance points on the 1M, 1W, and 1D charts.
-
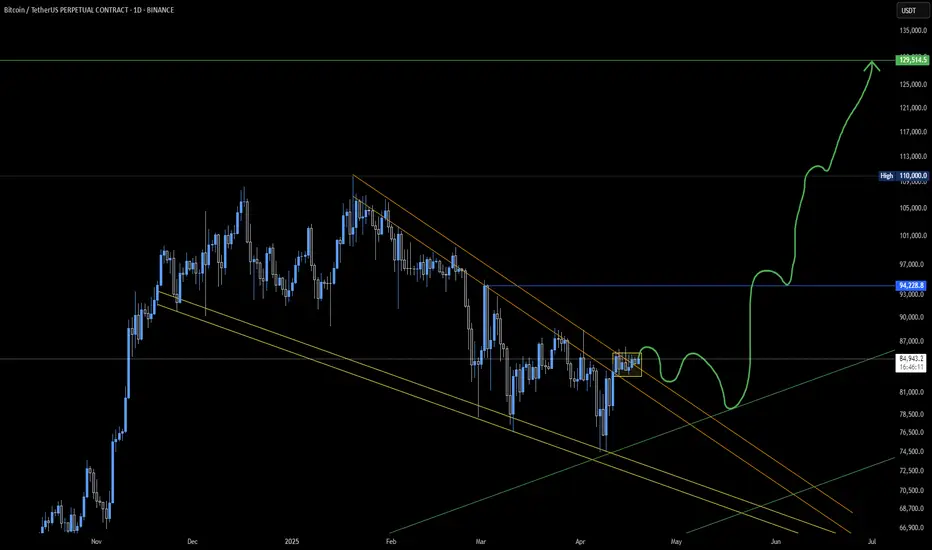
The trend line currently drawn is as follows.
Trend line (1): Trend line between lows drawn on 1W chart
Trend line (2), (6): Trend line between lows drawn on 1D chart
Trend line (3), (4): Trend line between highs drawn on 1D chart
Trend line (5): Trend line drawn on 1M chart
Therefore, in order to continue the uptrend in the medium to long term, the price should be maintained above trend line (1).
Similarly, in order to continue the uptrend in the long term, the price should be maintained above trend line (5).
-
The trend line is drawn by connecting the points between the highs or lows of the StochRSI indicator.
The StochRSI indicator creates waves in any case.
However, when creating waves, you should consider that the points necessary for drawing the trend line have been formed by touching the overbought and oversold areas and draw them.
Therefore, the points of the A and B sections of the StochRSI indicator are ambiguous points for drawing trend lines.
The solution to these points is the same as the trend line drawn above.
That is, the trend line is operated by connecting the points of the A section or the B section based on the last point created by touching the overbought or oversold section.
At this time, the important thing is that it must have escaped the overbought or oversold section.
The trend line (3) and trend line (4) drawn in this way form an expansion channel.
Therefore, once the decline begins, you can see that there is a possibility of a large decline.
However, as I mentioned earlier, the trend line was drawn to analyze the chart.
Therefore, you need to check the importance of the support and resistance points drawn in the area to see if it will actually lead to a decline.
Currently, the important support and resistance range from a short-term perspective is 76322.42-78595.86.
And, from a medium- to long-term perspective, the important support and resistance range is 69000-73499.86.
Therefore, even if it falls below trend line (4) and shows a large decline, it is expected that it will not be easy to touch trend line (3).
-
Trend line (2) and trend line (6) are trend lines drawn between low points on the 1D chart.
Therefore, even if it falls, it is highly likely that the area around trend line (6) will be the maximum.
In other words, even if the decline begins, it is highly likely that it will re-confirm the support around 76322.42-78595.86.
-
In any case, this volatility period ended without any significant movement.
The next volatility period is around April 25-29.
Since the StochRSI indicator is clearly showing a downward trend in the overbought zone, the key is whether there is support around 83423.84-84591.59.
If the price is maintained above the 1D chart, there is a high possibility of maintaining a short-term uptrend.
However, from a trading perspective, it should show support near the HA-Low indicator on the 1D chart to be a trading period.
Therefore, whether there is support near 89294.25 is important.
-
Therefore, we are troubled.
Should we buy when it is supported in the current zone, 83423.84-84591.59, or should we buy when it is supported near 89294.25?
If the StochRSI indicator rises above the 50 point, it is better to focus on finding a time to sell, and if it falls below the 50 point, it is better to focus on finding a time to buy.
If you look at the chart again with this information, you can decide that it is better to wait a little longer rather than proceed with the current transaction.
-
In the previous idea, I said that if it rises to around 89294.25, there will be a psychological feeling that it will rise further, and you will try to make a breakout trade.
At this time, what we should be interested in is whether the trend line between the lows and the trend line between the highs are formed in the same direction.
And, whether the StochRSI indicator shows an upward trend below the 50 point.
If it does not show such a movement, it is highly likely that it will shake up and down with a large fluctuation range.
Therefore, it is absolutely necessary to check whether it is supported near 89294.25.
Checking support and resistance is a tedious and difficult task.
Checking support and resistance requires checking the movement for at least 1-3 days.
-
The fact that the HA-Low indicator was created means that it rose from the low point range.
Since it has currently fallen below the HA-Low indicator, it can be interpreted that it has fallen back to the low point.
Therefore, in order for an uptrend to begin, the trading volume must increase when confirming support near the HA-Low indicator.
If the trading volume does not increase and it rises, it may not rise much and turn into a downtrend, so you should think about a countermeasure for this.
-
Thank you for reading to the end.
I hope you have a successful transaction.
--------------------------------------------------


BTC Box Range Low, long alternative daily path As a perp long im looking to take here; I shared a plan at the doji bullish OB if it loses the box range low, another shot for me is at 84K after a sweep, BTC is looking strong here, the daily pattern here is one I have backtested and presents more often in LTF, box range low can provide a good opportunity to long to the liquidity. Again, invalidation is tight and simple, watching out for Sunday as we are currently in sell off weekends, especially on Sundays

Time for again DIPThe level 85000-86000 seems so important level... Until market is not breaking it market is not going Bullish... Level of 70000-69000, which I've already quoted in my last idea, am still waiting for that to swip.... I'll be Bullish from that level, until market breaks 85-86 level.
