BTCUSDTI’ve cancelled this trade. The new setup will be the one I’m sharing now. 🔄📉
A potential short signal is forming on BTCUSDT. However, it's not ideal to open the sell position right now — we need to wait for the price to reach a specific level. Once it does, we can execute the trade.
So, what are the entry, TP, and SL levels for this setup?
If you’ve just started following me, let’s get started!
🔍 Criteria:
✔️ Timeframe: 15M
✔️ Risk-to-Reward Ratio: 1:1.50 / 2
✔️ Trade Direction: Sell
✔️ Entry Price: 95652.05
✔️ Take Profit: 95300.05
✔️ Stop Loss: 95827.73
🔔 Disclaimer: This is not financial advice. It's a trade I’m taking based on my own system, shared purely for educational purposes.
📌 If you're also interested in systematic and data-driven trading strategies:
💡 Don’t forget to follow the page and subscribe to stay updated on future analyses.
BTCUSDT.P trade ideas

BITCOIN BUY !!!Hello friends✌
As you can see in the picture, we have specified a purchase range for you to buy in stages, of course with capital and risk management.
🙏If you like it, support it with a ✔like✔ and ✔comment✔.
*Trade safely with us*

BTC/USD: Get Ready for another Bullrun ! (READ THE CAPTION)By analyzing the #Bitcoin chart on the weekly timeframe, we can see that the price is currently trading around $95,000. Soon, we should expect Bitcoin to enter the key supply zone between $99,500 and $109,500, where we’ll closely watch for the market's reaction.
Bitcoin continues to show strong demand, and we may witness another bullish spike in the short term. All previous assumptions from the last analysis remain valid.
Please support me with your likes and comments to motivate me to share more analysis with you and share your opinion about the possible trend of this chart with me !
Best Regards , Arman Shaban

Bitcoin - follow the trend until it breaks Bitcoin - follow the trend until it breaks
best Long is after Sl hunt of a range

TradeCityPro | Bitcoin Daily Analysis #73👋 Welcome to TradeCity Pro!
In this analysis, I want to give you a complete review of Bitcoin. There are just a few days left until the monthly candle closes, and it’s been a while since I analyzed higher timeframes for you, so it’s a good time to do that now.
📅 Monthly Timeframe
In the monthly timeframe, it’s very clear that Bitcoin has a long-term uptrend, which is still ongoing. The new leg of this trend started from the 16162 bottom and has so far extended to 104857.
⚡️ In the past few candles, the price has entered a phase of correction and consolidation, which is perfectly natural and necessary for the trend’s health. However, because this is happening on the monthly timeframe and takes months, some traders and market participants might think the uptrend has ended.
✔️ First of all, Bitcoin’s uptrend has not ended yet. We’ve just seen two red monthly candles, and now with this month's candle, bullish momentum is reentering the market. I believe the price can register a new all-time high (ATH). Even if that doesn’t happen, remember that Bitcoin’s dominance is very high, and this bullish cycle won’t last forever—eventually, Bitcoin dominance will start to fall.
🔍 If that happens and the percentage of money inside Bitcoin decreases, this capital will shift into altcoins. With this large inflow of capital, an altcoin season will begin.
📊 My personal view is that Bitcoin will have one more bullish leg toward 130,000 or 180,000, and after that, dominance will start to drop and the altcoin season will begin. Initially, Bitcoin will move upward, followed by strong, large-cap altcoins like Ethereum, BNB, XRP, etc. After these big players rally, capital will shift into good low-cap projects, leading to the crazy crypto pumps we've seen in previous bull runs.
🔽 This is the scenario I find most likely. But if the market moves against this scenario and dominance shifts earlier or later, I will adapt accordingly without being rigid in my analysis.
✨ As for Bitcoin turning bearish, I think that’s very unlikely for now, and the triggers for that are still far away from the current price. If that scenario becomes more probable, I’ll update my analysis and discuss it.
In short, for Bitcoin to turn bearish, it would need to make a lower high and a lower low compared to 104000, and if a sharp downtrend is to happen, the price must establish below 58000.
📅 Weekly Timeframe
In the weekly timeframe, we can see the bullish movement in more detail. A bullish move started from the 16162 bottom and after three bullish legs, the price reached the 104857 resistance.
💫 Currently, the price is in the correction phase of the third bullish leg and had pulled back close to the previous high of 71520. After forming a bullish engulfing candle, bullish momentum has returned, and the price is moving back toward 104857.
🎲 The 104857 area overlaps with the 0.618 Fibonacci Extension, creating a strong PRZ (Potential Reversal Zone). If this high breaks, the next resistance levels are the 0.786 and 1 Fibonacci levels, roughly around 125000 and 155000.
👀 There’s also a visible trendline in this timeframe that the price has touched three times, and each time the trendline bottom coincided with RSI support. However, the last time the price touched the trendline, it made a fakeout, which can be observed both on the price chart and on RSI.
⭐ This fakeout could inject even stronger bullish momentum and drive the price higher. But for this to happen, the current bullish leg must break above 104857—otherwise, the scenario fails, because if buyers truly have strength after a trendline breakout, they should be able to break the previous high.
☘️ If this doesn’t happen, it signals weakness, and the price could move back toward the 71000 support, with an increased probability of breaking it.
💥 In previous analyses, I also mentioned that during this bullish cycle, RSI has accurately indicated market bottoms each time it touched the 45.17 support level. This has happened again, and I hope you were able to benefit from it.
📅 Daily Timeframe
In the daily timeframe, as you can see, using the bullish leg up to 106247, we can draw a Fibonacci Retracement.
🔑 In the initial correction phase after reaching 106247, a box was formed between the 0.236 Fibonacci level and the 106247 top. After the 0.236 Fibonacci level, which overlapped with 90958, was broken, a deeper correction occurred down to the 0.5 Fibonacci level.
🔄 A descending trendline can also be drawn on the chart. As I mentioned in Bitcoin analysis #52, I advised spot buying upon the breakout of this trendline. I hope you were able to take full advantage of that opportunity.
📚 After the price reached the 0.5 Fibonacci level, a strong reaction occurred, and after activating the 87360 trigger, the price began a bullish move with strong buying volume and sharp candles, climbing back above 90958. If it holds above this level, it could move back toward the 106247 top.
💥 The RSI oscillator has increased significantly during this bullish move and is now near the Overbuy zone. If RSI enters the excitement zone, the likelihood of a sharp move toward the main resistance increases, and if RSI stabilizes above this zone, the probability of breaking the 106247 top will be very high.
📉 Currently, strong bullish momentum has entered the market, so we can expect a solid uptrend to continue. However, if the price falls back below 90958 before reaching the 106247 top, it would suggest that the entire bullish move was a fakeout, and bearish momentum could enter, pushing the price lower toward the 0.618 or even 0.786 Fibonacci levels.
⏳ 4-Hour Timeframe
Let’s check the 4-hour timeframe for futures triggers.
✔️ As you know from previous analyses, we had two main entry points for long positions at 85697 and 88289, and I hope you managed to open positions based on those.
💣 Currently, the price has reached the 95173 resistance and is being rejected. The RSI oscillator also shows a divergence, and if the 64.4 level breaks on RSI, temporary bullish momentum could fade.
🔼 In case of correction, the supports we currently have are at 92109 and 88289. For more levels, we’ll need to wait for a proper correction to use Fibonacci tools.
📈 For a long position, you can enter on the breakout of 95173. The next price target will be 98828.For a short position, we still need to wait for a proper trend reversal.
❌ Disclaimer ❌
Trading futures is highly risky and dangerous. If you're not an expert, these triggers may not be suitable for you. You should first learn risk and capital management. You can also use the educational content from this channel.
Finally, these triggers reflect my personal opinions on price action, and the market may move completely against this analysis. So, do your own research before opening any position.

BTC 2025.05.06🔔 Follow SEOVEREIGN to get real-time alerts.
🚀 Your boosts fuel SEOVEREIGN to analyze more assets.
📊 Our team regularly publishes in-depth crypto market analysis reports.
📉
Bitcoin is expected to show a short-term decline, making it a key moment to consider short positioning with a strategic approach. Based on our analysis, the following targets have been identified:
Target 1: 92,325
Target 2: 90,565
Target 3: 88,853
From a wave structure standpoint, the C wave appears to have completed at 1.272 times the length of the A wave. This presents a clear and reliable wave count, suggesting that the C wave has likely concluded. As a result, we may now be at the very beginning of a new wave cycle—potentially marking the start of a short-term downtrend.
While the move may be short-lived, this zone could offer solid opportunities for traders who approach it with precision. Instead of entering impulsively, focus on well-defined targets and strict risk management.
This strategy is built on technical grounds—emotions should be set aside in favor of structured, scenario-based execution.
Stay sharp, stay focused, and don’t let the market catch you off guard.


BTCUSDT Wishing everyone a great weekend! I'm considering opening a BTCUSDT trade. Although BTC tends to act “blind” over the weekend, I still plan to take advantage of the opportunity.**
🔍 Criteria:
✔️ Timeframe: 15M
✔️ Risk-to-Reward Ratio: 1:2
✔️ Trade Direction: Sell
✔️ Entry Price: 96061.32
✔️ Take Profit: 95810.45
✔️ Stop Loss: 96187.06
🔔 Disclaimer: This is not financial advice. It's a trade I’m taking based on my own system, shared purely for educational purposes.
📌 If you're also interested in systematic and data-driven trading strategies:
💡 Don’t forget to follow the page and subscribe to stay updated on future analyses.

BITCOIN CHARTBTC weekly chart exposed the demand and supply phase of the price movement and we quickly aligned with price movement until genuine buy confirmation is complete. The crypto tax gains is coming and regulatory inspection certain, as strict compliance from all brokers will be unavoidable.
4hrs makes it easy as one more break of demand floor will be a sell confirmation, don't rush yet.


Bitcoins Next Potential Bullish MoveBitcoin has exhibited a notable resurgence following a significant decline into the lower $70,000 range, where it encountered key structural support zones. This retracement catalyzed a pronounced rebound, signaling a potential shift in short-term market sentiment.
At present, price action has reclaimed the prior all-time high (ATH) range but has encountered resistance at the current Point of Control (POC)—the most heavily traded price area—indicating active participation from sellers. Sustaining the Value Area Low (VAL) in conjunction with the downtrend-anchored VWAP around the $93,000 level will be pivotal for confirming a full rotation back toward the upper bounds of the value area, near $102,000.
This upper region represents a significant liquidity cluster, where a potential bull trap or liquidation cascade could unfold as late entrants enter the market under the assumption that the corrective phase has concluded and a new impulsive leg is underway. However, this area also marks the apex of the value range, where a reaction is statistically more probable—much like the recent rejection seen at the POC.
Should Bitcoin successfully defend the VAL, a broader value area rotation would be expected before any renewed downside pressure. A subsequent pullback toward the previous value area high could then act as a confirmation of breakout support, validating the bullish structure.
Ideally, this scenario—characterized by respect for value area dynamics and rotational momentum—would align most cleanly with market structure and auction theory. As price oscillates between value zones, each range is sequentially validated as either support or resistance, providing a framework for interpreting market behavior with greater precision.

btc. SHORT to LONGwe saw a nice price rotation downwards, following the idea of NY giving up the SFP on tuesday and started looking for lower prices themselves.
SHORT entry running ASIA high at 2pm
entry . 95146
tp1 . 93453 . +1.78%
the 1h SUPPORT LEVEL of ASIA . 92902
held SUPPORT during that down price rotation.
LONG IDEA
see a rotation to dOpen / cw0.5 / value area Low / micro SFP / 2pm
entry . 94000
tp1 . 96.972
at 1 step extension of cw

BTC/USDT Analysis – Uncertainty is Growing
Hi everyone! This is CryptoRobotics’ trader-analyst with your daily market update.
Yesterday, Bitcoin reached our ~$94,300 zone (abnormal cluster) and almost immediately showed a buying reaction on the 1H timeframe, but the local high wasn’t retested.
Today, Bitcoin dropped more than 2% following the release of the U.S. GDP report, briefly piercing through the mentioned zone before quickly recovering the losses.
At this point, we estimate the chances of breaking out of the current range at 50/50 — uncertainty is growing, and a stronger correction toward the $91,000 area is becoming increasingly likely, either from current levels or after another test of the recent high.
Sell zones:
$97,500–$98,400 (aggressive pushing volume)
$107,000–$109,000 (volume anomalies)
Buy zones:
$91,500–$90,000 (strong buy-side imbalance)
$88,100–$87,000 (market sell absorption)
$85,500–$84,000 (accumulated volume)
$82,700–$81,400 (volume area)
Level at $74,800
$69,000–$60,600 (accumulated volume)
What do you think will come first — a breakout above the high or a correction?
Share your thoughts in the comments — it’ll be interesting to compare perspectives!
This publication does not constitute financial advice.

BTCUSDTLooks like BTCUSDT wants to make us smile again 🙂 A new opportunity for a Sell signal has emerged, and I’ll be taking advantage of it. However, don’t forget that in 35 minutes**, the *U.S. Services Purchasing Managers' Index (PMI)* data will be released — and that could cause some market volatility. I’m opening the trade with that in mind, so make sure you adjust your risk accordingly.
🔍 Criteria:
✔️ Timeframe: 15M
✔️ Risk-to-Reward Ratio: 1:1.60
✔️ Trade Direction: Sell
✔️ Entry Price: 94333.33
✔️ Take Profit: 93908.54
✔️ Stop Loss: 94598.39
🔔 Disclaimer: This is not financial advice. It's a trade I’m taking based on my own system, shared purely for educational purposes.
📌 If you're also interested in systematic and data-driven trading strategies:
💡 Don’t forget to follow the page and subscribe to stay updated on future analyses."

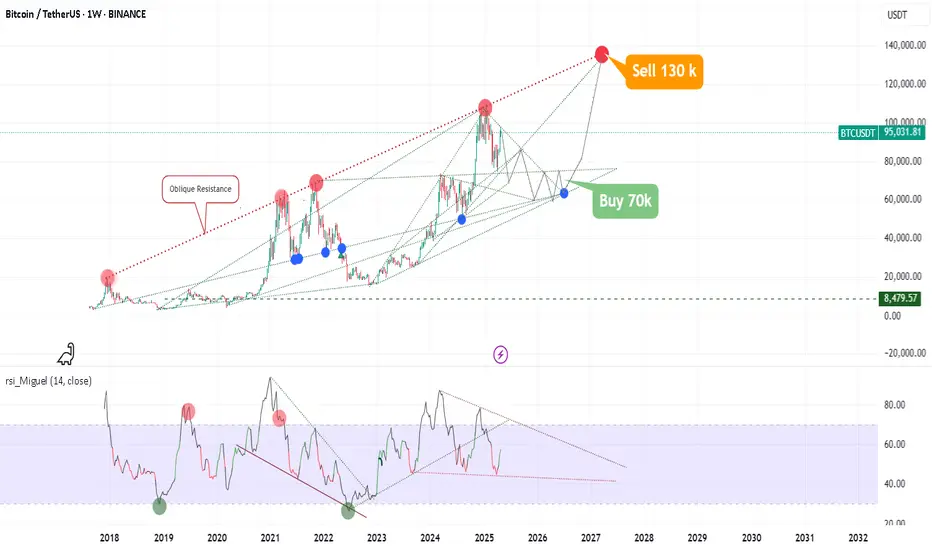
The worst-case scenario for Bitcoin📉 Potential Dip to $70,000 in 2026
Some analysts suggest that Bitcoin could experience a correction to around $70,000 in 2026. This potential downturn may be influenced by:
Market Cycles: Bitcoin's price has historically followed cyclical patterns, with periods of rapid growth followed by corrections.
Regulatory Changes: Shifts in global regulatory stances toward cryptocurrencies could impact investor sentiment and market dynamics.
Macroeconomic Factors: Economic events, such as changes in interest rates or geopolitical tensions, could influence risk appetite among investors.
It's important to note that while a dip to $70,000 is within the realm of possibility, other forecasts for 2026 are more optimistic. For instance, CoinCodex projects Bitcoin trading between $94,836 and $160,074 in 2026, with an average price of $119,743 .
🚀 Surge to Over $130,000 in 2027
Looking ahead to 2027, several factors could contribute to a significant increase in Bitcoin's price:
Institutional Adoption: Growing interest from institutional investors could drive demand.
Technological Advancements: Improvements in blockchain technology and scalability solutions may enhance Bitcoin's utility.
Global Economic Conditions: In times of economic uncertainty, Bitcoin is often viewed as a hedge against inflation.
Analysts have provided various projections for 2027:
Binance forecasts a price range between $140,491 and $216,738, with an average of $170,100 .
Bittime estimates an average price of $138,000, with potential highs up to $150,000
Analysis of the Price Trend of BitcoinAnalysis of the Bitcoin Price Trend: The upward trend is derived from the Weekly Moving Average Convergence Divergence (MACD) indicator. When the yellow and white lines of the MACD return to the zero axis and simultaneously touch the 52-period Exponential Moving Average (EMA52) line, there is a high probability that there will be no problem for the price to reach 100,000 (currency unit).

BTCUSDT Price Action Analysis with Bullish Breakout Target –Technical Analysis
Pattern Formation: A falling wedge was completed near the Support level around $92,910, triggering a sharp bullish breakout.
Breakout Confirmation: Price has broken out of the wedge with strong momentum, suggesting buying pressure.
Current Price: ~$97,045 at the time of analysis.
High Zone: $97,895 serves as an immediate price hurdle before retesting resistance.
🎯 Trade Setup
Entry: Around the current price levels ($97,000 zone).
Target: $98,813 – aligned with a significant resistance zone and Fibonacci target area.
Stop Loss: $94,375 – just below the previous swing low and wedge base, offering a good risk-to-reward ratio.
📌 Key Levels
Support: $92,910 (strong demand zone).
Resistance: $98,813–$98,855 (target zone).
Invalidation: Below $94,375 where the structure would break down.
🧠 Conclusion
This chart suggests a bullish continuation following a textbook falling wedge breakout. Traders may consider entering on pullbacks, with a well-defined stop loss and a clear target near the next resistance level.
Would you like help turning this into a ready-to-publish TradingView idea with tags and title suggestions?
You said:
please describe with more content
ChatGPT said:
Certainly! Here's a more detailed and professional TradingView idea description based on the chart you provided, expanding on the technical analysis, trade rationale, and market context:
📊 BTC/USDT – Bullish Breakout from Falling Wedge | Targeting $98.8K
[
Bitcoin has recently broken out of a well-defined falling wedge pattern on the 1-hour timeframe, signaling a potential bullish continuation toward the next resistance zone. This pattern, combined with a strong bounce from a key support level, sets the stage for a high-probability long setup.
🔍 Technical Breakdown
Falling Wedge Formation
Over the past few days, BTC/USDT consolidated in a falling wedge — a bullish reversal pattern characterized by converging trendlines and declining volume. This indicates weakening bearish momentum and the possibility of a breakout.
Support Rejection
Price found solid support around $92,910, a previously tested demand zone. This level has held multiple times and aligns with the lower boundary of the wedge. The recent strong bounce confirms bullish interest in this zone.
Breakout and Retest in Play
BTC has decisively broken above the wedge resistance line with an impulsive move, showing strong buyer commitment. Price is now consolidating slightly above the breakout zone, suggesting a potential retest before continuation.
🧮 Trade Plan
Entry Zone: Current levels around $97,000 or on a minor dip toward the breakout retest zone.
Target Zone: $98,813–$98,855, which lies just below a broader resistance band and psychological round number ($99,000–$100,000). This is the projected move based on the measured wedge height.
Stop Loss: Below $94,375, offering a logical invalidation level beneath the wedge structure and local swing low.
Risk/Reward: Favorable R:R ratio of approximately 1:2 or better.
📈 Key Levels to Watch
Support: $92,910 – the base of the recent reversal.
High (Interim Hurdle): $97,895 – short-term resistance that price is currently testing.
Target Zone: $98,813–$98,855 – aligns with prior resistance and Fibonacci extension levels.
⚠️ Market Context & Caution [/b
Watch for confirmation of support holding above $96,000–$96,500 before adding to positions.
A failed retest or breakdown below $94,375 would invalidate the bullish structure and suggest reevaluation.
Monitor broader market sentiment and macroeconomic catalysts (e.g., interest rate news, stock market correlation) that could affect BTC’s momentum.
🧠 Summary
Bitcoin is showing signs of strength after completing a textbook bullish reversal pattern. With a clean breakout from the falling wedge, a well-defined stop, and a logical target near resistance, this setup offers an attractive long opportunity for swing traders and scalpers alike.
Trade with discipline, always manage risk, and never chase the market.
#Bitcoin #BTCUSDT #CryptoTrading #TechnicalAnalysis #Breakout #FallingWedge #TradingSetup #SupportResistance #PriceAction

Bitcoin Long Long from 94350$ region.
There is a npoc level at that region .
Also there is a gap at around 97.2k to be filled .
Target remain 97.2k.

BTC - SHORT TERM DIRECTIONSelling wick on the 12-hour candle confirms strong resistance around the $96K– GETTEX:97K zone.
We may see a short-term dip towards $95K–$94K, but it’s really nothing to worry about.
While BTC searches for support, altcoins are likely to take advantage of this consolidation phase and rally. I don’t expect BTC’s short-term movement to significantly impact altcoin performance. It would only become a major influence if Bitcoin were showing signs of a long-term bearish trend — which it’s not.
No concern here — just keeping you all informed on BTC’s price action, as always.

BTCUSDT Take ProfitThe BTCUSDT trade I shared a few hours ago closed in profit. Those who wanted could have set the TP at a 1:2 Risk-to-Reward Ratio as well. I entered the trade with a sniper entry. 🎯📈

Choosing the Right TimeframeHey traders and investors!
Selecting the right timeframe can reveal a clear picture of price movement. But don’t forget — the higher timeframe always has priority.
🔹 On the 12H, Bitcoin is in a sideways range.
The move from 78,500 to 95,000 could’ve been anticipated — a buyer Decision candle (IKC) formed at the lower boundary of the range gave a strong signal.
The boundaries of the range are marked with black lines on the chart.
What about now?
🔸 No signs of strong selling.
🔸 The last Decision candle (IKC) at the top of the range belongs to the buyer.
🔸 The buyer has already taken out its high.
📉 For shorts — we need seller strength, ideally with price moving below 91,660.
📈 Longs can be considered on lower timeframes, aiming for their local targets.
Not every timeframe gives clear context.
What timeframes do you use to analyze and find trade setups?
This analysis is based on the Initiative Analysis concept (IA).
Wishing you profitable trades!

Market overview
WHAT HAPPENED?
Last week, for bitcoin, we got an exit from the sideways trend in the upward direction, but the growth wasn’t significantly confirmed by volumes. The price reached the key resistance zone of $97,500–$98,400 (pushing volumes), from which we received a reaction.
Currently, BTC has adjusted to the buy zone of $95,000–$93,400 (accumulated volumes), the buyer's reaction is present.
WHAT WILL HAPPEN: OR NOT?
There is a high probability of a test of lower levels this week. This scenario is confirmed by the following factors:
• a steady delta advantage in the direction of sales, which prevents the development of a full-fledged upward movement;
• rather weak trading volumes;
• the wave structure, which has already called into question the current exit from the sideways trend, the price has returned to its framework.
We consider the development of the correction through one of the marked scenarios on the chart.
Sell Zones:
$96,100–$96,600 (local volume area)
Level $98,000
$107,000–$109,000 (volume anomalies)
Buy Zones:
$95,000–$93,400 (accumulated volumes)
$91,500–$90,000 (strong buying imbalance)
$88,100–$87,000 (absorption of market selling)
$85,500–$84,000 (accumulated volumes)
$82,700–$81,400 (volume area)
Level $74,800
$69,000–$60,600 (accumulated volumes)
IMPORTANT DATES
On macroeconomic developments this week:
• Monday, May 5, 13:45 (UTC) — publication of the index of business activity in the US services sector for April;
• Monday, May 5, 14:00 (UTC) — ISM Purchasing Managers' Index for the non-manufacturing sector of the United States for April;
• Wednesday, May 7, 18:00 (UTC) — publication of the FOMC statement and the US Federal Reserve interest rate decision;
• Wednesday, May 7, 18:30 (UTC) — FOMC press conference;
• Thursday, May 8, 11:00 (UTC) - announcement of the interest rate decision The Bank of England in May;
• Thursday, May 8, 12:00 (UTC) — publication of the inflation letter from the Bank of England;
• Thursday, May 8, 12:30 (UTC) — publication of the number of initial applications for unemployment benefits in the United States.
*This post is not a financial recommendation. Make decisions based on your own experience.
#analytics

BTC Long Setup - Manipulation Before AccumulationBTC has shown weakness in volume and retesting the ascending trendline. BTC should experience the pending retracement from the current levels, below will be my long entry:
Entry: 87727
Target: 100300
Stoploss: 82444
