Acceding Wedge BTC 3H - Price TargetsAscending wedge is typically a bearish reversal or continuation pattern.
Price is making higher lows but facing strong resistance around $95,500–$96,000.
Momentum (based on the Money Maker Indicator Baked by mr Pine) is diverging, suggesting weakening bullish strength.
Probability Breakdown
Breakdown: ~60–70% probability
Given the bearish divergence and volume stagnation, a downside move is more likely.
Breakout: ~30–40% probability
A squeeze and short liquidation could still push BTC through the top of the wedge, but needs strong volume confirmation.
Breakdown Targets
If BTC breaks below the wedge support (~$93,500 area):
1. Target 1: ~$91,500 – Previous local support.
2. Target 2: ~$89,000 – Measured move of wedge height.
3. Target 3 (max): ~$86,000 – Major support from the prior structure.
Breakout Targets
If BTC breaks above ~$95,800:
1. Target 1: ~$97,200 – Immediate resistance.
2. Target 2: ~$99,500 – Psychological and technical resistance.
3. Target 3 (max): ~$102,000 – Based on wedge height added to breakout point.
Volume & RSI/Momentum
Volume isn't confirming strength yet — needs a spike for valid breakout.
RSI/momentum indicators show bearish divergence, favoring breakdown.
BTCUSDT.P trade ideas

Bitcoin Bullish movementAccording this analysis Bitcoin seems Bullish Pattern Guys Forecast from Mr Martin Date 28 April 2025.
Bitcoin candles as Buy side use trading clearly in Buy side showing Bullish instant after Long moment the higher formed continue to Bullish Guys just sits strong Support 93,200 which previous should Price will Bullish
Key Levels
Support Level 93,200 / 90,200
Resistance Level 95,500 / 96,500
you may see more details in the chart. Ps Support with like and comments Thanks.

BTC Correction Likely Before ATHBTCUSDT technical analysis update
BTC price could drop to the GETTEX:89K –$91K range before moving higher. There's a CME futures gap at $90.7K, which may act like a magnet. BTC has strong support around $90K and may see a small pullback before reaching a new all-time high.

BTCUSDT forming a Bullish Flag patternBitcoin (BTCUSDT) is currently forming a classic bullish flag pattern on the daily chart, often regarded as a strong continuation setup in technical analysis. The breakout from the prior descending wedge has already provided strong bullish momentum, and now BTC is consolidating just below key resistance, signaling the next possible leg upward. With volume steadily increasing during this consolidation phase, this flag pattern holds significant potential for a breakout rally.
The price structure reflects healthy accumulation, where smart money seems to be stepping in before the anticipated surge. The flagpole leading up to the pattern shows strong bullish dominance, and the sideways flag structure suggests that Bitcoin is merely taking a breather before pushing higher. A confirmed breakout from the flag could target an upside of 20% to 30%+, aligning with the projected price move shown on the chart.
Fundamentally, Bitcoin continues to gain mainstream traction, and the broader crypto sentiment is turning positive again. The volume patterns and technical indicators reinforce the bullish outlook. Investors are showing renewed interest, especially as BTC holds above key psychological and structural levels, which adds confidence to the continuation narrative.
This setup is ideal for breakout traders and investors looking to capitalize on short to mid-term gains. If the bullish flag plays out as expected, BTC could make another significant move toward its all-time high zone.
✅ Show your support by hitting the like button and
✅ Leaving a comment below! (What is You opinion about this Coin)
Your feedback and engagement keep me inspired to share more insightful market analysis with you!

bit long Hello. In our previous analysis, we identified a support level for Bitcoin, which Bitcoin reached and reacted to, causing the market to rally (77,000 - 75,750). Today, I’m sharing my latest analysis with you. Currently, Bitcoin is battling resistance at 95,000. If this resistance is broken, the next resistance levels are 97,500, 100,000, and 106,500. Each time these levels are touched, Bitcoin could pull back to the previous supports. Ultimately, if 106,500 is broken, Bitcoin could move up to 125,000, followed by a correction and the support at 106,500 coming into play. If that support holds, prices could go higher than 125,000.

btc. SHORT to LONGwe saw a nice price rotation downwards, following the idea of NY giving up the SFP on tuesday and started looking for lower prices themselves.
SHORT entry running ASIA high at 2pm
entry . 95146
tp1 . 93453 . +1.78%
the 1h SUPPORT LEVEL of ASIA . 92902
held SUPPORT during that down price rotation.
LONG IDEA
see a rotation to dOpen / cw0.5 / value area Low / micro SFP / 2pm
entry . 94000
tp1 . 96.972
at 1 step extension of cw

BTCUSD SIGNAL Update (Read Caption)This chart presents a short (sell) setup on the BTCUSDT 1-hour timeframe. Here's a detailed analysis of what it's suggesting:
---
Chart Summary:
Instrument: Bitcoin / Tether (BTCUSDT)
Timeframe: 1 Hour (1h)
Trade Direction: Sell
Current Price Zone: Around $95,144
Stop-Loss: ~ $96,518 to $96,800 (depends on your risk level)
Take-Profit: ~ $92,633 to $92,622
---
Key Observations:
1. Ranging Market:
Price has been consolidating between ~$94,000 and ~$96,000.
Multiple rejection wicks near the upper range (~$95,500–$95,800), suggesting resistance.
2. Sell Bias Justification:
Price is near the top of the range, possibly forming a lower high.
If price fails to break higher, this setup could target the bottom of the range near $92,600.
The idea is to catch a rejection and drop from resistance.
3. Risk-Reward Ratio (RRR):
The RR looks good visually—approximately 1:2.6.
You’re risking around $1,300 to gain around $2,500 (approx).
4. Ideal Confirmation:
For higher probability, watch for a bearish engulfing candle or rejection wick on 15m–1h timeframe near current level.
Consider volume—if it drops off during the rise, selling pressure may resume.

Bitcoin Roadmap — April to June 2025Hey traders! 👋
Bitcoin’s currently hanging around $94,100, and it just broke out of a multi-month diagonal resistance with strong volume and a solid daily close above all the SMAs and EMAs—bullish reversal confirmed! 🔥
Here’s what I think might play out between now and June:
Phase 1: Rally Toward Higher High (Now → May 1st)
Target: ~$99,600 (key horizontal + trendline resistance)
BTC is making a strong parabolic move with increasing volume and RSI confirming strength.
Break above $96 K → quick push toward psychological resistance near $100 K.
Expect a local top (HH) to form around late April to May 1st.
Phase 2: Pullback & Higher Low (May → June 1st)
Target Zone: ~$83 K–$86 K (confluence of multiple support zones + volume shelf)
A healthy correction is expected after tagging the upper resistance.
Formation of a higher low (HL) will validate a long-term uptrend.
Time-based support appears aligned with early June, matching your HL arrow.
Phase 3: Trend Continuation (Post June 1st)
If BTC forms a higher low and maintains structure, the next move targets:
$105 K–$109 K (Fibonacci extension + ATH zone)
Break above $99.6 K would flip this into macro bull territory
Key Levels to Watch:
Resistance $99,600 Horizontal + trendline rejection
HL Zone $83 K–$86 K Fib & breakout base, HL formation
Support $79.4 K 0.5 Fib — invalidation if lost
Summary:
BTC is in the midst of a potential higher high formation, targeting ~$99.6K by early May. A correction is then likely, forming a higher low in the ~$83 K–$86 K range into early June, setting the stage for a macro breakout run.

BTC at a Critical Crossroad — Pump or Dump ?
📝 Caption: Bitcoin is facing a decisive moment!
📌 Price is stuck in a key holding zone.
📈 A break above could send us flying toward the $104K resistance.
📉 But failure to hold may trigger a sharp drop into the weekly FVG below $90K.
🔻 Optimal short entry if we break below the structure.
🚀 Or is this just a healthy retracement before continuation?
💬 What’s your bias — bull or bear?
📊 Let me know in the comments!
#BTC #Bitcoin #CryptoAnalysis #TradeWithMky #Altcoins #TechnicalAnalysis

BTC | Bitcoin CURRENT CANDLE | NEW ATH or 70kThe previous weekly candle seemed unable to make a higher high after retesting the support at 76K.
However, today's bullish impulse has suddenly shocked right through two resistance zones, with the price now trading just above 90k.
If we can successfully CLOSE the weekly candle above 91K, it's likely that BTC is in for a new ATH which would mean ETH will also reach a new ATH, and then altseason will commence 🥳
Watch the following and make sure you are prepared for ALTSEAON:
___________________
BINANCE:BTCUSDT

Strategic Short on Bitcoin — Textbook Pattern Broadening wedge structure identified. On 1HR timeframe. Price tapped the upper trendline and showed rejection.
Expecting a breakdown towards major support near 91,650 -$91250
Clean invalidation above wedge highs $96200
#BTC #Bitcoin #CryptoTrading #DayTrading #TechnicalAnalysis #BTCUSDT #PriceAction #TradingSetup #CryptoTrader #RiskReward

Lingrid | BTCUSD weekly BULLISH Closure Above KEY LevelsThe price perfectly fulfilled my last idea . It reached the target level. Last weekly candle closed bullish showing bulls stepped in, and previous week BINANCE:BTCUSDT closed above the last 6 week highs. The market completed the ABC movement, therefore the market is moving sideways around the 95,000 level. At this point we can see the pullback in the market since it's testing the previous week high and ABC completion. This pullback would give us the opportunity to go long from the support zone in expectation of continuation. Looking left on the daily chart, we can see the price kept rebounding from the support level around 90,000 from November and February, which shows the importance of this zone. If the price pulls back toward this key level, the chance of bouncing off is pretty high. This historical support combined with the recent bullish momentum creates a compelling case for potential upside continuation after the current retracement completes. My mid-term goal is resistance zone around 99600
Traders, if you liked this idea or if you have your own opinion about it, write in the comments. I will be glad 👩💻

$BTC squeeze in 15min chartBTC about to break this pattern in 15min tf.
This will bring us back to 97-98k Area.

BTC/USDT Analysis. The scenario remains unchanged
Over the past day, not much has changed for Bitcoin. We reached a local high, followed by a pullback.
Today, we're still trading within a relatively narrow range. The cumulative delta continues to decline (indicating a large amount of market selling), but it's not leading to any significant results. Volatility is also decreasing — all of this resembles preparation for an impulse, most likely to the upside.
At the moment, an abnormal cluster of market sells has appeared around ~$94,300, which was immediately absorbed by buyers. If the price returns to this level and we see a reaction from buyers, it could be a good opportunity to open a long position with a minimal stop. The target for this move would be the next sell zone.
Sell zones:
$95,000–$96,700 (accumulated volume)
$97,500–$98,400 (aggressive pushing volume)
$107,000–$109,000 (volume anomalies)
Buy zones:
~$94,300 (abnormal cluster)
$91,500–$90,000 (strong buy-side imbalance)
$88,100–$87,000 (market sell absorption)
$85,500–$84,000 (accumulated volume)
$82,700–$81,400 (volume zone)
Level at $74,800
$69,000–$60,600 (accumulated volume)

EYES ON THESE TWO HYSTORICAL TRENDLINESWe are at a crucial point, the price is touching a cross between two trend lines that have lasted for YEARS.
Decisive moment for BTC.
If it breaks to the upside we will fly.
For the moment I value a short position with SL just above the trend lines.
Good Luck

Bitcoin Repeating 2022 Structure? Same Setup, Same Outcome?Bitcoin’s current market structure is starting to mirror its 2022 setup—right before the big drop.
This chart shows a familiar pattern: a rally, a peak, first drop from the ATH, a bull trap… then the major second leg down.
If history repeats, CRYPTOCAP:BTC could be on the verge of another significant move.
Will it break the cycle this time—or follow the same path again?
📉 What do you think?
Share your take in the comments below.
Please support this idea with a LIKE👍 if you find it useful🥳
Happy Trading💰🥳🤗

BTCUSDTHere the an other idea regarding btc so we are in weekly mitigation we are taking rejection from this area but power of bearish mitigation getting weak day by day. My expectation as it is just we should a candlestick which is greean and big which have big volume would be great. Continue waiting. Let see!!

btc . month . outlookLONG worked out nicely, BUT there was no SFP liguidity grab at cw/cmHigh
- finished LONG trade with 10pm (+2h tz)
- price dropped below entry . out of LONG . looking for lower new entry
As we're just before a new monthly open, possibility for retrace during Month May enhances
- This would give a nice new SWING LONG entry
- As well as a nice SHORT entry to ride the rotation downwards
Tuesday gave up a couple of SUPPORT levels . got me to shift SHORT for wednesday
- scaling SHORT at fib + cw0.75
Invalidation:
Running stops at 92.750 and recovering above cw0.5

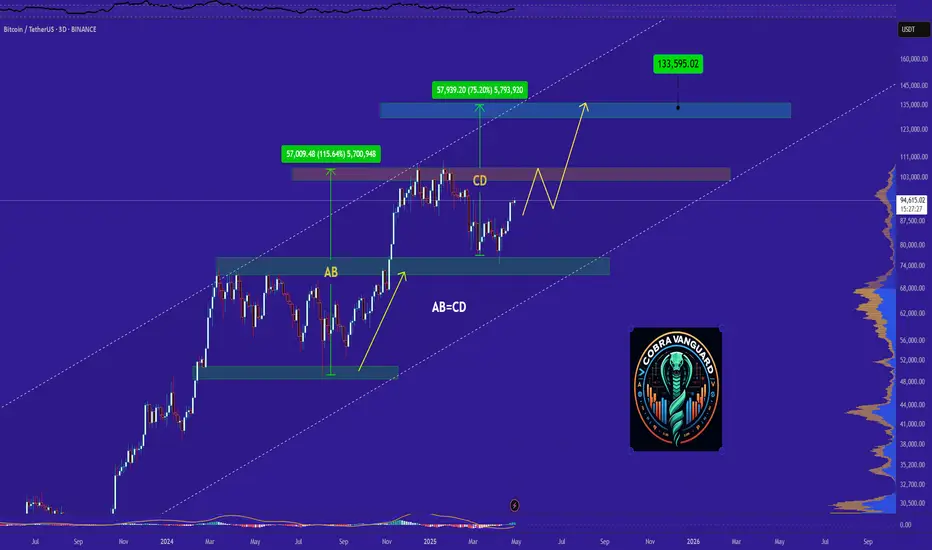
Do you think I'm joking ???I might be wrong and this might never happen, but it might come true From a technical perspective!!!
Give me some energy !!
✨We spend hours finding potential opportunities and writing useful ideas, we would be happy if you support us.
Best regards CobraVanguard.💚
_ _ _ _ __ _ _ _ _ _ _ _ _ _ _ _ _ _ _ _ _ _ _ _ _ _ _ _ _ _ _ _
✅Thank you, and for more ideas, hit ❤️Like❤️ and 🌟Follow🌟!
⚠️Things can change...
The markets are always changing and even with all these signals, the market changes tend to be strong and fast!!
BTC middle term Structural analysis, as I see it, we may have a brief pull back to the 86-79K area before resuming the bullish trend. I see very small risks to go back to the 73K area, of course, it is always a possibility. Everything depends on the FED's monetary policy.
DISCLAIMER.
Trade with caution. Make your own research and plan. I own several cryptocurrencies, including bitcoin. This is not a financial advice, it represents merely an opinion only.
Good luck!

To be one of the best in trading BTC - BTC HTF HL Hypothesis Price closed below the support-level on the 1D (red line) ----> price should come back to these lows.
Price closed above the resistance-level on the 1D (green line) ----> price should SFP the lows
-----------------------------------------
I expect (or should I say: hope?) price to do a MSB here, meaning: price coming below all that structure below the green level. This will provide a short setup to the dashed line where the TP and spot limit buy orders are 'rested'.
To be one of the best in trading BTC.

BTC long TermThe price of bitcoin is still moving inside a bearish parallel channel. Bitcoin is expected to record an all-time high once it breaks above this channel and the probable target is 126,500.

Bitcoin will continue to rise after the correction!Hello, traders
Still same senario, BTC need correction to rise more. Today btc just complete micro wave3 , 91k first target then 88k.
