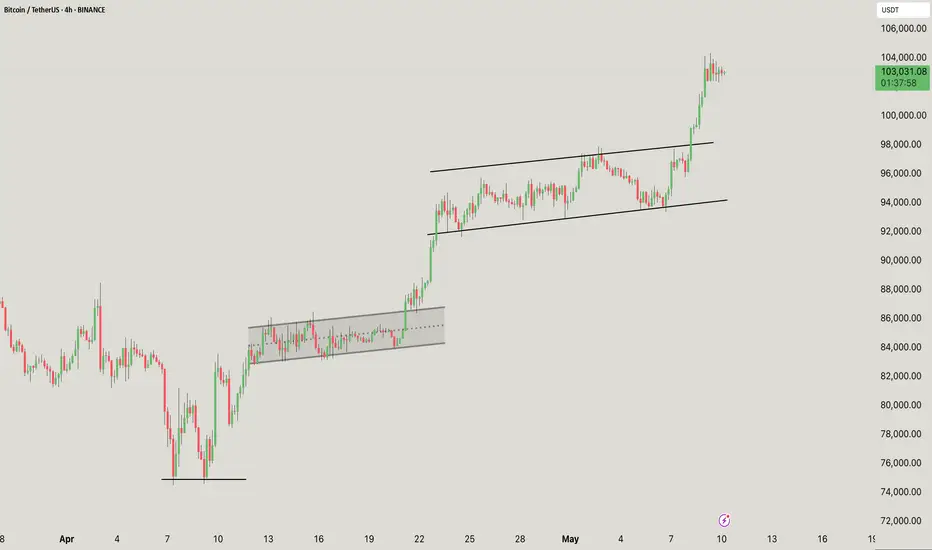
4H BTC Macro MovementsBTC found new life the last two days pushing up while leaving quite a bit of liquidity below as downward rocket fuel.
We have strong resistance at 104,800 zone above. We could get a pump candle wick to the upside and reject from there. It would bring in the heavy fomo and activate gravity below.
The mini range we are currently in (the flag) has nice value areas that have ping ponged us along this mini point of control prepping for continuation or a strong reversal. We cannot stay here much longer.
Nami indicator below us is showing RSI and momentum moving down while moneyflow is looking higher. Mixed signals can indicate manipulation. So while everyone screams for the moon, correction is the fuel to get there.
There is a nice previous week high + 27.9 breaker block around 98,000.
Not ever financial advice.
BTCUSDT.P trade ideas

Bitcoin Weekend Retracement 3%Weekend is the only time right now to be short, retail in on and insti are off! CRYPTOCAP:BTC big shorts can happen during weekends, once we dont have inflows and retails take loads of shorts positions. hashtag#Bitcoin hashtag#Short

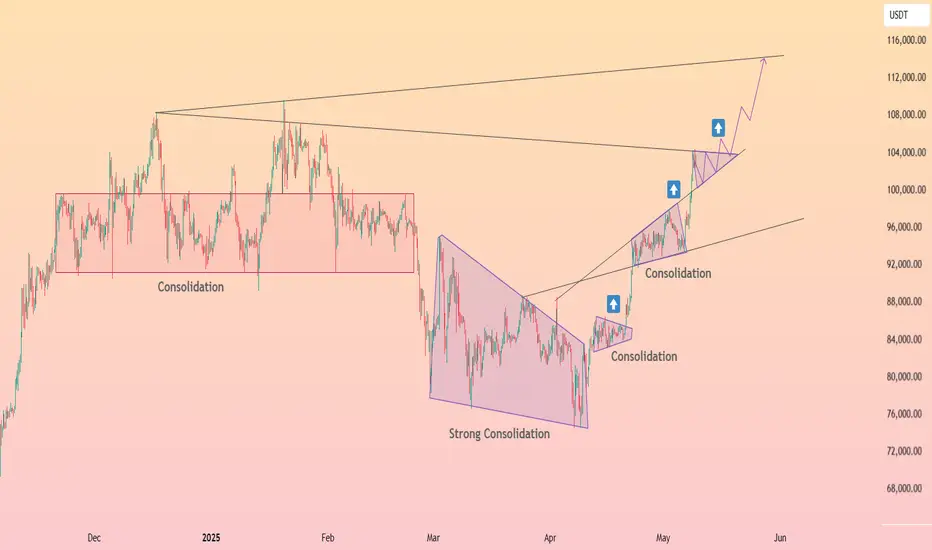
BTC/USDT Analysis – 4H Chart
This chart shows classic bullish continuation through ascending channels and consolidation breakouts:
A solid double-bottom structure was formed in early April
Marked the start of the uptrend
First consolidation box (~$90K–$93K)
Horizontal accumulation (highlighted gray box)
Resulted in a clean breakout and continuation
Rising channel (~$94K–$99K)
Rising Mid-trend consolidation wedge/channel
Price respected both trendlines
Eventually broke out to the upside → Strong momentum candle followed
Current Status (~$103K)
Price has broken above the rising channel
Now forming a new mini flag or consolidation at the top
Momentum is still in favor of the bulls
If you found this analysis helpful, hit the Like button and share your thoughts or questions in the comments below. Your feedback matters!
Thanks for your support!
DYOR. NFA
BTC - Upcoming bearish trendI think we are topping. Why?
The wave structure terminating the low is a 3 wave structure... or as it appears to me atleast.
For a trend to truly be a convincing reversal, we should be seeing a 5 wave structure indicating the end of the wave structure.
This is complex and the overall bullish sentiment makes me believe that we will top sooner or later.

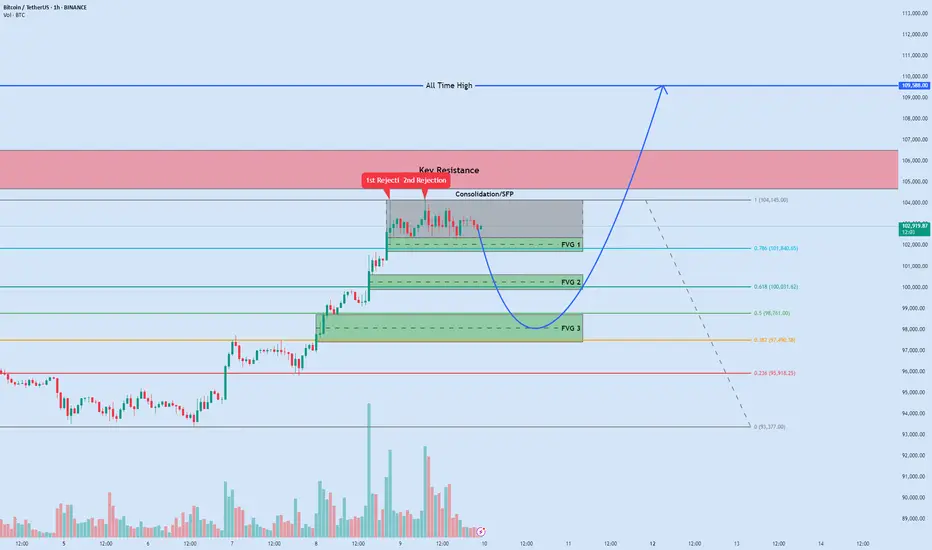
BTC: Potential Dip into FVGs Before New ATHBitcoin has rocketed from ~$94 000 to ~$103 250 in just days and is now consolidating between $102 364–$104 145. A Swing Failure Pattern at the top suggests a corrective pullback into one of three Fair Value Gaps aligned with key Fibonacci retracements, before the next leg up toward a fresh all-time high. This setup uses structure, inefficiency zones, and Fib levels to pinpoint high-probability entries.
📊 Chart Breakdown
1. Current Picture: Consolidation & Warning ⚠️
- Range: $102 364 – $104 145
- Swing Failure Pattern (SFP): Price briefly wicks above $104 145 to grab liquidity, then reverses. This classic liquidity hunt often precedes a deeper retrace as late bulls are stopped out.
2. Fair Value Gaps (FVGs) – Untested Support Zones 🌊
FVGs are rapid imbalance areas where price left gaps in the order book. These zones act like magnets, drawing price back to “fill” inefficiencies.
FVG 1 (Nearest): $101 700 – $102 364
FVG 2 (Mid-Zone): $99 900 – $100 600
FVG 3 (Deepest): $97 400 – $98 700
3. Fibonacci Confluences (from $93 377 → $104 145) 📏
Fibonacci retracement levels often align with FVGs to form confluence support—ideal for swing entries.
0.786 Fib @ $101 840.65: Sits squarely in FVG 1, a high-probability bounce zone.
0.618 Fib @ $100 031.62: Golden Ratio within FVG 2, offering strong support.
0.5 Fib @ $98 761 & 0.382 Fib @ $97 490.38: Cover top and mid-lower FVG 3 for a deep corrective entry.
📈📉 Navigating the Next Moves: Key Trade Scenarios 🧭
Given the current structure, with the SFP indicating a potential short-term top and strong FVG/Fibonacci confluences below, here are two primary scenarios we can watch for:
Scenario 1: The Short-Term Pullback Play (Short Position 📉🐻)
Concept: Capitalizing on the SFP at the consolidation high (~$104,145) to trade the anticipated dip towards the FVG/Fibonacci support clusters.
Aggressive Entry: Look for entries around $103,500 – $103,900 if price retests the upper part of the consolidation after the SFP, showing weakness.
Conservative Entry: A break below the consolidation low (~$102,364) could offer a confirmation entry, potentially on a retest of this broken level as resistance.
Stop-Loss 🛑: Place above the SFP high, e.g., $104,450 – $104,650, to protect against a false breakdown.
Profit Targets (FVG Zones) 🎯
TP1: The top of FVG 1 / 0.786 Fib area (~$102,300 – $101,840). This zone is critical.
TP2: The FVG 2 / 0.618 Fib area (~$100,600 – $100,030) if TP1 is breached with momentum.
Trade Management & Considerations 🤔:
Entry Confirmation: Watch for bearish price action on lower timeframes (e.g., 15m/1H rejection wicks, bearish engulfing) near the SFP high.
Profit Taking: Consider taking partial profits at TP1. The reaction here is crucial.
Reversal/Close Short: If price enters TP1 and shows strong bullish rejection (large wicks, engulfing bull candles, volume spike), close the short and prepare to flip to the long scenario.
Holding for TP2: If price slices through TP1 with sustained bearish pressure, trail your stop above TP1 once it’s clearly broken.
Invalidation: If price reclaims and holds above $104,650, the short thesis is invalidated.
Scenario 2: The FVG Rebound & Rally (Long Position 📈🐂)
Concept: Entering on the expectation that one of the FVG/Fibonacci confluence zones will hold as support, leading to a rebound and continuation of the larger uptrend.
Potential Entry Zones 📍:
Zone A (Primary): FVG 1 / 0.786 Fib area ($101,700 – $102,364, sweet spot ~$101,840).
Zone B (Secondary): FVG 2 / 0.618 Fib area ($99,900 – $100,600, sweet spot ~$100,030).
Stop-Loss 🛑:
If entering in Zone A: Place below FVG 1, e.g., $101,350 – $101,150.
If entering in Zone B: Place below FVG 2, e.g., $99,600 – $99,400.
Profit Targets 🎯:
TP1: Back to the consolidation high / SFP area (~$104,145).
TP2: The key resistance zone ($104,675 – $106,500).
TP3 (Ultimate): The All-Time High ($109,588).
Trade Management & Considerations 🤔:
Entry Confirmation: Do not blindly enter. Wait for price to enter your chosen FVG zone AND then show clear bullish confirmation on lower timeframes (e.g., 1H/4H bullish engulfing, hammer, RSI divergence).
Zone Prioritization: Zone A is the first test. If it fails and breaks down, Zone B becomes the next area of interest.
Profit Taking & Scaling Out: Take partial profits at TP1 and again at TP2 to secure gains.
Risk Reduction: After TP1 is hit, move your stop-loss to breakeven or slightly in profit.
Invalidation: A decisive break below $99,400 invalidates the bounce thesis and suggests a deeper correction.
🎯 Execution Notes
- Patience & Confirmation: Avoid “blind” entries. Seek volume confirmation and clear reversal candle patterns on 1H/4H charts.
- Risk Management: Define stops before entry and size positions to risk no more than 1–2% per trade.
- Additional Signals: Watch for bullish RSI/RSI-MFI divergences or a turn in on-balance volume at support zones.
Disclaimer: This is for educational/informational purposes only and not financial advice. Crypto trading carries high risk—always DYOR and consult a qualified advisor.
What’s your take? Which FVG/Fib level will hold? Share your insights below!
Bitcoin long Long setup for those who believe that btc breaks all time highs.
If Btc does what it is doing , she will not let you buy the dips , because dips will be pretty small.
I think 101500$ might be a nice area to place a long order followed by another one at 99k.
Let us see what this month will bring on the table.

#BTCUSDT. Is ready for a retest of 103.98 and higher.Structurally, over the next few days it looks like an attempt by the First Cryptocurrency to adjust its recent growth with a small correction into the zone of 92000-90200 - near these levels one can look for setups for buying.
Near these zones there may be an attempt to buy back at 103.98.
It looks promising, we are watching.

BTC - TO THE MOON?Just some basic things to look out for here:
- we are currently inside the last supply zone (imbalance, orderblock, bad highs). Just treat it as a zone but look for distributive PA. Obviously momentum is on the bull side, so be very picky with short entries. Idea is that the high holds just like the previous range between 50-75k.
- if that short/sell signal fails, getting on board on bullish ltf momentum above the bad highs is a good way to play some short squeeze or bigger impulse. Obviously gonna be a crowdy trade, so get in when other longs get stopped.
- Pullback into first support: the poc of the weekly range we just reclaimed. It was the first rejection after getting back in, so we assume some shorts are still trapped here and would like to get out. Again treat it as a zone, poc differ on each trading pair because the volume is different everywhere. Coinbase poc is a bit higher, perp poc like this a bit lower.

BTCUSDT: Safe Zone Vs Risk Zone, Which one would you choose? Dear Traders,
WE have possible buying opportunities, with the first entry, the only reason that we think that price would reverse is, possible end of year bullish push which may take price to another record higher high. Although, since the price already has rejected we think price is unlikely to reject at the level, and may drop to 75k region.
good luck.

HolderStat┆BTCUSD stairway to 115K?CRYPTOCAP:BTC after breaking the resistance trend line is preparing to rise to $115,000, before which another consolidation in the triangle may be waiting for it.
Fibonacci Extensions: Mapping Market Psychology Beyond the TrendHello, traders! 💫
Fibonacci numbers have traveled far from ancient Italian math to modern trading charts. In technical analysis, Fibonacci Extensions aren’t just mystical ratios; they’re a structured way to project potential price targets based on crowd psychology and trend continuation.
But what are they really, and why do so many traders draw those lines with near-religious fervor?
🧠 A Quick Historical Detour
Leonardo Fibonacci introduced the sequence to the West in the 13th century based on patterns he observed in Indian mathematics. The key idea is that each number in the sequence is the sum of the two before it: 1, 1, 2, 3, 5, 8, 13, 21...
When you divide specific numbers in the sequence, you get ratios that repeat throughout nature — and, intriguingly, financial markets. These include:
0.618 (the “golden ratio”)
1.618
2.618, and so on.
While Fibonacci Retracements look backward to gauge potential pullbacks, Fibonacci Extensions look forward to mapping possible continuation levels after a price move.
📊 Fibonacci Extensions
To use Fibonacci Extensions, you need three points:
The Start of a Trend (Point A)
The End of the Trend or Impulse Move (Point B)
A Retracement Low/High Where Price Bounces or Consolidates (Point C)
This ABC move applies Fibonacci ratios to project levels beyond point B, helping traders visualize where the price might go if the trend continues.
Common Extension Levels Include:
1.272
1.618 (golden ratio)
2.0
2.618
Each level acts as a kind of psychological milestone — not a guarantee, but a place where market participants may take profits, reassess, or react.
🔎 Let’s Take a Real Example: BTC/USDT Weekly
It's not that Fibonacci numbers have magical power. The theory is based on self-fulfilling behavior. When enough traders watch the same levels — and act on them — they can influence real outcomes.
The chart illustrates how Fibonacci retracement levels can be used to understand the depth and structure of a correction during a bullish cycle.
Low (~$4,783) in March 2020 (COVID-19 Сrash)
to the High (~$65,834) in November 2021 (Bull Market Peak)
From there, the price corrected throughout 2022–2023. Let’s look at what happened at each level — and what it tells us on the graph.
🔍 Why This Matters
Your retracement levels aren’t just lines — they mapped the psychology of the market:
Investors Testing Conviction at 0.5
Panic at 0.618
Capitulation Near 0.786 — but Without Full Breakdown
And Finally: A Rebound in 2023, Leading to New Highs in 2025
This kind of structure is textbook Fibonacci behavior — and is part of why retracement levels remain a core part of institutional technical analysis.
⚖️ Final Thought
Fibonacci Extensions are not about telling you where the price will go — they’re about framing where the price might go if the current trend keeps moving. It’s a lens through which to read market psychology, momentum, and expectation. Combined with volume, structure, and broader trend context, they potentially help analysts build a more nuanced market narrative.
And maybe Leonardo Fibonacci would have appreciated that his 800-year-old math is still trying to decode modern human emotion, just on candlestick charts.

BTCUSDT 13R Trade Breakdown: Deep Crab Pattern + SMC Precision Hello Traders!
If you enjoyed my previous post on combining Harmonic Patterns with Smart Money Concepts (SMC) for high-precision, high-risk-to-reward trades, then you're going to love this breakdown on BTCUSDT.
If you haven’t checked out my earlier content, make sure to scroll below this post and see that first—it sets the foundation for what we’re diving into here.
📈 BTCUSDT Trade Breakdown: Harmonic x SMC Precision Entry
This analysis was originally shared around three weeks ago on my YouTube channel, and if you were with me live, you’ll remember I was closely watching for a Bullish Deep Crab Pattern to complete before considering a LONG position.
Let’s walk through the setup and outcome step-by-step:
🕰 WEEKLY TIMEFRAME:
Price was reacting to a Weekly Fair Value Gap (FVG) and had filled the imbalance.
As shown in the chart:
🔍 SETUP: Strategy Confirmation
Important Reminder:
Just because price hits a key level doesn’t mean we jump in to buy or sell.
✅ There must be a confirmed Harmonic Pattern that aligns with the key SMC level.
On the Daily Chart, we identified a valid Bullish Deep Crab Pattern:
B-point at 0.886
PRZ (Potential Reversal Zone) at 1.618 FIB Extension
This PRZ aligned perfectly with the key level identified on the Weekly chart.
🎯 ENTRY STRATEGY (15-Minute Chart):
We zoomed into the 15M chart for an SMC-based entry.
Supply-to-demand flip confirmed with a visible liquidity inducement—textbook confirmation.
Entry was just a few pips below the recent swing low to limit downside risk in case of invalidation.
Take Profits (TPs) were set using standard Deep Crab targets, based on FIB retracements from A to D:
✅ TP1 at 0.382
✅ TP2 at 0.618
✅ TP3 at 0.786
✅ TRADE OUTCOME:
Entry was cleanly triggered and the price followed through as expected.
All three profit levels were successfully hit:
✅ TP1
✅ TP2
✅ TP3
We secured an impressive 13R on this single BTCUSDT trade —a solid example of what happens when Harmonics and Smart Money Concepts are aligned.
💬 Your Turn:
Did you take this BTC trade using a different strategy?
Or did you spot the pattern and enter alongside me?
Drop your thoughts and experiences below this analysis—let’s learn together!

Stromm | BITCOIN Are You BULLISH Enough? When you zoom out to the 12-hour chart , Bitcoin actually looks really clean right now. Since my entry at $75,800, we’ve seen a solid 25% rally that’s clearly shifted the momentum back to bullish. -
But even with that move, I’m not fully convinced yet that we’re on our way straight to a new all-time high.
There’s still a lot of work to be done before that happens.
Right now, I’m watching the zone between $96,400 and $102,300 as a potential reaction area — basically a spot where we could see Wave B complete.
We’re hovering around the Yearly Open, which historically acts as both strong support and resistance, and we’re also right at the Previous Monthly High.
If BTC can hold this zone, we absolutely could push higher toward $102K.
However, I don’t think it’s realistic yet to expect a clean shot to $110K without a deeper pullback first.
Most likely, we’ll need another flush lower to reset before any major breakout.
That said, I’m still long and staying patient.
If we do somehow rip toward $120K, I’m already well-positioned.
And if we get another sell-off?
I’ll be adding even more — no hesitation there.
Of course, a lot of this depends on how the political and macro situation evolves.
There’s definitely a world where the perfect narrative gets laid down, and we rocket to $120K.
But there’s also a world where that doesn't happen — and it’s important to stay mentally flexible between "must happen," "could happen," and "might not happen at all."

Bitcoin UpdatePrice has been increased sharply from the introduced Demand area.
Now there is an important Support level which has marked on the chart.
It mays again re act there.

Later, Bitcoin!Bitcoin remains in a long-term bullish trend, but it currently appears significantly overvalued relative to gold. The recent breakout, followed by a re-test of the upsloping wedge formation, suggests that bullish momentum may be waning. This could indicate that capital is beginning to rotate out of Bitcoin. As a result, it may be more prudent to revisit the market in one to two years ahead. This shift may also mark the beginning of a potential altcoin season.


Dreams do come true!!!!Higher highs mega euphoria! For the ultimate double bottom/head and shoulder formation we all wanted.Remember to take profits guys

Btc alien technologyHello guys i was spot on before and i will continue be spot on 140k-160k FLUSH TO 40-42k maybe wick 38.5k
Thanks retail Waits for 20-30k and not happening Bye ✋
Then load up cause NeXT leg Will be historICAL
ADAPT OR DIE
CRYPTO IS THE FUTURE CURRENCY.
AI IS FUTURE TECHNOLOGY
WEB3 IS EXPANDING.

BTC Fractal Update!!CRYPTOCAP:BTC is repeating the same ABC pattern that led to past 70 %+ rallies.
We're now at a decision point — next weekly close will confirm:
Scenario 1: Rejection Below $96K (Circle 1)
→ Likely dip to $78K–$80.5K (channel bottom + 0.5 Fib)
→ Final shakeout before major move.
Scenario 2: Breakout Above $96K (Circle 2)
→ Retest at $90.5K
→ Then rally toward $160K+ begins (Circle 3)
BTC is hovering near the $100K mark — up 5% from the $96K breakout — mirroring the previous breakout from $63K (Circle 2), where it surged to $ 67K (+5%) before a sharp retest to $59.2K, followed by a major rally.
A similar healthy retest could be on the cards before CRYPTOCAP:BTC breaks its ATH!
If you find this analysis helpful, please hit the like button to support my content! Share your thoughts in the comments, and feel free to request any specific chart analysis you’d like to see.
Happy Trading!!

BTC "Second Phase Pump"convincingly on the higher timeframes, signaling a strong initial bullish impulse
.
This retrace isn't a sign of weakness, but rather a healthy consolidation before the next significant leg up.
"Second Phase Pump"

$Bitcoin approaching ATHBitcoin approaching ATH 👀
CRYPTOCAP:BTC breaks out of a multi-month descending triangle and flips key resistance into support.
Now pushing toward the $110K zone, a consolidation range is expected just below the all-time high.
Momentum looks strong.
ATH, retest soon?

BTC "Second Phase Pump"convincingly on the higher timeframes, signaling a strong initial bullish impulse
.
This retrace isn't a sign of weakness, but rather a healthy consolidation before the next significant leg up.
"Second Phase Pump"

BTCUSDT Breakout –8 May- Eyes on $106K NextIdea:
Bitcoin has broken out of a prolonged accumulation range with strong bullish confirmation across multiple timeframes. The price has reclaimed structure above GETTEX:98K and is pushing higher within a rising channel. This sets the stage for a potential move towards the $106K–$110K zone.
Why:
Confirmed Break of Structure (BOS) and Change of Character (CHoCH) on 4H and 1D charts.
Price broke out of the previous resistance zone and is holding above the POC near $98K.
RSI is trending above 70 – showing strength, not exhaustion.
ADX and DMI indicate a strong bullish trend – buyers (blue) are firmly in control.
MACD histogram turning green again – supporting upside continuation.
Volume is increasing, confirming genuine momentum behind the move.
How to Trade:
Entry: Buy on retest near GETTEX:98K –$99K.
Target: $106K (first target), $110K (channel top).
Stop-loss: Below $96K (invalidates the bullish structure).
Risk Tip: Use proper position sizing – breakout trades can be volatile. Protect capital, let profits run.
