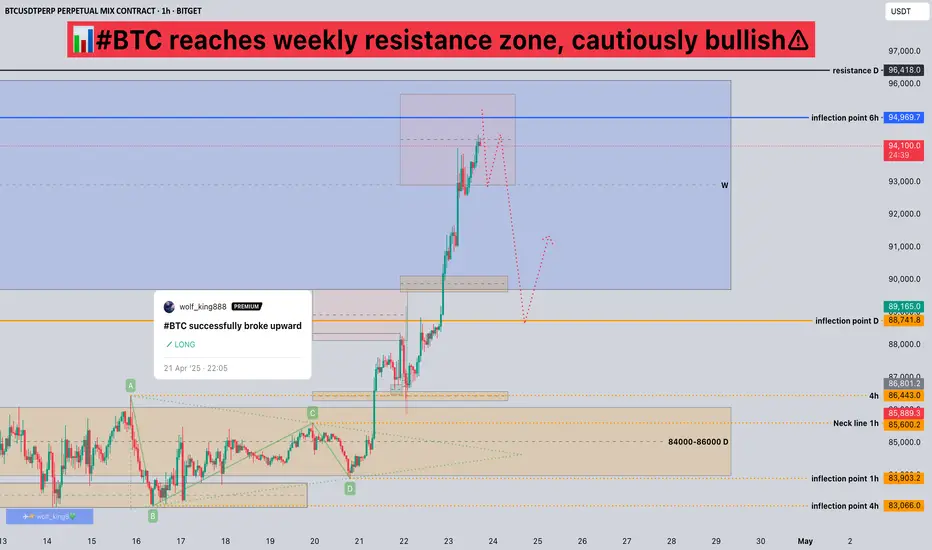
#BTC reaches weekly resistance zone, cautiously bullish📊#BTC reaches weekly resistance zone, cautiously bullish⚠️
🧠From a structural point of view, after we broke through the resistance zone at the daily level, the resistance zone turned into a support zone, so after the price fell back to this support zone, I participated in some long trades. The interim target is around 90,000, so I chose to close all positions after reaching here.
➡️In general, my mind is still in the shock trading, so I don’t look forward to the goal too far. Because we haven’t built a long structure at the daily level, we still need to be vigilant.
➡️Currently we have reached the resistance zone at the weekly level, don’t chase the rise here. We can look for some short signals in this area to participate.
⚠️Note that the large level belongs to the long trend, the correction at the daily level is over, and it is possible to start the upward trend at the daily level. Try to focus on long trades.
Let’s take a look👀
🤜If you like my analysis, please like💖 and share💬
BITGET:BTCUSDT.P
BTCUSDT.P trade ideas
BTC is Still A Correction.BTC is in good rally these days, but my believe is that it is still in a correction.
I am not 100% confident in wavecount, but I am confident that BTC is not done correcting until it has gone down to somewhere between 62.500 - 52.500.
If the rally BTC is currently in, I believe we are seeing a flat, and I will correct my count accordingly.. But right now I'm seeing a W-X-Y-X-Z correction.
Be careful, and do not bet on BTC is rallying to a million just yet ;)
For now I believe there will be good odds for following the white line I've drawn on the chart.

BTC Retrace or Rally? Bitcoin’s Liquidity Hunt & Next Move.Bitcoin BTC Analysis & Trade Idea
🚦 Market Context & Price Action
Bitcoin has experienced a sharp rally, pushing into previous weekly and daily highs. This area is a classic liquidity pool, where buy stops from breakout traders and late longs are likely accumulating. The current price action is overextended, suggesting that the market may be primed for a retracement as smart money seeks to capture liquidity before the next directional move.
💧 Liquidity Pools & Wyckoff Concepts
According to Wyckoff methodology, this phase resembles a "Buying Climax" (BC) where price surges into resistance, often followed by an "Automatic Reaction" (AR) and a potential "Secondary Test" (ST). The current rally into old highs is likely triggering buy stops, providing institutional players with ample liquidity to offload positions or engineer a shakeout.
🟢 Wyckoff Schematic:
Buying Climax (BC) at current highs
Anticipated Automatic Reaction (AR) as price retraces
Look for a range to develop (potential Accumulation phase) near the 50% Fibonacci retracement
📉 Fibonacci Retracement & Trade Setup
You’re eyeing the 50% retracement of the previous price range as a key level. This aligns with both technical and Wyckoff logic, as it’s a common area for price to find support after a liquidity grab.
🟢 Trade Plan:
Wait for a retrace to the 50% Fibonacci level
Observe for a range or consolidation (signs of absorption/accumulation)
Look for a bullish break of market structure (BOS) as confirmation
Enter long on confirmation, with stops below the range low
🌐 Fundamentals & Market Sentiment
Currently, Bitcoin sentiment is mixed but leaning bullish due to recent ETF inflows, institutional adoption, and macroeconomic uncertainty (e.g., inflation, rate cut expectations). However, funding rates are elevated, and open interest is high, indicating potential for a shakeout as overleveraged longs are vulnerable.
🟢 Key Fundamentals:
ETF inflows and institutional interest remain strong
Macro uncertainty (Fed policy, inflation) supports long-term bullishness
Short-term: Overheated sentiment and high leverage could trigger a corrective move
🧠 Sentiment & Risk Management
Social media and crypto news outlets are buzzing with bullish narratives, but this euphoria often precedes a correction. Be patient and disciplined—wait for the retrace and confirmation before entering.
🟢 Risk Management:
Only enter after clear accumulation and bullish BOS
Use tight stops below the range
Consider scaling in if the range develops with clear absorption
📈 Trade Idea Summary
Wait for a retrace to the 50% Fibonacci level of the recent rally
Look for Wyckoff-style accumulation and a bullish break of structure
Enter long on confirmation, targeting new highs or the top of the previous range
Manage risk with stops below the accumulation range
Not financial advice!

BTC Bullish IdeaThe Fractal from the 2020 bull run looks very similar to the current bullish fractal BTC is in at the moment.
Also looking at the RSI on high time frame (3 day chart) we can see a clear pattern. 3waves descending on the RSI, before a breakout to the upside on 7th Sep. Same pattern on the market cipher B indicator.
Expectation is that there is an imminent breakout soon (day, or weeks) as pressure keeps building, the release will be explosive.

BTC macro flag bullish ScenarioBTC has completed 2.5 waves in the current flag.
The 0.5 bounced on the midchannel of the flag and we're currently seeing a push towards the top of the channel. breaking through here, if could btc flips resistance into support we could see it springboard from here.

BTC post halving scenariobased on previous halvings, expecting price to come down a bit and accumulate before starting the climb up.
Fib trend gives me 2 significant targets for highs: Mid Jan 2025 and mid Jan 2026.
I've mapped out potential fib targets based on standard fib extension targets.
i.e. 2.272 - 2.786.
However saying this, fib extensions from low to halving project different targets for a bullrun.
previous bullruns have reached fib extensions of between 8-9.
I'll add another chart in the comments showing this.

BTCUSDT – Structure Rebuild or Breakdown? My Neutral Bias Until Description:
On the 15-minute BTCUSDT chart, I’m currently directionally neutral—I need the market to tip its hand before engaging.
94,722.9 USDT – If bulls attempt another breakout, demand must punch through this level. No passivity here—if buyers show up strong, I’ll look for confirmation to join a bullish continuation.
91,631.5 USDT – This is my bull/bear S/R inflection level. If the market slides back into this zone, I’m watching for bearish momentum to reclaim dominance.
Current stance: Structure is rebuilding for a potential long breakout, but I am aggressively watching for proof—no chasing shadows. Until I get a clear reaction at either of these levels, I remain flat, patient, sniper-focused.
The trap zones are set. This is a textbook wait-and-react environment. No bias, no emotion—clarity comes from structure + liquidity + reaction.

BTCUSDT 1W AnalysisBTC ~ 1W Analysis
#BTC It is necessary to wait until this pattern is successfully broken to confirm a sustained bullish trend.

BTCUSDT BEARISH TRENDBearish Trend on BTC/USDT
The BTC/USDT pair is showing bearish momentum as price struggles to hold key support levels. Recent price action suggests lower highs and lower lows, indicating seller dominance.

Bitcoin Pullback or Opportunity📊 Bitcoin Analysis – Pullback or Opportunity?
CRYPTOCAP:BTC hit strong resistance at 94,000 $ failed to push higher, entering a correction phase 📉. Key support zones now lie at 91,200 $ 87,500 $ , both of which have shown solid reactions in the past 🛡️. If price holds one of these levels, the next target could be around 98,500 $based on the previous move’s momentum 🚀.
📌 Price is still holding above the 200 MA, suggesting bullish momentum is alive but needs further confirmation ✅.
👇 What’s your take on the next move?
🔁 Save this if you're watching the next targets
📩 Share with a friend who's trading BTC right now

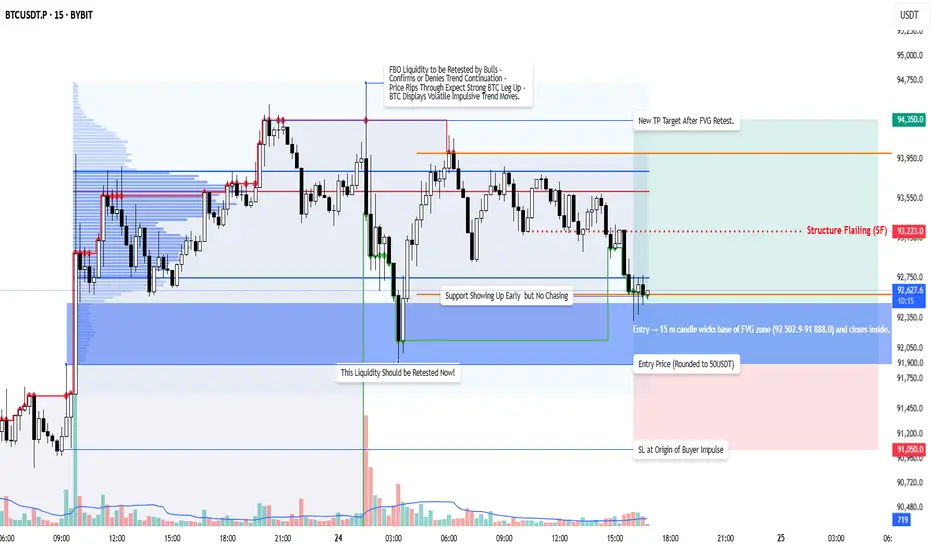
Long the Filled FVG Zone (92 502.9–91 888.0) on BTCUSDTDescription
On the 15-minute chart, BTCUSDT remains in a broader up-trend but has paused to digest a fair-value gap between 92 502.9 and 91 888.0. This precise imbalance, aligned with a prior swing-low demand zone, offers a low-risk long opportunity anchored in structural and liquidity confluence.
Entry
Place a limit buy at 91 900 once any 15 m candle wicks the base of the FVG zone (92 502.9–91 888.0) and closes inside.
Stop-Loss
Invalidate this long on a close below 91 050, the origin of the buyer impulse.
Take-Profit
Target 94 350 for an asymmetric R : R of 2.88 : 1.
Failed-Breakout Orderblock
Watch for a retest of the liquidity printed at the failed-breakout orderblock (~93 223) to confirm bullish continuation.
Structure-Flip Level
Resistance turned support at 93 223 offers interim validation en route to the target.
Risk & Reward
This setup risks 8 500 ticks (91 900–91 050) to capture 24 500 ticks (94 350–91 900), yielding R : R ≈ 2.88 : 1.
Execution Notes
Confirm entry with a lower-timeframe bullish orderflow shift before sizing in.
Maintain strict position sizing—risk only a defined percentage of your account per trade.
Importance of HA-Low, HA-High indicators
Hello, traders.
If you "Follow", you can always get new information quickly.
Please click "Boost" as well.
Have a nice day today.
-------------------------------------
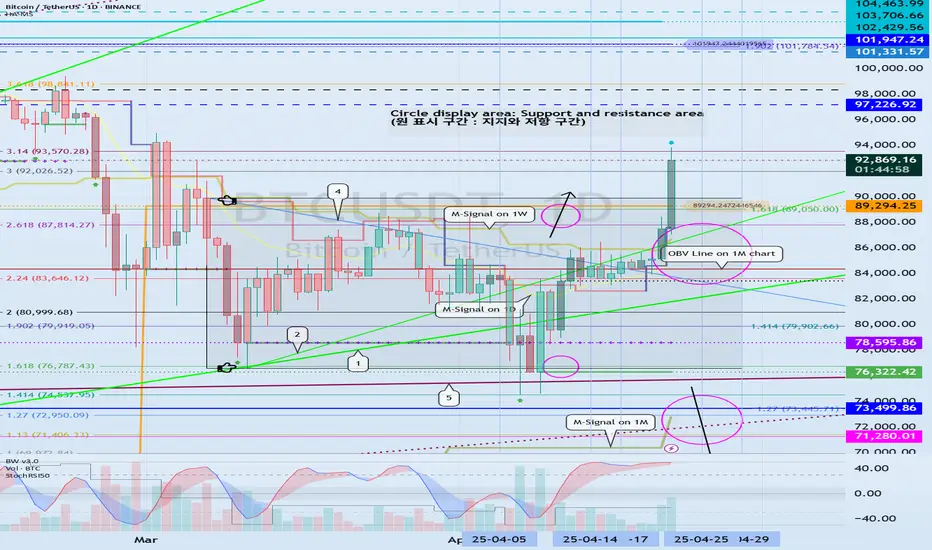
(BTCUSDT 1D chart)
I wonder if you think that BTC has turned into an uptrend as I mentioned before, as it has risen above 89294.25.
The previous idea is titled "Breakthrough trading starts with finding support and resistance points."
It is ideal to buy at the lowest price possible and sell at the highest price possible, but in order to do that, you need to constantly check the chart in real time.
Therefore, I think it is better to focus on finding the most ideal trading time.
Therefore, you should try to trade according to your own trading rules, that is, your trading strategy.
-
In that sense, my trading criteria are the HA-Low and HA-High indicators.
As you can see from the published formula, when the Heikin-Ashi chart shows an upward trend, the HA-Low indicator is created, and when it shows a downward trend, the HA-High indicator is created.
Therefore, if possible, you can think of a trading strategy to buy when it shows support near the HA-Low indicator, and sell when it shows resistance near the HA-High indicator.
If it falls below the HA-Low indicator, a stepwise downtrend may begin, and if it rises above the HA-HIgh indicator, a stepwise uptrend may begin.
Therefore, it is necessary to look at how long the HA-Low and HA-High indicators make a horizontal line.
Looking at the current chart, we can see that the HA-Low indicator was created at the 89294.25 point and the price fell, but the HA-Low indicator remained the same.
Therefore, even if it fell below the HA-Low indicator, it did not lead to a stepwise downtrend.
In order for a stepwise downtrend to lead, the HA-Low indicator must show a new shape as it falls.
-
The HA-High indicator on the 1D chart is formed at the 101947.24 point.
Therefore, the section that determines the trend again is expected to be around 101947.24.
However, since the HA-High indicator on the 1W chart is formed at the 97224.92 point, we must first check whether it can rise above this area.
-
OBV has broken through the upper line.
However, since there is a difference from the previous high, the point to watch is whether it can rise above the previous high.
Section A is the section where the lower point of the HA-High indicator box and the upper point of the HA-Low indicator box overlap.
Therefore, the key is whether it can receive support and rise in this section.
This is because it can be considered a volume profile section because it is a section where the influence of the HA-Low indicator and the HA-High indicator are simultaneously applied.
-
This volatility period is expected to be around April 25-29 (up to April 24-30).
If the StochRSI indicator falls from the overbought zone after this volatility period, then the support around 89294.25 is expected to be an important issue.
The movement of the StochRSI indicator and the price movement do not necessarily appear in the same direction.
Therefore, we recommend that you focus on finding a selling time when the StochRSI indicator is above the 50 point and on finding a buying time when it is below the 50 point.
-
The biggest disadvantage of the breakout trading mentioned earlier is that when it shows a downward trend, it is a split selling period.
In other words, when it rises from the point where the breakout trading was made and then shows a downward trend, it is the first selling period.
If you ignore this, you may suffer a loss or increase psychological anxiety, so you need to be careful.
Since the current HA-Low indicator is the standard for breakout trading, you will feel less psychological anxiety.
The reason is that the HA-Low indicator is created, which means that it has broken out of the low range.
When the price rises and breaks through the HA-High indicator, it feels different from when it breaks through the HA-Low indicator.
When the HA-High indicator breaks upward, it makes you think that it will rise more.
No matter how much you try to calm your mind and look at the chart with a third-party's eyes, it is not easy to stop thinking like that.
The HA-High indicator is created, which means that it has fallen from the high range.
Therefore, since rising above the HA-High indicator means that it has risen to the high range, it is not strange if it falls at any time.
However, as I mentioned earlier, the idea that it will rise more will be dominant, so there is a high possibility that FOMO will take effect.
In order to escape this psychological state, support and resistance points drawn on the 1M, 1W, and 1D charts are absolutely necessary.
It is necessary to make an effort to stabilize your psychological state by conducting a split transaction depending on whether there is support near the drawn support and resistance points.
-
Thank you for reading to the end.
I hope you have a successful transaction.
--------------------------------------------------
- This is an explanation of the big picture.
I used TradingView's INDEX chart to check the entire BTC section.
I rewrote it to update the previous chart while touching the Fibonacci ratio section of 1.902 (101875.70) ~ 2 (106275.10).
(Previous BTCUSD 12M chart)
Looking at the big picture, it seems to have maintained an upward trend following a pattern since 2015.
In other words, it is a pattern that maintains a 3-year upward trend and faces a 1-year downward trend.
Accordingly, the upward trend is expected to continue until 2025.
-
(Current BTCUSD 12M chart)
Based on the currently written Fibonacci ratio, it is displayed up to 3.618 (178910.15).
It is expected that it will not fall again below the Fibonacci ratio of 0.618 (44234.54).
(BTCUSDT 12M chart)
Based on the BTCUSDT chart, I think it is around 42283.58.
-
I will explain it again with the BTCUSD chart.
The Fibonacci ratio ranges marked in the green boxes, 1.902 (101875.70) ~ 2 (106275.10) and 3 (151166.97) ~ 3.14 (157451.83), are expected to be important support and resistance ranges.
In other words, it seems likely that they will act as volume profile ranges.
Therefore, in order to break through these ranges upward, I think the point to watch is whether they can receive support and rise near the Fibonacci ratios of 1.618 (89126.41) and 2.618 (134018.28).
Therefore, the maximum rising range in 2025 is expected to be the 3 (151166.97) ~ 3.14 (157451.83) range.
In order to do that, we need to see if it is supported and rises near 2.618 (134018.28).
If it falls after the bull market in 2025, we don't know how far it will fall, but based on the previous decline, we expect it to fall by about -60% to -70%.
Therefore, if it starts to fall near the Fibonacci ratio 3.14 (157451.83), it seems likely that it will fall to around Fibonacci 0.618 (44234.54).
I will explain more details when the bear market starts.
------------------------------------------------------

sell positionBitcoin's time to fall has come.
Suitable for short positions
Holders should wait to buy for now.
Be happy and profitable
Abtin Financial Academy

Market Analysis: #BTCUSDT💰 On the BYBIT:BTCUSDT.P chart, a clear symmetrical triangle pattern has formed and already broken down, leading to a confirmed bearish impulse. Price has now returned below the POC level at $93,370.4 (Point of Control by volume), indicating weakness from buyers.
📊 Key Levels
🔴 POC BYBIT:BTCUSDT.P $93,370.4
— This is the highest volume area, now acting as strong resistance. As long as price remains below, short bias is favored.
🔵 Support BYBIT:BTCUSDT.P $91,905.5
— A short-term target if the bearish momentum continues.
🎯 Lower Target Zone
— Indicates the full depth of the breakdown move, aiming at the $90,800–$91,000 range.
📈 Volume
➡️ Volume increased during the breakdown, then dropped as price revisited the $93,000 zone — this signals a weak retest and seller control.
📍 Important Notes
➡️ Currently, BYBIT:BTCUSDT.P is trading between two key zones — the POC above and the $91,900 support below.
➡️ Failure to break and hold above $93,370 keeps the bearish scenario in play.
➡️ A move below $92,600 will confirm continuation of the downtrend.
📢 Strategy Recommendations:
🚨 SHORT Scenario BYBIT:BTCUSDT.P
Entry: on a retest of $93,000–$93,200 and rejection
Stop Loss: above POC ($93,450)
Targets: $92,100 → $91,900 → $90,800
🚨 Alternative LONG Scenario BYBIT:BTCUSDT.P (only if POC is broken):
Entry: after a solid breakout and hold above $93,400 with volume
Target: $94,200–$94,800
Stop Loss: below $93,000
🚨 Conclusion :
BYBIT:BTCUSDT.P has completed the triangle pattern and is now in a retest phase. So far, signs still point to bearish continuation, with final confirmation coming from a break below $92,600.

Short-term Bitcoin analysisBe sure to read my previous analysis for Bitcoin long term.
Your comments will be very valuable to us.
If you have any questions, ask us in private

BTC SHORT SIGNAL!!Are you ready for a price drop?
There are two groups of people in the market right now. Those who believe that Bitcoin will go straight from its current price to $125,000, and those who believe that the price must first touch 65-72 to go up. I am in the second group, and I think we have a higher chance of winning if we are a member of the second group. There are a lot of buy orders hidden in the 65-72 areas, it seems that we cannot go up without attracting them.

Bitcoin long-term analysisI am really surprised by some friends' opinions!! They say we will go straight to the 150 target!!
How is it possible for Bitcoin to go up without testing this huge support level?? This move is completely scientifically wrong. Bitcoin needs to increase volume in the huge support area to move.
Every price increase increases the possibility of a drop. That's my opinion.
Stay tuned for Bitcoin analysis in the short term

#BTC is stuck but Here's the simplified Plan!Bitcoin is currently trading between key levels:
Upper resistance: 93700
Lower support: 91670
We are stuck in this range, and a breakout above or below these levels will confirm the next move in the trend.
Right now, Bitcoin is holding the 50 EMA on the 30-minute chart. As long as this support holds, we could see a move towards 95k, after which we will reassess the chart.
Here are two possible scenarios if we hit 95,700 again:
We break above and target 100k
We face rejection and correct back to 88k. While this wouldn’t be a large correction, it could offer a very opportunistic entry point.
I’ll be sharing more insights and updates as the chart unfolds.
Follow me on all my socials (link in bio).
Drop your thoughts in the comment section and hit the like button if this is useful.
Thank you
#PEACE

Bitcoin Major AB=CD in PlayFollowing repeated community requests, we’re updating our Bitcoin macro-outlook, which remains structurally aligned with our previously published projection (BTC Dips into Major Demand Zone)
a chart that precisely captured the major demand zone reaction and subsequent bullish impulse.
The newly updated chart illustrates a strong impulsive wave structure, supported by a well-defined corrective wave count, completing at the prior immediate demand zone (~$85K– GETTEX:89K ).
From this base, price action has resumed within a clearly impulsive structure, suggesting the possibility of an extended bullish fifth wave, potentially evolving into an ending diagonal pattern.
🔹 Immediate Focus:
$85K– GETTEX:89K zone is acting as a local support and re-accumulation area (immediate demand).
$102K resistance is a pivotal structural barrier. A confirmed breakout from this level will reinforce bullish continuation.
🔹 Pattern Target:
A potential AB=CD completion and Wave 5 termination zone are aligned between $147K–$154K, with Fibonacci projections and channel symmetry suggesting further upside extension to $160K–$170K under euphoric conditions.
With momentum building in alignment with the long-term bullish cycle structure. We should watch for retracement entries near demand levels, with invalidations below $73K.
Let us know your thoughts: are we in the final stretch towards BTC's macro top?

Looking to Short Bitcoin if Key Support FailsFrom a short-term perspective, the instrument is in a well-defined uptrend, so shorting at current levels doesn’t make much sense. It’s better to wait for signs of weakness — specifically, when price starts to move lower and breaks below the initial local lows.
In this case, the key zone to watch is the narrow range between 91,911 and 91,631. If price begins to break below that range, a short setup becomes valid, with the first target at 82,953–82,753. The final target is 74,565–74,456.
For now, though, price is still moving upward and could continue higher. Wait for confirmation before taking any position.

BTCUSDTPreferably suitable for scalping and accurate as long as you watch carefully the price action with the drawn areas.
With your likes and comments, you give me enough energy to provide the best analysis on an ongoing basis.
And if you needed any analysis that was not on the page, you can ask me with a comment or a personal message.
Enjoy Trading ;)

