buy market has the buy strength as per the higher on the support level,secondly other crptos are correlating with it
BTCUSDT.P trade ideas

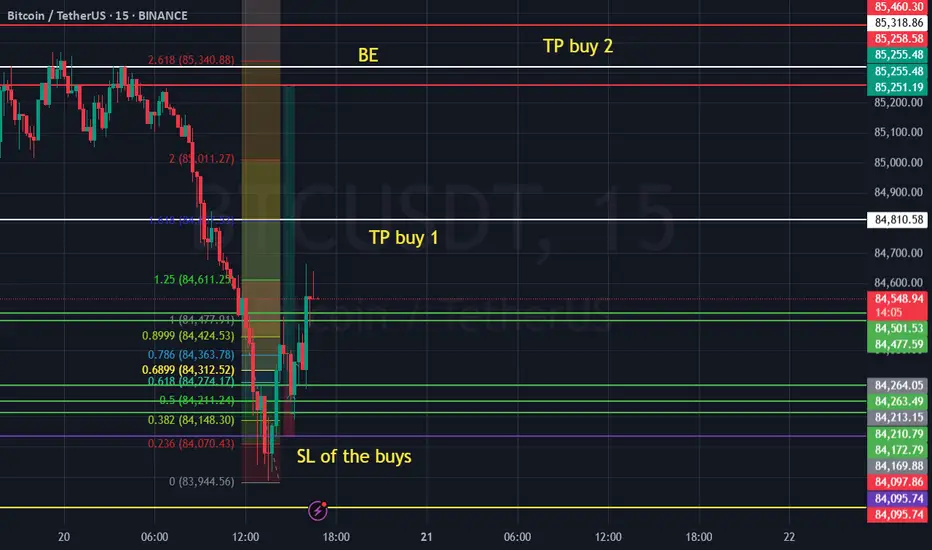
My positions for BTC swing tp the chart
Follow my scalp/swingtrades on a daily basis :)
Use 0.5% risk on all scalp positions and 1-2% per swing level. Watch the chat for more info
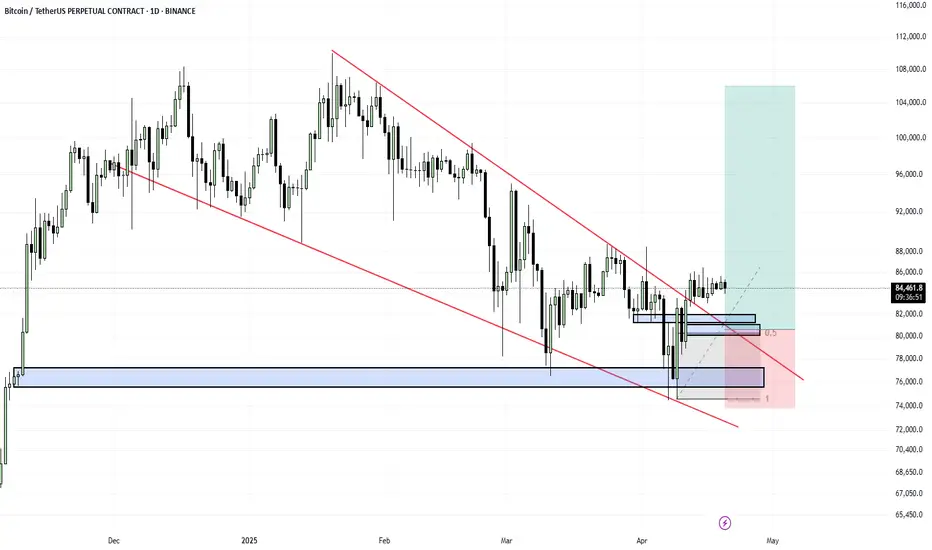
BTC Bulish IdeaThis is one of my ideas about BTC 1Day and 4H. If BTC Can Hold Those levels in Lower Timeframes, that is the best bullish idea so far. If BTC can't hold those levels then we need to plan the next scenario, Also if this level breaks, then I will add some more to my SPOTS
BTC - down next?BTC cleaned up some internal bad highs yesterday, just missing the npoc the we marked out. Immediate rotation back down to VAL followed once we accepted back in side VAH.
These levels are updated continuously as price develops and differ on each traded pair (since volume is different everywhere), so I treat them more as a small zone than actual levels.
Weekend price action so far showed continuation of the spoofing work that marked most of last week. If price can hold around these levels, I still think we can visit the higher POI and maybe sweep the bad highs.
If we lose VAL, all POIs are on the chart:
82k npoc / zone
77-79k OTE retracement, would clean up a lot of inefficient price action
74k lows sweep

TradeCityPro | Bitcoin Daily Analysis #67👋 Welcome to TradeCity Pro!
Let’s move on to the analysis of Bitcoin and key crypto indicators. In this analysis, as usual, I want to review the New York futures session triggers for you.
✔️ Yesterday, the price was rejected from the 85,550 area, and today could be a sensitive and important day for the market.
⏳ 1-Hour Timeframe
In the 1-hour timeframe, I mentioned yesterday that the 85,126 trigger had been activated and if the price pulled back to this area and broke above 85,550, we could witness a bullish move and the start of an upward wave. But that didn’t happen—the price was rejected from the 85,550 high and started moving downward.
👀 Currently, with the price stabilizing below the 85,126 area, selling volume has entered the market, and the price is moving down. The last candle closed below the 84,363 area, and the RSI has entered the oversold zone. If the move continues, the price could experience a bearish leg and move down to 83,233.
🔽 In that case, a break below the 83,233 area could be a good short position trigger, as it would give us confirmation of a trend reversal. But if the move doesn’t continue, this level could turn out to be a fake-out, and the price might head back toward the 85,550 high.
🎲 So today, you can enter a short position with a break of 83,233, and a long position with a break of 85,550. Pay attention to volume and RSI, as they can provide many confirmations for the next price trend.
👑 BTC.D Analysis
Let’s look at Bitcoin dominance. Yesterday, dominance dropped another leg and broke the 63.76 low, but now it has returned to this area and is stabilizing above it.
📈 For a bullish confirmation, dominance needs to stabilize above the 64.12 area, and for a bearish one, it needs to stabilize below 63.12.
📅 Total2 Analysis
Now for the Total2 analysis. This index was rejected from the 965 area yesterday and is now stabilizing below 954. If the bearish momentum continues, the next support level that could hold the price is 932.
🔼 To turn bullish, a break above 965 is required, with the main trigger being 980.
📅 USDT.D Analysis
Let’s look at Tether dominance. Yesterday, it made an upward move and was supported at the 5.44 level. It has now reached 5.52.
✨ If 5.52 is broken, we’ll have confirmation of a bullish trend in dominance. If 5.44 is broken instead, we could anticipate a bearish move and potentially a break of 5.39.
❌ Disclaimer ❌
Trading futures is highly risky and dangerous. If you're not an expert, these triggers may not be suitable for you. You should first learn risk and capital management. You can also use the educational content from this channel.
Finally, these triggers reflect my personal opinions on price action, and the market may move completely against this analysis. So, do your own research before opening any position.

BTCThe future of Bitcoin (BTC) trading amid potential Federal Reserve interest rate cuts in 2025 hinges on liquidity dynamics, institutional participation, and macroeconomic uncertainty.


BTC in Tight Range: Calm Before the Storm?$BTC/USDT is consolidating within a tight range (highlighted in the blue box) for the past 8 days. This looks like a strong accumulation phase, suggesting that the next breakout could be explosive.
Watch for a decisive move above the range for confirmation.
DYOR, NFA

BTCUSDT:sell@86000
BTC's short-term resistance is 86000-86500. You can start shorting when it reaches this area. Currently, all the signals I sent are profitable, and I will continue to send accurate signals.
BTC trading strategy today:
BTCUSDT sell@86000-86500
tp:84500-83000

Review. Refine. Repeat - BTC INTERVIEW 🇺🇸 Bitcoin Distribution Phase? A Wyckoff-Based Breakdown – April 2025
By: Meitar Fadida | FINEMEI
Bitcoin is moving sideways around the GETTEX:82K –$85K zone, and it looks like we’re in the middle of a classic distribution phase, according to Richard Wyckoff’s method. That’s the stage where smart money starts unloading quietly before a possible price drop.
🔍 What’s happening technically?
Demand is shrinking – fewer buyers are stepping in.
Supply is increasing – more sellers are showing up.
The 200-day moving average is holding price down – acting like a ceiling.
RSI is average – not much excitement in the air.
USDT dominance is looking strong and may break upward – usually a sign that traders are going back to cash (less risk appetite).
📆 This week’s key economic data (U.S.):
PMI numbers (Manufacturing & Services) – weaker than expected.
Durable goods and home sales – stronger than expected.
Oil inventories and jobless claims – stable.
🎯 Bottom Line:
This could be the start of a trend change. No panic yet, but the signs are stacking up. If USDT breaks out – it could be the confirmation that Bitcoin is heading lower.

BITCOIN - Price can little correct and then make impulse upHi guys, this is my overview for BTCUSDT, feel free to check it and write your feedback in comments👊
Recently price broke through the $79500 zone after a long phase of flat consolidation and sharp shakeout.
Once bulls reclaimed control, price formed a clean breakout and started building structure inside a wedge.
Momentum carried the price upward, with buyers defending each local dip and creating a stair-step rise.
Now BTC is moving steadily inside the wedge pattern, holding the lower trendline with no strong rejection.
Price is slowly grinding toward the key resistance around $88500, where volatility might return.
If this tempo holds, I expect BTC can grow higher and tag the $91000 points in the next impulsive leg.
If this post is useful to you, you can support me with like/boost and advice in comments❤️

BTC & ETH Weekly Forecast – Will Week 16 Bring a Breakout?🔍 Weekly Outlook – Week 16, 2025
• BTC remains below the daily Ichimoku Cloud.
• Volatility (BBWP) is at historical lows — potential breakout setup.
• ETH hovering above key EVWMA zones
• If BTC enters the cloud, 92K becomes a valid short-term target.
• ETH needs to reclaim 1600+ to sustain bullish momentum.
📌 This is a quick overview of my weekly analysis.
I explore the full setup across 1D, 4H, and 12H timeframes,
with Ichimoku, BBWP, and EVWMA discussed in detail elsewhere.

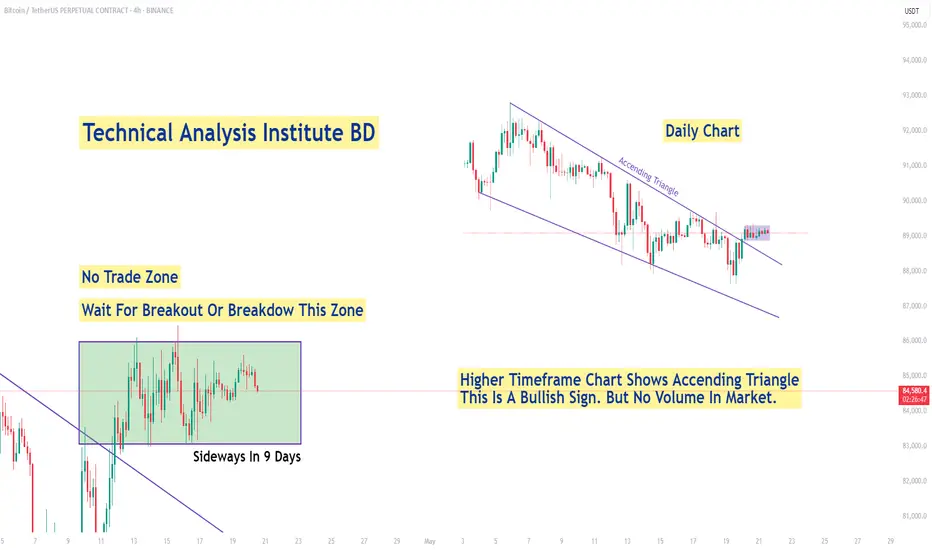
Bitcoin ChartBitcoin Chart Making A Accending Triangle, But No Volume. 9 Days Bitcoin is Sideways. Wait For Breakout Or Breakdown This Zone.
BITCOINThe future of Bitcoin (BTC) trading amid potential Federal Reserve interest rate cuts in 2025 hinges on liquidity dynamics, institutional participation, and macroeconomic uncertainty. Here's a structured outlook based on current Fed signals and market dynamics:
Immediate Impact of Fed Rate Cuts
Liquidity Injection: Fed rate cuts typically reduce borrowing costs, increasing capital flow into risk assets like Bitcoin. Historical precedents (e.g., September 2024’s 50-basis-point cut) show Bitcoin rallies post-easing, with prices surging 20–30% in weeks due to improved risk appetite.
Inflation Hedge Narrative: Persistent inflation (Fed’s 2025 forecast: ~3.2%) could reignite Bitcoin’s “digital gold” appeal. Its fixed supply and halving-driven scarcity make it attractive if fiat devaluation fears escalate.
Key Factors Shaping BTC’s Trajectory
Fed Policy Timing:
Markets price in two 2025 rate cuts starting in Q3, but JPMorgan warns of a potential “sizable cut” pre-May FOMC if economic turbulence (e.g., tariff shocks) intensifies.
Delayed cuts may trigger short-term BTC volatility, while earlier action could propel prices toward $100,000–$120,000.
Institutional Inflows:
ETFs and corporate treasuries continue accumulating BTC, with Bernstein projecting $150,000–$200,000 by late 2025 if Fed easing aligns with GETTEX:70B + inflows.
Macro Risks:
Trade Wars: Escalating U.S.-China tariffs may tighten financial conditions, delaying Fed cuts and pressuring BTC.
USD Strength: Prolonged Fed hawkishness could bolster the dollar, capping BTC’s upside despite rate cuts.
Scenarios for BTC in 2025
Scenario BTC Price Outlook Catalysts
Early Fed Cut (Q2) Rally to $100,000–$120k Faster QT slowdown + dovish Fed rhetoric
Delayed Cut (Q4) Range-bound $75k–$90k Sticky inflation + strong USD momentum
Recession Triggers Spike to $150k+ Flight to scarcity amid equity sell-offs
Long-Term Trends
Halving Cycle: April 2024’s halving reduced new supply, historically preceding bull runs. Combined with Fed easing, this could amplify 2025 gains.
Regulatory Clarity: SEC approval of spot BTC ETFs and stablecoin frameworks may bolster institutional adoption, stabilizing volatility.
Strategic Takeaways
Bullish Catalysts: Fed cuts, ETF inflows, and inflation spikes.
Bearish Risks: Delayed easing, USD resilience, and geopolitical shocks..
In summary, Bitcoin’s 2025 trajectory leans bullish if Fed rate cuts materialize as expected, but traders must navigate volatility from policy shifts and macro shocks. Institutional adoption and BTC’s scarcity will likely underpin long-term appreciation.

Bitcoin may exit from pennant and fall to support levelHello traders, I want share with you my opinion about Bitcoin. Over the past weeks, the price traded inside a broad horizontal range, repeatedly testing the boundaries of the seller zone and the buyer zone. After several failed breakouts, the price sharply dropped from the upper range and entered a phase of lower highs, forming a downward pennant structure. Inside this pennant, the market continued consolidating under pressure from the resistance area. Each attempt to break above the resistance line was met with rejection, confirming strong selling interest near the current resistance level at 88500. At the moment, BTC is testing the upper boundary of the pennant again. This area aligns closely with the resistance level and the long-term descending trendline. Given this confluence and historical rejection zones, I expect BTC to face resistance and reverse, initiating a decline back toward the 79000 support level, thereby exiting from the pennant, which is my current TP1. The compressed price structure, repeated rejections, and clean pattern formation support this bearish outlook in the short term. Please share this idea with your friends and click Boost 🚀

BTC & ETH Weekly Forecast – Will Week 16 Bring a Breakout?🔍 Weekly Outlook – Week 16, 2025
• BTC remains below the daily Ichimoku Cloud.
• Volatility (BBWP) is at historical lows — potential breakout setup.
• ETH hovering above key EVWMA zones
• If BTC enters the cloud, 92K becomes a valid short-term target.
• ETH needs to reclaim 1600+ to sustain bullish momentum.
📌 This is a quick overview of my weekly analysis.
I explore the full setup across 1D, 4H, and 12H timeframes,
with Ichimoku, BBWP, and EVWMA discussed in detail elsewhere.

BTCUSD 4H(4-Hour Timeframe):
A potential short position could be opened from the local order block and the OTE zone at 104,161.75, targeting the liquidity zone at 102,500 as the initial goal. Further targets include the previous month's low and the imbalance at 108,353.
I continue to closely monitor Bitcoin’s movements and will soon share a more detailed idea for a short position (short).
It is essential to note that this analysis represents my personal opinion and is not a call to action for trading. Always conduct your own research before making any trading decisions.!!!

$BTC: Last 2 months pump before the bear market starts.On the chart, you can clearly see the similarities between the last cycle and the current one.
First, this cycle is already longer, so I don’t expect another top in 2026, as some are suggesting.
Based on my analysis, we are currently in the equivalent stage of the last cycle where two strong monthly candles appeared before the market dropped into a bear phase.
Why is this happening?
We are resetting the weekly MACD — it's at the bottom and needs to push into overbought territory before it can turn down alongside the monthly MACD.
As shown in the chart, the monthly MACD is close to turning bearish. If the weekly MACD also flips bearish, that could mark the end of the bull market.
Additionally, volume is dropping, and the RSI supports this scenario. It looks like we’re setting up for one last pump, just like last time — likely followed by a rejection in 2 months.
📊 Check the chart — I’ve laid it out as clearly as possible.
💬 If you agree or disagree, let’s discuss in the comments!
🧠 DYOR — Do Your Own Research!
#Bitcoin #CryptoAnalysis #MACD #RSI #CryptoCycle #BullMarket #BearMarket #BTC #CryptoTrading #TechnicalAnalysis #DYOR #Altcoins #MarketUpdate #CryptoCommunity #Cryptocurrency

Final update for the Bitcoin forecast.I see the completion of the bull flag pattern for BTC.
A new dip between 68K and 70K is needed to finalize the correction, after which a new all-time high of 135K should be reached by the end of July.

BTC USDTThe $85K–$86K zone has undergone multiple retests as a resistance level. Repeated tests of resistance typically indicate weakening supply pressure, increasing the likelihood of a breakout.

Bitcoin Is Entering Into The New ImpulseHello, Skyrexians!
We hope you remember our previous BINANCE:BTCUSDT analysis where we told you that Bitcoin will not go significantly lower than $77k. Now price is already at $85k and people now can't understand what is happening. We can see a lot of charts where traders are calling for bear market and further deep dive.
On the daily time frame we can see the clear picture. At $110k the previous impulse has been finished. Bearish divergence on the Awesome Oscillator and two red dots on the Bullish/Bearish Reversal Bar Indicator were the sign of large correction ABC. Now it has been finished with the confirmation with opposite signals. Moreover, wave C has been finished inside the Fibonacci target area. We are 90% sure now that Bitcoin is going to ATH now and this time it can happen with the altcoins growth.
Best regards,
Skyrexio Team
___________________________________________________________
Please, boost this article and subscribe our page if you like analysis!

Bitcoin showing mixed signals across timeframesOn the 4-hour timeframe, Bitcoin has broken above the descending trendline 📉 — however, the breakout lacks strong momentum, and no higher high has formed yet.
Therefore, we cannot yet confirm a shift from a bearish to a bullish trend.
According to the Fibonacci retracement tool, price is currently ranging between the 0.236 and 0.382 levels. These two zones could act as key decision points on the lower timeframes.
A confirmed breakout above the 0.382 level ✅ would signal bullish continuation.
A breakdown below the 0.236 level ❌ could lead to a move down toward the $81,200 zone — aligning with the broader trendline support.
On the 15-minute timeframe, price is consolidating and forming a triangle wedge pattern 🔺.
A breakout from this wedge may provide short-term direction toward the key Fibonacci levels mentioned above

I think this is the very beginning of the next bull runAfter a pullback I'm sure that this is the very beginning of the next bull run .
Just to be 100%
I need one more confirmation on daily BOS
It continues forward and upward only.
