BTC update. My personal analysis and possible next movementsBITSTAMP:BTCUSD After BTC break last Supply zone and move up, it revealed bigger picture
BTCUSDT.PS trade ideas

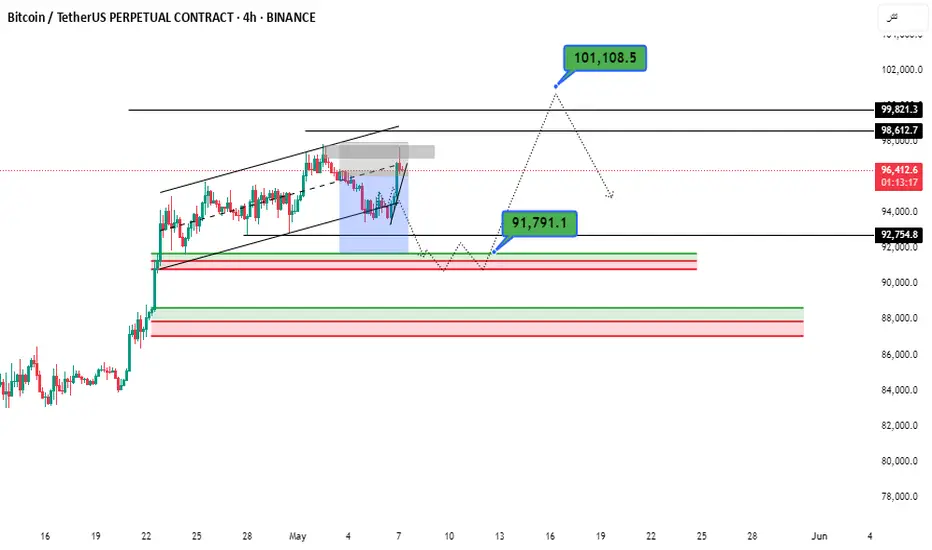
BTC - correction next week?Strong week 🚀 followed by a week one? 📉
Looking at $104,500 as a potential rejection point with a move down to $88,400 (worth -13%).
A break below the uptrend would provide a clue that we have lost momentum. Bearish div. would be nice to see before end of week.

Choosing the Right TimeframeHey traders and investors!
Selecting the right timeframe can reveal a clear picture of price movement. But don’t forget — the higher timeframe always has priority.
🔹 On the 12H, Bitcoin is in a sideways range.
The move from 78,500 to 95,000 could’ve been anticipated — a buyer Decision candle (IKC) formed at the lower boundary of the range gave a strong signal.
The boundaries of the range are marked with black lines on the chart.
What about now?
🔸 No signs of strong selling.
🔸 The last Decision candle (IKC) at the top of the range belongs to the buyer.
🔸 The buyer has already taken out its high.
📉 For shorts — we need seller strength, ideally with price moving below 91,660.
📈 Longs can be considered on lower timeframes, aiming for their local targets.
Not every timeframe gives clear context.
What timeframes do you use to analyze and find trade setups?
This analysis is based on the Initiative Analysis concept (IA).
Wishing you profitable trades!

Update! $BTC range Bound... Consolidation? Breakout? Breakdown? CRYPTOCAP:BTC appears to have formed a range: between approximately between 76800 and 104,300
Current price: 104300
Here are the key observations:
Key resistance zone is around 104300 - Price has tested this level multiple times but failed to close above it decisively.
Clear to say that A break above which will lead to All time highs possibly up to 135k
If #BTC Bitcoin continues to reject this level then expect these layers of support to be tested:
97700 and then 91100
CRYPTOCAP:BTC remains bullish if prices remains above 91100. Further break down will lead to bottom of range 84100 and 76800 (coinciding with 200 EMA )
Trading Implications:
For Longs: Avoid new positions unless there's a breakout with volume above $105,000.
For Shorts: This is a possible scalp opportunity near the top of the range, with a stop slightly above $105,000.
Not financial Advice!

Bitcoin Breaks Out – Is $106K the Next Big Target?Bitcoin (BTCUSD) has recently broken higher within an ascending channel, indicating a strong bullish trend. The price continues to respect the channel's structure, forming consistent higher highs and higher lows — a classic sign of trend continuation.
The breakout suggests the potential for a move toward the $106,000 level, provided current support levels hold. Traders are advised to watch for confirmation signals such as bullish candlesticks, bounce from support zones, and increasing volume to consider long positions.
This setup reflects growing momentum and market optimism, positioning Bitcoin for a possible extended rally.

BTC 104k, what can we expect next?Bitcoin 4H Chart Analysis
1. Trend Structure:
Current trend: Strong bullish impulse from ~$84,000.
Price broke previous highs (~$100,000) and is holding above.
All EMAs (50/100/200) are sloping upward — confirming the uptrend.
No reversal signs yet in the current structure.
2. RSI (Relative Strength Index):
RSI is near 80, but is it overbought?
No clear bearish divergence on the 4H chart.
RSI might cool off via sideway consolidation movement, not necessarily a sharp drop.
3. Key Levels:
Current Price: ~$103,800
Immediate Resistance: $104,400–$105,000
Major Resistance: $106,800–$108,000
Immediate Support: $102,000 → $100,500
Key Support Zone: $98,000–$99,000
4. Scenarios:
Scenario A – Final push to ~$105k, then pullback
Price breaks $104.4k, reaches ~$105k, then retraces to ~$101.5k–$102k.
Probability: 60%
Scenario B – Strong breakout to $106k–$108k without pullback
Price continues impulsively despite RSI being overheated.
Probability: 30%
Scenario C – Reversal from current level (~$103.8k)
Price fails to break $104.4k, forms a double top or fakeout.
Probability: 10%
Conclusion:
Current trend is bullish, but momentum is stretched in consolidation.
Most likely: price will test $104.4k–105k and pull back slightly before deciding the next move up.
If price moves above $106k cleanly, we’re likely entering a new breakout phase and on the way for the new ATH!

bitcoin will hit around 107k-108.6k very soonbitcoin will hit around 107k-108.6k very soon and then goes down to around 103k 104k BINANCE:BTCUSD

Bitcoin Weekly Chart Summary-2 (as of May 6, 2025)Trend: Bullish, inside a rising parallel channel.
Price: ~$93,767, facing resistance near $95K–$100K.
Support Zones: 88K, $80K, $73K.
Breakout: Confirmed from descending wedge; above major EMAs.
RSI: Neutral-bullish (~57), room for upside.
ADX/DMI: Positive trend, but flattening—watch for momentum shift.
Volume: Declining—needs breakout confirmation with strong volume.
Key Level to Watch: Close above $95K may target $110K–$120K; drop below 88K risks retracement.

Potential Short SetupA rising wedge is forming on the 4H chart, hinting at potential bearish pressure. Adding to the caution, CVD divergence suggests that buying volume isn't fully supporting the price action—possible exhaustion ahead.
⚠ Not Financial Advice ⚠
Trade with caution! If you don't have a proper risk management plan, DO NOT TAKE THE TRADE. Always manage your exposure wisely.

BTCUSDT:Sharing of the Latest Trading StrategyAll the trading signals this week have resulted in profits!!! Check it!!!👉👉👉
The price of BTCUSDT fluctuates around $100,500. Technically speaking, if it can firmly stand at the level of $100,000, it is expected to challenge the level of $105,000. If it breaks below $98,000, it may trigger a pullback. Pay attention to the support at $100,000 and the strong support at $98,000. In terms of trading operations, one can open a long position with a small position near $100,000.
Trading Strategy:
buy@100000-101000
TP:103000-105000
The signals in the Signature have brought about continuous profits, and accurate signals are shared every day. Hurry up and click to get them!
👇 👇 👇 Obtain signals👉👉👉


BTC/USDT Analysis – 4H Chart
This chart shows classic bullish continuation through ascending channels and consolidation breakouts:
A solid double-bottom structure was formed in early April
Marked the start of the uptrend
First consolidation box (~$90K–$93K)
Horizontal accumulation (highlighted gray box)
Resulted in a clean breakout and continuation
Rising channel (~$94K–$99K)
Rising Mid-trend consolidation wedge/channel
Price respected both trendlines
Eventually broke out to the upside → Strong momentum candle followed
Current Status (~$103K)
Price has broken above the rising channel
Now forming a new mini flag or consolidation at the top
Momentum is still in favor of the bulls
If you found this analysis helpful, hit the Like button and share your thoughts or questions in the comments below. Your feedback matters!
Thanks for your support!
DYOR. NFA
BTC - TO THE MOON?Just some basic things to look out for here:
- we are currently inside the last supply zone (imbalance, orderblock, bad highs). Just treat it as a zone but look for distributive PA. Obviously momentum is on the bull side, so be very picky with short entries. Idea is that the high holds just like the previous range between 50-75k.
- if that short/sell signal fails, getting on board on bullish ltf momentum above the bad highs is a good way to play some short squeeze or bigger impulse. Obviously gonna be a crowdy trade, so get in when other longs get stopped.
- Pullback into first support: the poc of the weekly range we just reclaimed. It was the first rejection after getting back in, so we assume some shorts are still trapped here and would like to get out. Again treat it as a zone, poc differ on each trading pair because the volume is different everywhere. Coinbase poc is a bit higher, perp poc like this a bit lower.

Fibonacci Extensions: Mapping Market Psychology Beyond the TrendHello, traders! 💫
Fibonacci numbers have traveled far from ancient Italian math to modern trading charts. In technical analysis, Fibonacci Extensions aren’t just mystical ratios; they’re a structured way to project potential price targets based on crowd psychology and trend continuation.
But what are they really, and why do so many traders draw those lines with near-religious fervor?
🧠 A Quick Historical Detour
Leonardo Fibonacci introduced the sequence to the West in the 13th century based on patterns he observed in Indian mathematics. The key idea is that each number in the sequence is the sum of the two before it: 1, 1, 2, 3, 5, 8, 13, 21...
When you divide specific numbers in the sequence, you get ratios that repeat throughout nature — and, intriguingly, financial markets. These include:
0.618 (the “golden ratio”)
1.618
2.618, and so on.
While Fibonacci Retracements look backward to gauge potential pullbacks, Fibonacci Extensions look forward to mapping possible continuation levels after a price move.
📊 Fibonacci Extensions
To use Fibonacci Extensions, you need three points:
The Start of a Trend (Point A)
The End of the Trend or Impulse Move (Point B)
A Retracement Low/High Where Price Bounces or Consolidates (Point C)
This ABC move applies Fibonacci ratios to project levels beyond point B, helping traders visualize where the price might go if the trend continues.
Common Extension Levels Include:
1.272
1.618 (golden ratio)
2.0
2.618
Each level acts as a kind of psychological milestone — not a guarantee, but a place where market participants may take profits, reassess, or react.
🔎 Let’s Take a Real Example: BTC/USDT Weekly
It's not that Fibonacci numbers have magical power. The theory is based on self-fulfilling behavior. When enough traders watch the same levels — and act on them — they can influence real outcomes.
The chart illustrates how Fibonacci retracement levels can be used to understand the depth and structure of a correction during a bullish cycle.
Low (~$4,783) in March 2020 (COVID-19 Сrash)
to the High (~$65,834) in November 2021 (Bull Market Peak)
From there, the price corrected throughout 2022–2023. Let’s look at what happened at each level — and what it tells us on the graph.
🔍 Why This Matters
Your retracement levels aren’t just lines — they mapped the psychology of the market:
Investors Testing Conviction at 0.5
Panic at 0.618
Capitulation Near 0.786 — but Without Full Breakdown
And Finally: A Rebound in 2023, Leading to New Highs in 2025
This kind of structure is textbook Fibonacci behavior — and is part of why retracement levels remain a core part of institutional technical analysis.
⚖️ Final Thought
Fibonacci Extensions are not about telling you where the price will go — they’re about framing where the price might go if the current trend keeps moving. It’s a lens through which to read market psychology, momentum, and expectation. Combined with volume, structure, and broader trend context, they potentially help analysts build a more nuanced market narrative.
And maybe Leonardo Fibonacci would have appreciated that his 800-year-old math is still trying to decode modern human emotion, just on candlestick charts.

Bitcoin a Technical Summery technical summary based on what you're describing for BTCUSDT on the 4H timeframe:
Forecast from Mr Martin Date 05 May 2025
Current Setup:
Pattern: Two-sided consolidation/pattern (likely symmetrical triangle or range)
Key Support: ~89,000 USDT
Key Resistance: ~95,000 USDT
Scenarios:
Bullish Breakout:
If price holds above 95K and confirms breakout: Next target: ~98,000 USDT
Above 98K, could test psychological levels like 100K.
Bearish Breakdown: If price falls below 89K:nExpect a retest or quick rebound toward resistance (~95K).
You may see more details in the chart Ps Support with like and comments for more analysis Thanks

Bitcoin LongIf you feel sidelined this is an area where u can start bidding longs for that 103k target.
I think 97k is an area where btc can easily comeback to.

BTC, lets see bearish pin bar behaviourBearish pin bar appeared + bearish divergence, expecting to get into a minor correction before further growth.
This post is nostly dedicated to bearish pin bar to see how it works in real time environment during active trade.

BTC path is clearShort term indicator showing side way channel consolidation, if bottom line breaks going down, if upside range breaks up going higher to 109k


BTCUSDT-4Hafter sweep 3 levels of liquidity bitcoin can be corrective for saving energy to form new HH...

Bitcoin (BTC): We Will Re-Test ATHs | Crazy VolatilityCrazy movement is happening in the markets recently, where we are once again seeing markets being driven by news and enthusiastic bullish movement.
As we mentioned yesterday, if we see a break of the liquidity zone near $99K, we will be retesting ATH most likely, and this is our view as of now. FOMO on the markets will lead the price to upper zones where, once back at ATH, we will be looking for MSB.
Of course, if we see strong dominance by buyers near the ATH, then $140K might be the next target, but nothing is confirmed yet; it is just a thought.
Swallow Academy

“+$25K Profit & Still Long – Don’t Chase, Trade Smart”Since the drop to 74K, we've seen an incredibly fast and powerful rally over the past month—and I’m currently sitting on a realized profit of over $25,000 during this move.
One of the most bullish signals in this entire structure is that since the reversal in April, we’ve never seen a proper correction or trend-reversing retracement. As I mentioned in previous updates, this shows exceptional strength and suggests the uptrend remains firmly intact.
In fact, we’re climbing without breaking any key lows—what I like to call a “step-by-step” grind upward. On higher time frames, these look like strong bullish candles, meaning more buyers than sellers, and aggressive market orders pushing price higher. That’s a characteristic of strong trends—remember that.
Now, with the historical ATH at $109,000 getting closer, I do not expect an immediate breakout to new highs. Instead, we might see a healthy consolidation—either price-wise or time-wise—around this major supply zone. This is not the time to FOMO in.
The recent surge was fueled by comments from President Trump, and that breakout candle was significant. But sharp moves often bring sharp corrections. If price pulls back to the 96–95K zone and finds support, that could be the base for a new push toward all-time highs.
If you’re not in a position right now:
🚫 Do NOT rush into the market.
We are at a spot where both a breakout and a reversal are possible. Whether you’re using the lower or higher time frame, wait for clear confirmation—a pullback, a base, a proper setup.
Look to long only after strong support is confirmed, or short if price keeps failing to break highs. Either way, keep a tight stop and let your winners run—there’s still opportunity here, but only with proper risk-reward.
I’ll say it again because it’s important:
If you missed this long, it’s okay.
The market will correct—whether sharply or slowly—and your edge is not in chasing, but in being ready. Don’t let impulsive trades erase your capital or your confidence.
Oh, and by the way—I’m still holding my long position.
