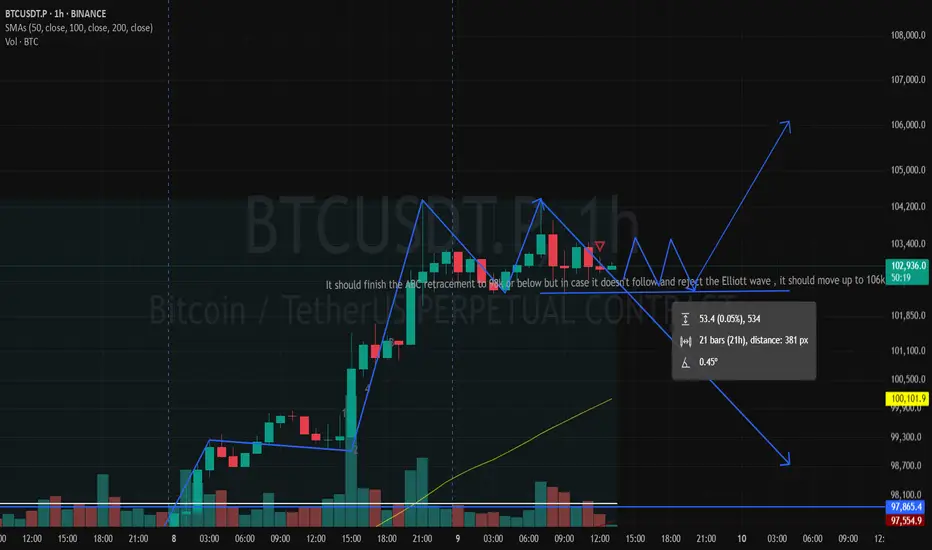
Will BTC finish completing the Charlie wave?The chart is self explanatory and Bitcoin should complete the ABC retracement but in case it denies following the Elliott Wave it will resume the upwards move to 106k+. Remember Bitcoin is unpredictable as driven by MMs could move either way any time. Be cautious!
BTCUSDT.PS trade ideas
BTC Range Bound | Breakout Imminent ?👀 Welcome to my Trading View Analysis and Trading Channel Here , we share the latest market analysis, trading signals, and key insights together .
Ready for smarter trades ? ⭐️
⚡️Today , we're going to analyze the BTC( BitCoin) coin together on the daily timeframe and find triggers for our positions .
📊✨ Bitcoin 4H Technical Analysis & Weekly Outlook – May 6, 2025
🔸 BTC is currently trading within a consolidation range between $97,325 and $93,780, indicating a potential accumulation zone before the next major move. 🌀
🔍 Key Technical Levels:
📈 Resistance: Break above $97,325 could trigger a long entry, suggesting bullish continuation. 🚀
📉 Support: Drop below $93,780 may activate a short setup, signaling bearish pressure. ⚠️
📐 Indicators Breakdown:
🔹 EMA 100 & 200: Positioned below price, supporting the bullish bias. 🟢
🔹 EMA 50: Currently sitting above the 4H candle, posing short-term resistance. 🔴
📉 Volume: Noticeable decline, showing market indecision – a common pre-breakout signal. 📊
📌 Key Pivot: A candle close above $94,021 would validate it as strong support. 🧱
📰 Positive Market Developments:
🏦 Morgan Stanley plans to offer spot BTC trading via E*Trade – institutional adoption accelerating. 📈
🏢 Strategy (MicroStrategy) signals further Bitcoin accumulation – corporate trust remains strong. 💼
💰 Over $1.8B flowed into U.S. BTC ETFs last week – investor appetite is growing rapidly. 🧲
📈 Analysts forecast BTC reaching $120K–$200K by end of 2025 – fueled by macro trends & halving cycle. 🌕
💡 Final Takeaway:
🔐 Bitcoin continues to prove itself as a valuable long-term asset, backed by rising institutional interest, robust on-chain fundamentals, and strong technical signals. 🌟
📊 Triggers for both long and short positions are clearly marked on the chart – stay sharp and manage risk! 🎯
I love you all so much . 👀
don't forget about capital management and risk management .
Be careful with your positions . 🥇

BTCUSDTSecond trade of the day is on BTCUSDT — and I’ve already entered the position.
I’ve set the Risk-to-Reward Ratio to 1:1 this time, as I entered with a higher lot size than usual.
🔍 Criteria:
✔️ Timeframe: 15M
✔️ Risk-to-Reward Ratio: 1:1
✔️ Trade Direction: Buy
✔️ Entry Price: 98,835.27
✔️ Take Profit: 99,320.67
✔️ Stop Loss: 98,347.72

BTCBTC on 4hr we got the structure and focused on other pairs .the price will hit 100k and above today. 108k is my final TP on strategy.

Bitcoin Weekly Chart Summary (as of May 6, 2025)
Trend: Bullish, inside a rising parallel channel.
Price: ~$93,767, facing resistance near $95K–$100K.
Support Zones: FWB:88K , $80K, $73K.
Breakout: Confirmed from descending wedge; above major EMAs.
RSI: Neutral-bullish (~57), room for upside.
ADX/DMI: Positive trend, but flattening—watch for momentum shift.
Volume: Declining—needs breakout confirmation with strong volume.
Key Level to Watch: Close above $95K may target $110K–$120K; drop below FWB:88K risks retracement.
Let me know if you'd like trade ideas or projections.

BTCUSDTHello everyone. Wishing you all a great weekend!
Just because the FX market is closed today doesn't mean we should stay away from trading in the crypto markets.
That’s why I’ve activated a Buy trade on BTCUSDT and wanted to share it with you as well:
🔍 Criteria:
✔️ Timeframe: 15M
✔️ Risk-to-Reward Ratio: 1:1.50
✔️ Trade Direction: Buy
✔️ Entry Price: 103974.98
✔️ Take Profit: 104442.64
✔️ Stop Loss: 103662.77
🔔 Disclaimer: This is not financial advice. It's a trade I’m taking based on my own system, shared purely for educational purposes.
📌 If you're also interested in systematic and data-driven trading strategies:
💡 Don’t forget to follow the page and subscribe to stay updated on future analyses.

BTCUSD BUY TRADE RESULT BTCUSD hit all tps 100 pips after hit 30 pip sl because Saturday and Sunday not the trading days but i see this setup yesterday and share it with you let see in new week

Later, Bitcoin!Bitcoin remains in a long-term bullish trend, but it currently appears significantly overvalued relative to gold. The recent breakout, followed by a re-test of the upsloping wedge formation, suggests that bullish momentum may be waning. This could indicate that capital is beginning to rotate out of Bitcoin. As a result, it may be more prudent to revisit the market in one to two years ahead. This shift may also mark the beginning of a potential altcoin season.

Financial Markets: Outlook and Risks – May 2025As May 2025 begins, global financial markets are entering the month with cautious optimism, shaped by anticipation surrounding decisions from key regulatory bodies. At the center of this uncertainty lies the U.S. Federal Reserve, whose policies continue to exert a significant influence over global asset dynamics.
After a series of interest rate hikes throughout 2023 and 2024, the Federal Reserve has adopted a more neutral stance, closely monitoring macroeconomic indicators. Despite a moderate decline in inflation and stable employment figures, Fed officials remain hesitant to declare an end to the tightening cycle. In his latest address, Fed Chair Jerome Powell emphasized the need for "vigilance amid geopolitical volatility and structural changes in the global economy."
The U.S. stock market entered May with moderate volatility. The S&P 500 index is hovering near local highs, while investors are reacting cautiously to corporate earnings reports and Fed commentary. Tech stocks are largely on the rise, driven by expectations of expanded AI integration, while companies in the industrial and energy sectors face pressure from rising input costs and supply chain instability.
Europe is facing a more complex situation, with inflationary pressures persisting, especially in the energy sector. The European Central Bank (ECB) is walking a fine line between tightening monetary policy and supporting sluggish economic growth. Major indices like the UK’s FTSE and Germany’s DAX are showing mixed signals, reflecting domestic challenges and ongoing geopolitical tensions.
On currency markets, the U.S. dollar remains relatively strong, though it occasionally dips as expectations grow for a more dovish stance from the Fed. The euro and the Japanese yen are showing periodic strengthening, backed by active central bank measures. Emerging markets such as Brazil and India are seeing increased interest in gold and government bonds as a hedge against external risks.
Beyond monetary policy, one of the main concerns for investors is the ongoing trade dispute between the U.S. and China. Tariff hikes and export restrictions on strategic goods are raising alarms about supply chain reconfigurations and capital reallocation on a global scale.
Investors around the world are searching for a balance between risk and return. Current strategies emphasize diversification, safe-haven assets, digital technologies, and ESG-focused sectors. Analysts advise a measured approach, urging investors to closely monitor macroeconomic data before making major portfolio decisions.
In summary, May 2025 marks a period of watchfulness and recalibration. Financial markets are looking to the Federal Reserve, trade negotiations, and key economic reports for signals that will likely define the tone for the months ahead.

BTC - SHORT TERM DIRECTIONSelling wick on the 12-hour candle confirms strong resistance around the $96K– GETTEX:97K zone.
We may see a short-term dip towards $95K–$94K, but it’s really nothing to worry about.
While BTC searches for support, altcoins are likely to take advantage of this consolidation phase and rally. I don’t expect BTC’s short-term movement to significantly impact altcoin performance. It would only become a major influence if Bitcoin were showing signs of a long-term bearish trend — which it’s not.
No concern here — just keeping you all informed on BTC’s price action, as always.

BTCUSDT LONG/BUYBy utilizing Fibonacci retracement levels, historical patterns, , we can formulate a hypothesis that the market might follow a similar trajectory if bullish sentiment prevails.

BTCUSDT:Sharing of the Latest Trading StrategyToday,we have successfully achieved a target of 120 points. resulted in profits! Check it!👉👉
As of today, Bitcoin has stabilized above $100,000. Institutional funds have been continuously flowing in, and the market sentiment is strongly bullish. Technically, the RSI is approximately 58.7, the MACD is 624.2, indicating strong bullish momentum. However, the Williams %R is -1.2, entering the overbought zone, suggesting a possible short-term adjustment. In terms of trading operations, it is recommended to wait for the price to stabilize within the range of $101,000 - $102,000 before considering entering the market. The target price range is set at $105,000 - $110,000, and the stop-loss is set below $99,000.
Trading Strategy:
buy@110000-102000
TP:105000-106000
The signals in the Signature have brought about continuous profits, and accurate signals are shared every day. Hurry up and click to get them!
👇 👇 👇 Obtain signals👉👉👉

2 ScenariosFor me there a 2 scenarios. This one was the last pump to liquidiate shorters to go back to ~95k.
Or its a quick shakeout and we will try to hit ATH again, after rejection we go for the CME gaps at 89000-91000

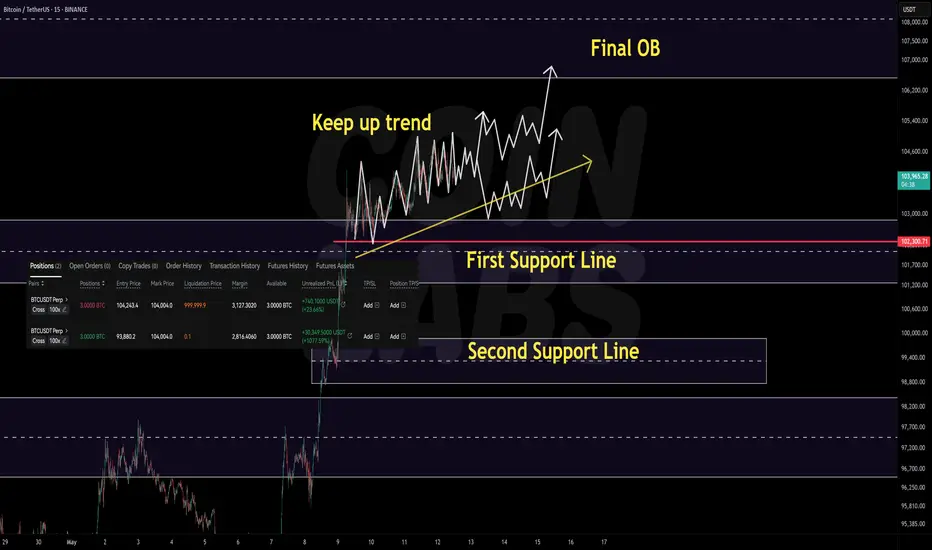
+$30K Unrealized | Still Long, Is ATH Next?Even after the strong rally that pushed Bitcoin past the 100K level, the price continues to hold critical support zones without breaking recent lows. We're seeing a steady, stair-step climb ("grinding higher")—absorbing previous supply through sideways consolidation while still making higher highs.
After forming a local high near 105,000, we’ve seen some pullback—but so far, there’s been no breakdown of major support, especially on lower timeframes. The structure still favors continuation to the upside, and the broader uptrend from the 74K–83K zone remains intact.
That said, we haven’t seen any major correction yet. With the market now testing the final supply zone before all-time highs, failure to break out could trigger a wave of profit-taking. This could lead to short-term selling from traders who bought lower, anticipating new highs.
We're now in a zone where volatility can spike in both directions, making it a tough area for clean entries. Long positions may feel risky due to the high level, and shorting too early might get squeezed out by another high. But this environment also presents great short-term opportunities—as long as you're quick and manage risk tightly.
If the current bounce fails to break above 105K, it may signal a larger corrective move. The first support zone to watch is 103K, followed by 99K. Even if price pulls back to these levels, the overall trend may still be valid—these are key zones where the uptrend could resume.
At this point, we must observe whether this bounce leads to further continuation or becomes a “trap” before a larger move down. If price holds the previous supply zones as support, we could see another leg up. If not, a deeper retracement may unfold.
This is also a zone where many traders may FOMO in, expecting an immediate breakout, only to get caught in a fakeout or shakeout. Personally, I think the market is more likely to test this final supply zone with increased volatility and a deeper correction before making a real move to new all-time highs. Risk management is crucial here.
We’ve had a strong rally with no significant retracements, and while the uptrend may continue, failure to break out soon—or if profit-taking kicks in—could lead to meaningful corrections. Be prepared.
To summarize, we are in a very important decision zone:
Will price continue holding the lows and grind higher to new ATHs,
or will it reject from supply and trigger a larger retracement?
Whatever happens next, don't rush into a position out of fear of missing out.
Wait for structure, wait for confirmation, and remember: entering one step later at a better level is far better than entering too soon and getting stopped out.
BTC 104k, what can we expect next?Bitcoin 4H Chart Analysis
1. Trend Structure:
Current trend: Strong bullish impulse from ~$84,000.
Price broke previous highs (~$100,000) and is holding above.
All EMAs (50/100/200) are sloping upward — confirming the uptrend.
No reversal signs yet in the current structure.
2. RSI (Relative Strength Index):
RSI is near 80, but is it overbought?
No clear bearish divergence on the 4H chart.
RSI might cool off via sideway consolidation movement, not necessarily a sharp drop.
3. Key Levels:
Current Price: ~$103,800
Immediate Resistance: $104,400–$105,000
Major Resistance: $106,800–$108,000
Immediate Support: $102,000 → $100,500
Key Support Zone: $98,000–$99,000
4. Scenarios:
Scenario A – Final push to ~$105k, then pullback
Price breaks $104.4k, reaches ~$105k, then retraces to ~$101.5k–$102k.
Probability: 60%
Scenario B – Strong breakout to $106k–$108k without pullback
Price continues impulsively despite RSI being overheated.
Probability: 30%
Scenario C – Reversal from current level (~$103.8k)
Price fails to break $104.4k, forms a double top or fakeout.
Probability: 10%
Conclusion:
Current trend is bullish, but momentum is stretched in consolidation.
Most likely: price will test $104.4k–105k and pull back slightly before deciding the next move up.
If price moves above $106k cleanly, we’re likely entering a new breakout phase and on the way for the new ATH!

BTCUSD Wil Fly More (READ CAPTION)Check out my BTCUSD Chart And Share your ideas About it.
Price Will Continue To Fly From Current price of 103,100 The Expected Target is 107,500
Key points
Resistance Area 104,300
Support Area 101,200
target point 107,500
Likes and Comments .

BTC/USDT Analysis: Resumption of a Full Bullish Trend
Hello everyone! This is CryptoRobotics' trader-analyst with the daily analysis.
Yesterday, Bitcoin finally broke the previous high. There was no false breakout or seller defense on higher timeframes, so the uptrend continues.
The next target is $105,000.
A local support zone has formed at $98,000–$97,200 after the breakout. So far, there are no signs of seller presence, but low volume remains a concern. Any strong surge in seller activity could trigger a significant correction.
Resistance zones:
$107,000–$109,000 (volume anomalies)
Support zones:
$98,000–$97,200 (local support)
$91,500–$90,000 (strong buy-side imbalance)
$88,100–$87,000 (absorption of market selling)
$85,500–$84,000 (accumulated volumes)
$82,700–$81,400 (volume zone)
Level $74,800
$69,000–$60,600 (accumulated volumes)
This publication is not financial advice.


BTC - long squeezeI'll be truthful I don't think the expression "long squeeze" is a real thing - but it should be!
Daily TF
Next level down i think is 98K should the local support @ 102K break.
0.5 fib puts us at 89K / a touch on a macro uptrend / touching a key price point where BTC has oscillated for several months. This move would accomplish a liquidity grab and fill a fair-value-gap. If this happens it could be a fantastic long opportunity.
If prices sees continuation to the downside the 618 would be the next natural retracement level but would result in a break below said macro uptrend and thus could create a macro bearish move - 67K would be my guess.

106k next target!BTC PUMP AND PUMPED , but 106k will the end of wave 3. Then fall to 102k (wave4) and after this correction we will have NATH (112) . Good luck 👍

$6000 Leap for BTC?This idea is super concise!
Bitcoins price appears to have found support on a 3M 0.618 retracement level.
The logical next step would be a leap to the 0.786 retracement level at 102,000.
Looks like BTC is loading its canon..

BTC HOLDING LEVELSDear friends,
I want to analyze and discuss Bitcoin's future movements without any unnecessary chatter. Looking back at my previous analysis of BTC, I mentioned that I was waiting for lower prices to buy Bitcoin, and it seems we are at the beginning of the correction waves I was anticipating.
I have identified three price levels where I plan to invest. It may take days or weeks to reach these levels, but once they do, I will buy Bitcoin and wait for it to reach $135,000 or even higher.
I expect the price to continue its downward trend, potentially reaching $70,000 or lower. I plan to make my purchases at $80,000, $75,000, and if the price hits $67,000, I will invest my full budget. My first target is $135,000, which I believe could be achieved in the coming months or years.
IMPORTANT: I will sell my holdings if the price continues to drop to $54,000. This could lead to significant issues for Bitcoin and its holders, so if that happens, I will exit my position and wait for new upward momentum.
"IT'S JUST GOOD BUSINESS"

Bitcoin Local TopBitcoin: rally meets resistance
Context
• April low: $74 000 → today’s high: $101 200 (+37 %)
• 90‑day pause on new US tariffs lifted risk assets; FOMC left rates at 4.25‑4.50 % with real yields still > 2 %
• Active conflicts in Ukraine, Gaza and the South China Sea keep macro‑volatility elevated
Flows
• US spot‑ETF complex: cumulative net inflow $40.7 bn, AUM $106 bn
• BlackRock’s IBIT: 15 consecutive inflow days, $6.96 bn YTD
• MicroStrategy: bought 15 355 BTC (~$1.42 bn) last week, now holds 553 k BTC
Technical focus (2‑hour chart)
• Price is 11 % above the rising trendline from 1 May
• Key confluence: $101 700 – $103 000 (0.27 Fib plus unfilled weekly supply)
• First support: $97 000 – $98 000; major demand: $92 000
• Mean‑reversion target if momentum breaks: $86 000
• Invalidation of pullback view: daily close above $103 500
Base case
60 % probability of a retest of $92–97 k before any sustained advance
30 % chance of a deeper wash to $86 k
10 % chance of a clean breakout through $103 k toward $109 k+
Takeaways
• Long‑only allocators: add on a confirmed weekly close above $103 k; risk below $98 k
• Swing traders: fade spikes above $102 k toward $97 k; tighten stops if daily > $103 k
• Spot accumulators: schedule bids at $92 k and $86 k; avoid chasing upside extensions
Educational commentary, not investment advice. Manage position size and respect stops.
