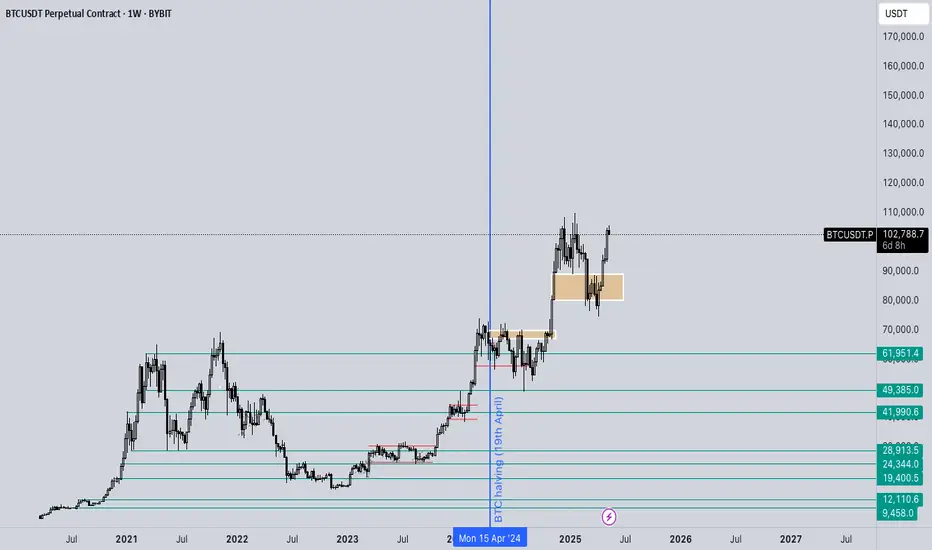
$6000 Leap for BTC?This idea is super concise!
Bitcoins price appears to have found support on a 3M 0.618 retracement level.
The logical next step would be a leap to the 0.786 retracement level at 102,000.
Looks like BTC is loading its canon..
BTCUSDT.PS trade ideas

BTC HOLDING LEVELSDear friends,
I want to analyze and discuss Bitcoin's future movements without any unnecessary chatter. Looking back at my previous analysis of BTC, I mentioned that I was waiting for lower prices to buy Bitcoin, and it seems we are at the beginning of the correction waves I was anticipating.
I have identified three price levels where I plan to invest. It may take days or weeks to reach these levels, but once they do, I will buy Bitcoin and wait for it to reach $135,000 or even higher.
I expect the price to continue its downward trend, potentially reaching $70,000 or lower. I plan to make my purchases at $80,000, $75,000, and if the price hits $67,000, I will invest my full budget. My first target is $135,000, which I believe could be achieved in the coming months or years.
IMPORTANT: I will sell my holdings if the price continues to drop to $54,000. This could lead to significant issues for Bitcoin and its holders, so if that happens, I will exit my position and wait for new upward momentum.
"IT'S JUST GOOD BUSINESS"

Bitcoin Local TopBitcoin: rally meets resistance
Context
• April low: $74 000 → today’s high: $101 200 (+37 %)
• 90‑day pause on new US tariffs lifted risk assets; FOMC left rates at 4.25‑4.50 % with real yields still > 2 %
• Active conflicts in Ukraine, Gaza and the South China Sea keep macro‑volatility elevated
Flows
• US spot‑ETF complex: cumulative net inflow $40.7 bn, AUM $106 bn
• BlackRock’s IBIT: 15 consecutive inflow days, $6.96 bn YTD
• MicroStrategy: bought 15 355 BTC (~$1.42 bn) last week, now holds 553 k BTC
Technical focus (2‑hour chart)
• Price is 11 % above the rising trendline from 1 May
• Key confluence: $101 700 – $103 000 (0.27 Fib plus unfilled weekly supply)
• First support: $97 000 – $98 000; major demand: $92 000
• Mean‑reversion target if momentum breaks: $86 000
• Invalidation of pullback view: daily close above $103 500
Base case
60 % probability of a retest of $92–97 k before any sustained advance
30 % chance of a deeper wash to $86 k
10 % chance of a clean breakout through $103 k toward $109 k+
Takeaways
• Long‑only allocators: add on a confirmed weekly close above $103 k; risk below $98 k
• Swing traders: fade spikes above $102 k toward $97 k; tighten stops if daily > $103 k
• Spot accumulators: schedule bids at $92 k and $86 k; avoid chasing upside extensions
Educational commentary, not investment advice. Manage position size and respect stops.

Bullish on $BTC🧠 Wyckoff Overview
🔻 This chart follows Accumulation Schematic #1 in Wyckoff theory.
🔻 The Spring phase (Phase C) is confirmed.
🔻 BTC has broken out from the accumulation zone.
🔻 We are now in Phase D, expecting a move into Phase E (new ATH).
📊 Technical Details
🔻 Accumulation zone: Around $72,000 – $88,000.
🔻 Spring (Phase C): A fakeout happened near $68,000, matching Wyckoff structure.
🔻 Breakout is confirmed after price moved above the downtrend line and Ichimoku cloud.
🔻 Main resistance: $95,000 – currently testing the supply zone.
🔻 Target: If breakout continues, BTC could reach a new ATH above $110,000.
📈 RSI and Volume
🔻 RSI at 66.71: Not overbought yet, still has room to go up.
🔻 Volume is increasing along with the breakout → shows strong buying pressure.
🎯 Personal Prediction
🔻 If BTC holds above $92,000 – $95,000 and continues to consolidate:
→ Short-term goal: $100,000
→ Mid-term goal (Wyckoff Phase E): $110,000 – $112,000

"New Hampshire Launches First State Crypto Reserve"On May 7, 2025, the state of New Hampshire made history by becoming the first U.S. state to legally establish a cryptocurrency reserve. This groundbreaking move allows up to 5% of the state’s treasury funds to be allocated to digital assets, starting with Bitcoin and other cryptocurrencies boasting a market capitalization exceeding $500 billion.
Why Is This Important?
Until now, even the most crypto-friendly states in the U.S. have limited themselves to business incentives and relaxed mining regulations. New Hampshire has taken a much bolder step by equating cryptocurrencies to traditional reserve assets like gold and treasury bonds. By doing so, it is effectively recognizing crypto as a long-term financial instrument and a hedge against macroeconomic volatility.
This means the state can use cryptocurrency holdings to diversify its financial base, preserve value, and potentially improve budget flexibility during economic shifts.
Security and Storage
The newly passed legislation specifies that crypto assets must be held either in certified custodial wallets or via regulated exchange-traded products (ETPs) approved by the Securities and Exchange Commission (SEC). This ensures a high level of security and regulatory compliance. In addition, the law mandates that crypto assets must be held for a minimum of 24 months to discourage short-term speculation.
Federal Context and Reactions
While President Trump has proposed the creation of a federal “Strategic Bitcoin Reserve,” the initiative has yet to be implemented. New Hampshire’s move places it ahead of the federal government and presents a model of state-level innovation in fiscal policy.
Many analysts believe this decision could lead to a wave of similar measures in other states, particularly those already supportive of blockchain technology, such as Texas, Wyoming, and Florida.
Potential Benefits
Economists say that integrating digital assets into the public financial system could help protect state funds against inflation, foster technological innovation, and attract new businesses and investors.
The move also sends a message to private sector players: New Hampshire is ready to embrace the future of finance. This could accelerate the migration of blockchain startups, fintechs, and institutional capital to the state.
Criticism and Concerns
As expected, not everyone supports the initiative. Critics argue that investing public money in such volatile assets is premature and risky, especially given the lack of federal regulation and the possibility of sharp market downturns. Some fear political fallout if the investment underperforms.
There are also concerns about transparency and the mechanisms for evaluating which digital assets qualify under the new framework, as only tokens with extremely high market caps are currently eligible.
Conclusion
By creating a cryptocurrency reserve, New Hampshire has taken a bold and symbolic step toward modernizing state finance. It may be too early to gauge the long-term outcome, but the state has clearly positioned itself as a leader in government-level crypto adoption. What began as a local initiative could soon become a national trend.

HelenP. I Bitcoin can make movement up and then start to fallHi folks today I'm prepared for you Bitcoin analytics. Price continues to move inside a rising wedge, gradually climbing higher while respecting the boundaries of the formation. After a strong impulsive breakout above the 93000 level, the market has entered a phase of sideways consolidation just below the upper boundary of the pattern. This area acts as a pressure zone, where bullish attempts are becoming weaker, and the price starts to lose momentum. What's important is how clearly the trend line has been respected, with multiple touchpoints confirming its significance. Recently, BTC tested the lower boundary of the wedge near 93000, rebounded, and made another push upward. However, despite this growth, the price is nearing the resistance formed by the wedge's upper boundary, and this structure often implies a potential reversal once the market loses steam. Given this setup, I expect BTCUSDT to reject the upper edge and correct toward 95000, my short-term goal. This level aligns with the trend line, making it a logical area for the price to seek equilibrium again. If you like my analytics you may support me with your like/comment ❤️

BTC - Ready for a breakout?Hey traders and investors!
On the 10-day chart, an intriguing situation is unfolding.
Sellers tested the Key Candle of the previous accumulation breakout — level 89,256, and the buyer’s initiative resumed.
Then, a manipulation (false breakout) occurred at the 89,256 test level. Volumes reveal the narrative: sellers sold off at high volumes, while buyers absorbed on declining volumes.
Now, a buyer zone has formed below, with the upper boundary at 99,475.
Just a few steps away from the ATH. A pullback is always possible, but for now, there are no signs of weakness (even a pullback to 89,256 wouldn't disrupt the bullish structure).
Now, the main question:
💡 How far up? +30,000?
This analysis is based on the Initiative Analysis concept (IA).
Wishing you profitable trades!

Manifestation Manifestation generally refers to the act of making something visible or real, often through the application of visualization, affirmation, and positive thinking, in the belief that this will increase its likelihood of happening. It can also describe the outward expression of something, like a disease, or a public demonstration.

Bitcoin resilience and momentum toward new highs?Bitcoin has demonstrated notable resilience in recent days, with price action maintaining a strong upward trajectory that suggests the potential for a move toward new all-time highs. This bullish momentum has persisted despite key resistance levels, signaling continued market strength.
Key Points to Consider:
- Bullish Market Structure**: The broader market continues to exhibit a bullish structure, characterized by higher highs and higher lows. This reinforces the ongoing uptrend and suggests that market participants remain optimistic.
- Key Highs Remain Intact**: Previous significant highs have not been breached to the downside, preserving the integrity of the bullish trend. This structural consistency indicates a healthy and sustainable rally.
- $104,300 – Major High Timeframe Resistance**: This level represents the last major resistance on the higher timeframes. A decisive break and close above this point would likely confirm a bullish continuation and open the door for price discovery beyond historical highs.
If buyers can sustain this momentum, the likelihood of a bullish expansion significantly increases. Importantly, there have been no clear signs of weakness — such as strong rejections or bearish reversal patterns — suggesting that market confidence remains robust.
Price action has consistently displayed strength, even at historically significant resistance zones. The absence of notable rejection at these levels is particularly telling, as it reflects strong demand and buying pressure. Such behavior often precedes continuation moves, provided volume supports the breakout.
A true corrective move or market pullback is likely to occur only after a **climactic volume node**, where excessive buying activity may lead to short-term exhaustion. Until then, the current trend appears well-supported by bullish sentiment.
However, **vigilance is crucial**. Once a correction does materialize — which is inevitable in any trending market — it may present a valuable "buy the dip" opportunity. During such phases, identifying and monitoring **key support zones** becomes critical to assessing the health of the trend and spotting optimal re-entry points.
Outlook:
For now, the momentum remains bullish, and higher prices are likely in the immediate short term. The market structure, strength at resistance, and absence of bearish signals all point toward the potential for further upside. Still, staying prepared for a correction and having a clear strategy for when it arrives will be essential for capitalizing on the next phase of the market cycle.

BTC Testing Critical Reclaim Zone on the 3D Chart
🚀 BTC 3D Timeframe Insight
📈 Bitcoin is pushing back into the upper region of its parallel channel, showing renewed strength after recent sideways action.
🛡️ Key Support Zone: Holding above the 99,500 – 100,500 area is vital for bulls to keep momentum alive.
⚠️ A solid close above this range could unlock the next leg up—continuation depends on this level holding firm.
👀 Price action around this zone will decide the next move—stay alert!

BITCOIN ( Is this the final DIP ? )I bought the dip but it just keeps dipping!
it's time to put on my bear glasses and check this ponzi chart !! oh yeah
As you can see in these patterns the moments everyone ready for breakout, bitcoin dumps to another lower level and kills all hopium that moonboyz, frog army and GM gurus got
if you think that you are person who manage to buy the exact number at dip you are wrong too, like people who bought at 60k and had plan to sell at 90k
RSI looks bearish like the pattern , I start shorting at 17490 and not going to close it till 16950$
If you got crypto on Huobi and Gemini exchange watch out too
funds are NOT safu

Bitcoin long Long setup for those who believe that btc breaks all time highs.
If Btc does what it is doing , she will not let you buy the dips , because dips will be pretty small.
I think 101500$ might be a nice area to place a long order followed by another one at 99k.
Let us see what this month will bring on the table.

BTCUSDT: Safe Zone Vs Risk Zone, Which one would you choose? Dear Traders,
WE have possible buying opportunities, with the first entry, the only reason that we think that price would reverse is, possible end of year bullish push which may take price to another record higher high. Although, since the price already has rejected we think price is unlikely to reject at the level, and may drop to 75k region.
good luck.


BTCUSDT Take ProfitThe BTCUSDT trade I shared 44 minutes ago has just hit take profit. Hope you took advantage of the opportunity 🙂

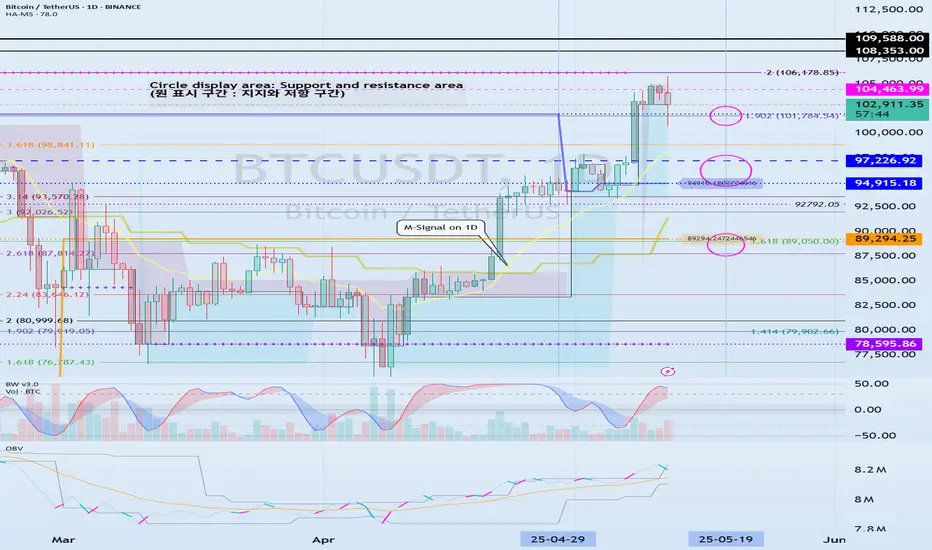
Important section: 101947.24-106133.74
Hello, traders.
If you "Follow", you can always get new information quickly.
Have a nice day today.
-------------------------------------
(BTCUSDT 1D chart)
It has touched the Fibonacci ratio 1.902 (101784.54) and is rising.
The key is whether it can receive support near the StochRSI 50 indicator (102971.99) and rise.
If not, it can fall to the 94915.18-97226.92 area.
Since the HA-Low indicator is formed at the 89294.25 point, it is important whether the price can be maintained above that point.
If the StochRSI indicator falls below the overbought range and then rises while moving sideways around the Fibonacci ratio range of 1.902 (101784.54) ~ 2 (106178.85), it is expected to renew the ATH.
Even if it falls more than expected, if it rises along the M-Signal indicator on the 1D chart, it is highly likely to renew the ATH.
----------------------------------------------------------
I will explain the newly added indicators, StochRSI 50, StochRSI 80, and StochRSI 20.
The disadvantage of interpreting the StochRSI indicator added as an auxiliary indicator is that it cannot determine the price movement.
Because of this, when interpreting the StochRSI indicator so far,
- Whether it is in the overbought or oversold zone,
- Whether StochRSI is above or below the 50 point,
we interpreted it as above.
Therefore, we added the price movement to the StochRSI indicator to check the movement more accurately.
-
The StochRSI 50 indicator is literally created when the StochRSI indicator passes the 50 point.
Therefore, we need to think about a response plan based on the price StochRSI 50 indicator.
-
The fact that StochRSI 80 is created means that the StochRSI indicator has risen above 80.
Therefore, in order to continue the upward trend, StochRSI must rise above 80.
If StochRSI 80 is not created and only StochRSI 20 is created, the upward trend will occur when the price is maintained above the StochRSI 50 indicator.
-
The fact that StochRSI 20 was created means that the StochRSI indicator has fallen below 20.
Therefore, in order to continue the downtrend, it must fall below StochRSI 20.
If StochRSI 20 is not created and only StochRSI 80 is created, the downtrend will occur when the price is maintained below the StochRSI 50 indicator.
-
Thank you for reading to the end.
I hope you have a successful trade.
--------------------------------------------------
- This is an explanation of the big picture.
I used TradingView's INDEX chart to check the entire range of BTC.
I rewrote the previous chart to update it by touching the Fibonacci ratio range of 1.902 (101875.70) ~ 2 (106275.10).
(Previous BTCUSD 12M chart)
Looking at the big picture, it seems to have been following a pattern since 2015.
In other words, it is a pattern that maintains a 3-year bull market and faces a 1-year bear market.
Accordingly, the bull market is expected to continue until 2025.
-
(Current BTCUSD 12M chart)
Based on the currently written Fibonacci ratio, it is displayed up to 3.618 (178910.15).
It is expected that it will not fall again below the Fibonacci ratio of 0.618 (44234.54).
(BTCUSDT 12M chart)
I think it is around 42283.58 when looking at the BTCUSDT chart.
-
I will explain it again with the BTCUSD chart.
The Fibonacci ratio ranges marked in the light green boxes, 1.902 (101875.70) ~ 2 (106275.10) and 3 (151166.97) ~ 3.14 (157451.83), are expected to be important support and resistance ranges.
In other words, it seems likely to act as a volume profile range.
Therefore, in order to break through this section upward, I think the point to watch is whether it can rise with support near the Fibonacci ratios of 1.618 (89126.41) and 2.618 (134018.28).
Therefore, the maximum rising section in 2025 is expected to be the 3 (151166.97) ~ 3.14 (157451.83) section.
To do that, we need to look at whether it can rise with support near 2.618 (134018.28).
If it falls after the bull market in 2025, we don't know how far it will fall, but considering the previous decline, we expect it to fall by about -60% to -70%.
So, if the decline starts near the Fibonacci ratio 3.14 (157451.83), it seems likely that it will fall to around Fibonacci 0.618 (44234.54).
I will explain more details when the downtrend starts.
------------------------------------------------------
BTC - Ranges overview (update) Let's get back to BTC and let's see how the pa moved in the past days.
As we noted previously IF we held the HTF FVG (yellow box) we should expect to trade back towards 90K-100K.
We held perfectly and traded back towards our target. Hopefully the scalpers amongst you guys managed to get some nice entries (feel free to go back to the previous idea and watch how we managed to call out the 'bottom'.
What is next...
IF we 100K expect us to aggressively trade towards price discovery and new all time highs.
IF we fail to hold 90K expect us to trade back towards 80K.
Pretty simple...BE PATIENT...LET THE MARKET SHOW YOU ITS HAND...AND TRADE WITH IT.
Stay safe and never risk more than 1-5% of your capital per trade. The following analysis is merely a price action based analysis and does not constitute financial advice in any form.
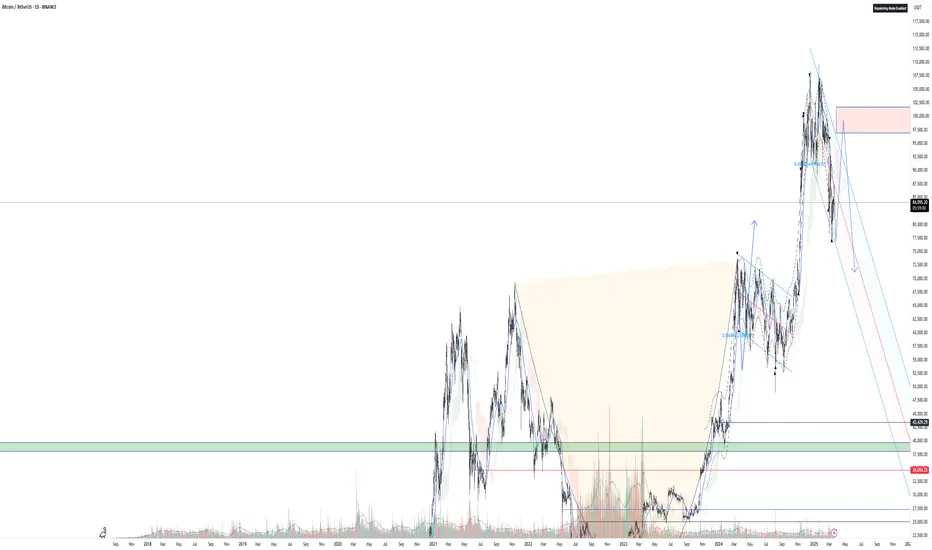
BITCOIN TO $140KAccording to this weekly chart I have, bitcoin has a very important trendline that no one pay attention to, which gives us a very strong resistance about $134k to $140k , depends when bitcoin touch that, and I expect a big rejection from that area.

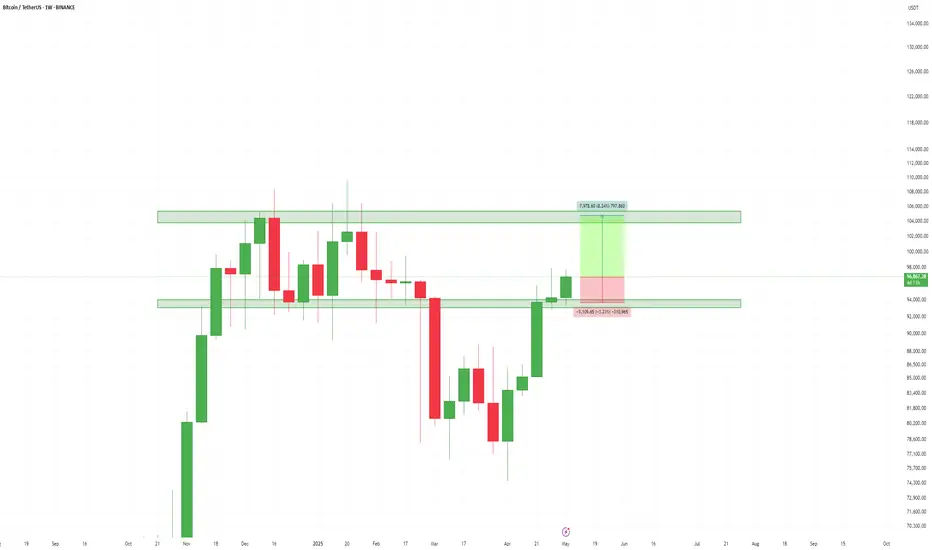
BTC at a Crossroads: Bull Trap or Moon Mission?A possible bearish scenario is playing out on BTC, but hey—just one of many possibilities before the real bloodbath begins. 👀 This could just be a classic trap to lure people in before shaking them out. The key resistance zone is between GETTEX:97K and $101K, a big range to clear. If we flip it and close above $102K on the weekly, that would be amazing—but let’s be real, we’ll need a strong catalyst for that. If we do, then we’re likely talking about the $120K range.
On the flip side, if we drop lower from here, the most obvious support sits at $72K. Below that… well, let’s just say we don’t wanna go there—next real support isn’t until $50K. For everyone’s sake, let’s hope we don’t see those levels. Big decision point ahead—let’s see who wins this battle! ⚔️🚀

BTC Breaks 95K — What's Next?Bitcoin has finally broken above the tough resistance level at $95,000 , a level we’ve struggled to conquer for the past 15 days. It's now trading around $96,800 , and the bullish momentum appears to be building.
I believe this momentum could carry the price beyond GETTEX:97K – GETTEX:98K , potentially leading us to the next major resistance zone at $100,000.
However, $100K won't be easy to break. Expect significant profit-taking around that level, as we’ve seen in the past. Our previous failure to break above it led to a bloody market throughout 2024. While this time could be different, remember: $100K is a massive resistance wall.
Altcoins, meanwhile, have lost a bit of momentum, as capital has been flowing steadily into BTC. As Bitcoin gains strength and dominance, altcoins are temporarily being pushed to the sidelines.
But don’t lose hope— incredible altcoin opportunities are coming soon.
Stay tuned.
When to buy BTC again?BTC has two resistance levels on its way to reaching $120k. Another upward rally will follow if BTC consolidates above the $119.730 line. I'll add the two targets and update the chart in that case.

