When to buy BTC again?BTC has two resistance levels on its way to reaching $120k. Another upward rally will follow if BTC consolidates above the $119.730 line. I'll add the two targets and update the chart in that case.
BTCUSDT.PS trade ideas

$BTC go to 142000🪙 Bitcoin Analysis - Daily Timeframe
🚀 Entry Point:
The ideal buy entry is at $96,302, where we have a confluence of the 0.618 Fibonacci level, FVG, and a Breaker Block. This zone could trigger buy orders and potentially push Bitcoin towards the first target at its previous all-time high of $109,000, and ultimately to the final target at $142,650.
🔴 Critical Support:
The current support level is $93,947.
If a daily candle closes below this level, a bearish structure will form, opening the door for further decline to the next support at $85,000.
💡 Trading Signal: ❤️
Buy Limit: $96,302
Stop Loss: $93,347
Take Profit Targets: $109,000 - $142,000
🔵 Risk Management:
Risk only 1% of your capital in this trade.
Adjust margin size so that in case the stop loss is hit, your account loss will not exceed 1%.
This is a Swing Trade setup. Stay disciplined and manage your risk effectively. ✅


BTC - Ranges overview (update) Let's get back to BTC and let's see how the pa moved in the past days.
As we noted previously IF we held the HTF FVG (yellow box) we should expect to trade back towards 90K-100K.
We held perfectly and traded back towards our target. Hopefully the scalpers amongst you guys managed to get some nice entries (feel free to go back to the previous idea and watch how we managed to call out the 'bottom'.
What is next...
IF we 100K expect us to aggressively trade towards price discovery and new all time highs.
IF we fail to hold 90K expect us to trade back towards 80K.
Pretty simple...BE PATIENT...LET THE MARKET SHOW YOU ITS HAND...AND TRADE WITH IT.
Stay safe and never risk more than 1-5% of your capital per trade. The following analysis is merely a price action based analysis and does not constitute financial advice in any form.
Support to be testedIf that green box of support is any indicator, we will see if bulls hold strong between 91.5k and 92.8k
If support is broken, next level of support could be 88.3k to 89.5k
Share your thoughts -- are we still in a bear market or to the moon from here?

BTCUSD 1H CHART PATTERNThis chart shows the BTC/USDT (Bitcoin/Tether) 1-hour time frame, and it includes a falling channel (bearish trend) highlighted in red. The price has moved consistently downward within this channel. However, a blue upward arrow suggests a potential bullish breakout

BTC – Waterfall?Price rejecting after Friday's blow-out.
Flow wise it's not that sellers stepped in, more like the one or few buyers that were buying with no regard for price, finally stopped buying. Price is mean reverting here, looking for balance again.
Notice how H4 trend stopped supporting price, and now became resistance over the weekend, after which price flushed for the first time.
A correction to mid-high 80s would be very healthy and the best case scenario for bulls imo. Reset momentum and positioning a bit while making a higher low.
If we yearly open and local lows hold here, we can look for a short setup.
Also note that the highs are pretty bad, a push into +95k might trigger a lot of short stops and give us a quick move above the highs. Be careful with getting or staying bullish there, unless price is slow grinding up above the high, it is very likely just a fake-out.

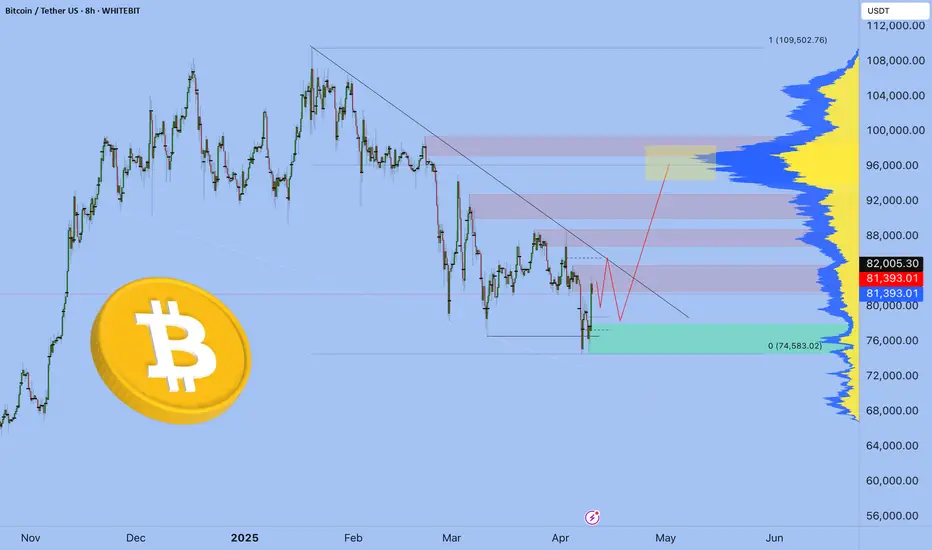
Bitcoin Ascending Broadening Wedge (4H)After a clean breakout above the macro downtrend, BINANCE:BTCUSDT rallied into its supply zone — but price action has since become increasingly volatile, forming a rising broadening wedge (also known as a megaphone pattern).
Pattern Insights
• The structure is defined by diverging trendlines, with each swing becoming larger and more erratic.
• This pattern often signals instability or exhaustion, especially near key resistance.
• While it can break either way, broadening wedges in an uptrend frequently resolve to the downside, especially when supply is overhead.
Key Levels
• Resistance: ~$ 98K-$99.5k supply zone — the upper boundary of the pattern.
• Support: ~$93.5k area — prior S/R, potential flip zone.
• Reversal: A breakdown below ~$93k could confirm a short-term bearish resolution and open the door to ~$88.5k.
• Continuation: A breakout above the upper boundary with volume could trap shorts and ignite a squeeze toward new highs.
Until then, BTC remains in a high-volatility structure, best approached with caution or as a range-trading opportunity.

Bitcoin - LONG playedout!! NEW Entry!!Bitcoin - LONG playedout!! NEW Entry!!
price bounced from VAL as we expected
now it's time to tise
follow thetrned until clear reversal

BTC USDT LONG POSITION SETUPBTC is currently holding a strong support level , with a high probability of the price moving upwards. Additionally, other indicators, such as the 100 EMA, are also acting as support .

$BTC support zoneCRYPTOCAP:BTC has broken out of a falling wedge and is now consolidating above the key $91K support zone.
- Eyes are now on the All-Time High at $ 109 K.
- Once that breaks, a price discovery rally toward $ 120k+
It is highly likely. 🧠
- The chart looks.
DYRO, NFA

BTCUSDTWe broke the ascending channel downwards and retested. I expect a drop to 88765.43 levels. I will wait for the candle to close below 93514.10 below the last bottom to enter the position.

Bitcoin soon again 100K$(any breakout there can cause huge pump)As we can see technically we have last and major resistance zone ahead which is 100K$ resistance zone and also red trendline sell pressure is exactly there But we can also expect breakout to the upside and more pump in next weeks and even new possible ATH at least near 120K$.
Notice: 100K$ is now major resistance and we may have short-term fall or range near this resistances zone but soon or late the breakout with pump is coming.
DISCLAIMER: ((trade based on your own decision))
<<press like👍 if you enjoy💚

Bitcoin update 10.04.2025 - BTC - 98k in May🔥 The Markets Are on Fire — and We Know Who Lit the Match.
The last few weeks have been pure chaos.
Markets are crashing, confidence is shaking, and crypto is confused.
And let’s not pretend we don’t know who’s behind it.
Donald Trump.
Even a Korean guy selling panda souvenirs on the street told me:
“This Trump is ruining everything.”
And he’s not wrong.
Billions wiped. Positions wrecked.
But here’s the thing — this isn’t random. This is tactical drama.
Trump sees himself as a master negotiator, and here’s how he plays the game:
🎭 The Trump Cycle (Get Ready for the Loop)
Pressure — tariffs, chaos, media hysteria. We’ve seen it.
Relaxation — 90-day delays, fake calm.
Talks — and boom, “positive developments.”
Good News —
• “Bitcoin added to U.S. reserves.” in MAY?
• “Americans to receive new stimulus.”
• “China’s our friend again!”
Charm & Flirt Mode — improving global relations, smiling at cameras.
More good news — stock markets fly, crypto rips and everyone screams, “New bull run!”
And then?
💥 Back to pressure.
📆 September 2025 is the punchline.
That's when this cycle hits the weaker economies like a freight train:
✅ Broken supply chains
✅ Collapsing currencies
✅ Defaults
✅ And where there’s chaos — there’s war. Expect escalation in fragile regions like the Middle East.
✅ Crude oil falling to 40$
Markets will top on pure euphoria.
The reversal begins when everyone’s drunk on hopium and “good news”.
💼 My Plan? Ruthlessly Simple:
🔹 May I will participate in the first Offline/Online International Crypto Trading Cup 2025 by WhiteBIT
🔹Jun-August -Euphoria in the market
🔹 September - Take profits
🔹 Either short — or sip something cold on a quiet beach. But we will see
We’ve officially entered the Turbulence Zone.
The following 10 years will be insane — for those who adapt, evolve, ride the trends, and harness AI and tech.
If not?
You get left behind.
It’s not the strongest who survive — it’s the fastest to adapt.
Best regards, EXCAVO
$BTC Update – Bearish Breakdown Alert! 🔻 🔻
BTC is breaking below the rising parallel channel on the 4H chart — a bearish signal suggesting potential downside pressure.
🔸 Price: $93,821
🔸 Channel Support Broken: ~ $94,500
🔸 Immediate Downside Target: $89,992
🔸 Stop Loss for Shorts: Above $95,715
⚠️ Warning: Avoid aggressive long entries unless BTC reclaims the channel support. Momentum is currently favoring the bears.

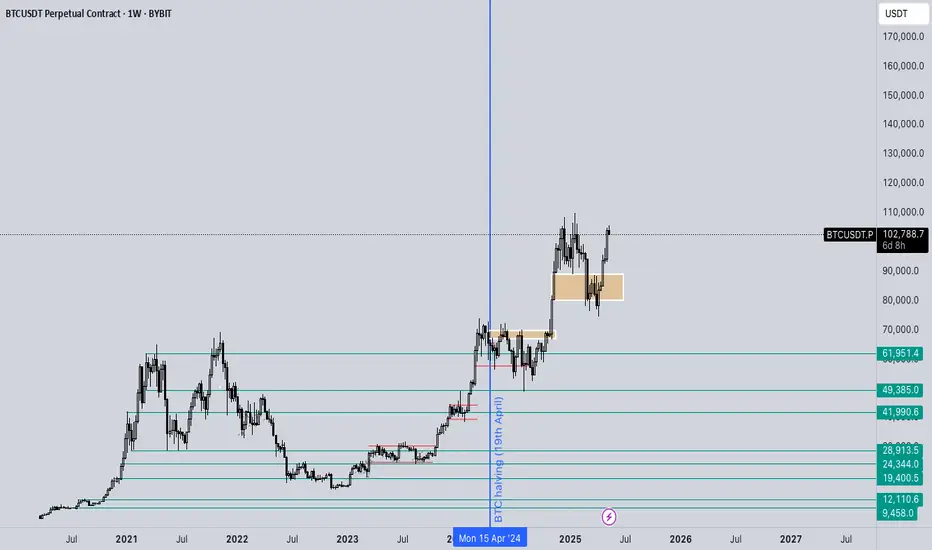
BTC/USDT – Weekly Chart Analysis (Long-Term View)BTC/USDT Chart Pattern: Multi-Year Cup and Handle Formation
The chart shows a textbook “cup and handle” formation, a highly reliable bullish continuation pattern. This pattern has played out over several years (2021-2025), indicating long-term accumulation and a breakout attempt.
Cup Phase:
Extended from mid-2021 to early 2024.
Formed a deep and rounded base, often indicating institutional accumulation.
The rounded lows reflect a gradual sentiment recovery from the 2022-2023 bear market.
Handle Phase:
A short-term consolidation after moving above the $70,000-$74,000 resistance area.
Price action pulled back marginally after hitting $110,000, forming higher lows near $85,000.
The structure resembles a bull flag or pennant, which is usually seen before the next upward move.
Key Support and Resistance Areas:
Key Support $70,000–$74,000. Previous resistance turned into support
Psychological Support $85,000 Local Retracement Low
Immediate Resistance $100,000–$110,000 Near ATH, selling pressure area
Long-term Target $130,000+ Measured move from cup pattern
Volume: Volume was high during the breakout from late 2024 to early 2025, which validates the breakout from the cup resistance area.
If BTC breaks above $100,000–$110,000 with strong volumes, we can expect continuation towards:
$130,000 (short-term target)
$150,000–$180,000 (extension based on pattern symmetry)
Bearish Risks:
Failure to hold $85,000 could lead to a retest of the $70K support area.
Sustained breakdown below $70K would invalidate the bullish pattern, but this seems unlikely given the strong fundamentals and macro structure.
If you found this analysis helpful, hit the Like button and share your thoughts or questions in the comments below. Your feedback matters!
Thanks for your support!
DYOR. NFA

Bitcoin Long Long from 94350$ region.
There is a npoc level at that region .
Also there is a gap at around 97.2k to be filled .
Target remain 97.2k.

Bitcoin Technical Analysis: Bearish Continuation with $95,200 TP
Looking at the Bitcoin/TetherUS chart from TradingView dated May 3, 2025, I can see a clear short-term bearish trend forming with several notable technical patterns.
The price is currently around $96,158.01, showing a decline of -0.17% with a volume drop of -0.75%. Let me correct my analysis for a short position:
KEY Technical Observations
- A descending channel has formed after rejection from the $97,200 resistance level
- Price is breaking down from a consolidation area around $96,327-$96,419
- The green shaded area indicates a projected downward movement targeting $95,349.80
- Consecutive red candles with increasing body size suggest accelerating bearish momentum
Trading Opportunity - SHORT POSITION
This setup presents a bearish continuation pattern with the following take-profit targets:
- TP1: $95,800 (initial target within the projection)
- TP2: $95,350 (projected bottom as indicated by the green zone)
- TP3: $95,200 (key horizontal support line)
Entry point for shorts would be on any retest of the $96,327 resistance (previous support now turned resistance).
Creative Strategy: The Emerald Descent
The green projection zone appears to be forecasting a controlled drop toward the $95,200-$95,350 area. This well-defined bearish channel presents an opportunity to ride the momentum down to these targets.
Set a stop loss above $96,600 to protect against unexpected upside movements.
The declining volume (-0.75%) suggests this move is a continuation rather than a panic sell, making it a more predictable technical play rather than an emotional reaction.

Bloody newsThe news the news the news the bloody news r behind the corner🫣
Engulfing saturday Daily @....

A massive f-you move from BTC....??Takes out the relative equal lows of Monday's range.
Bulls get wiped out.


Bitcoin: Strong Support —Back To BasicsNotice the black lines on this chart...
The lower line marks the January 2025 wick low.
The second line, a bit higher, matches the December-November 2024 wick low.
Last week Bitcoin smashed this resistance range and is now safely trading above it. The break of this support turned resistance turned once more support is a major bullish development.
The action as it is happening now on the weekly timeframe puts Bitcoin back in the same conditions as before the March 2025 breakdown.
Notice the entire period after the March 2025 breakdown and April recovery, this is a classic stop-loss hunt event, liquidity hunt or bear-trap. The action moved below support just to quickly recover.
This can also be read as a "failed signal."
The bears attempted to move the market lower but failed. A failed signal turns into a strong signal contrary to the initial direction of the move. So if this is a failed bearish signal it translate from a TA perspective into a strong bullish signal. This works because it reveals a double-bullish dynamic. The failed bearish continuation after breakdown reveals bears weakness, the successful recovery reveals bullish strength; two points for the bulls.
Now, the active weekly candle/session did not wick lower to test the "strong support" price range, between $89,250 and $90,500, black lines on the chart, no, instead the action is happening safely above this range.
Bitcoin is super strong right now. Strong support.
If Bitcoin were to move lower and challenge this support zone, this would become a unique opportunity, a very strong opportunity, an amazing opportunity to buy LONG with high leverage or simply accumulate more if you are spot.
If it drops, awesome, a unique buy opportunity.
If it continues higher right away we are good because Bitcoin has been green four weeks straight.
It doesn't get any better and we have the support of the entire Altcoins market which is starting to heat up. I told you we would see slow steady growth, it doesn't happen in a day because are in a long-term bullish phase but oh boy, oh boy, oh girl oh boy it will grow.
By late May 2025, everything will be green 2-3 levels up. That is, minimum 200%-300% up and that is just the start. You've been warned.
Thanks a lot for your continued support.
Feel free to follow if you enjoy the content.
Namaste.

Bitcoin short from 98200$This is how i think the market will react starting from next week .
Close NPOC print at 98k and then we have a Npoc print at 88k in binance futures, but in bitmex futures it is around 91.2k . Either way a drop is a must to shake everyone .
