BITCOIN → Consolidation or reversal? Why is $ 95000 important?BINANCE:BTCUSD held up quite strongly during the tariff war and largely weathered the storm, while the stock market and indices were in free fall. The improvement in the fundamental situation has once again heightened interest in the asset among traders and investors.
Earlier, I pointed out that against the backdrop of falling markets (due to Trump's policies and tariff wars), Bitcoin is holding up fairly well. It cannot be compared to gold, which maintains its status as a safe haven, but overall it has stayed out of the 73K risk zone.
Countries are continuing negotiations in the US, which generally points to an improvement in the trade situation, but all attention remains on relations between China and the US, and a resolution may be close.
Technically, on the daily/weekly timeframe, the price has broken through the trend resistance and the asset has moved from the sell zone to the buy zone, which in general only increases interest in the flagship. Bitcoin is stuck in the 95K-92K range. A false breakout of resistance provokes a correction, and now we need to monitor the price and see where the correction will stop. This will show us important support that could become the basis for consolidation.
Resistance levels: 95K, 100K, 102.5K
Support levels: 93.5, 92.9, 92, 91K
To break through 95K and continue growing, Bitcoin must form consolidation. There is none at the moment, and a correction and halt may indicate the approximate boundaries of consolidation. However, the focus is on 95 - 93.5 - 92K. If the price manages to stay within the local boundaries and continues to storm the 95K resistance, we will have a chance for a breakthrough and continued growth to 100K. Otherwise, Bitcoin may form a deeper correction, for example to 91-88K
Best regards, R. Linda!
BTCUSDT.PS trade ideas

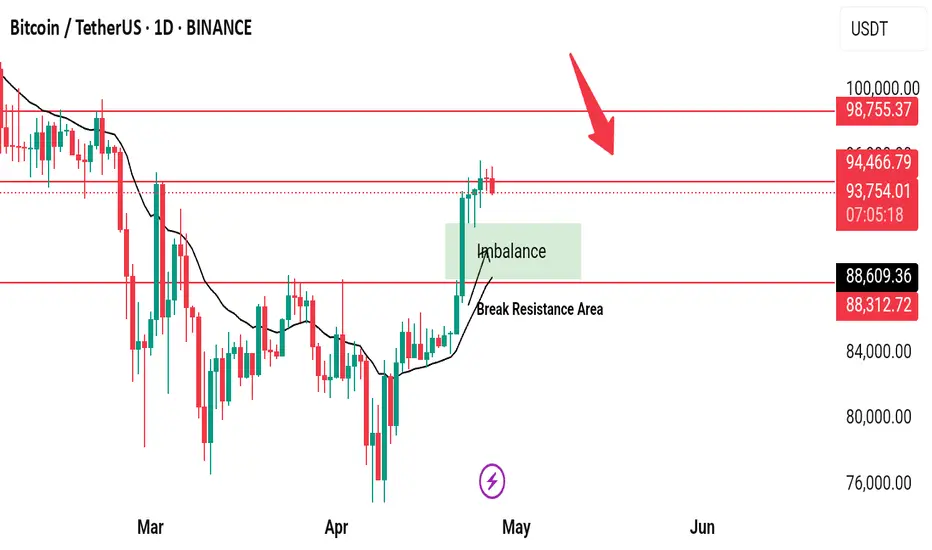
Watching closely $93,900 level.BTCUSDT Weekly Update
Bitcoin has successfully broken through its previous resistance area and is currently testing a new resistance zone. We are closely watching the $93,900 level. If the market provides confirmation of a rejection or reversal at this level, we will consider entering a short position targeting the marked FVG (Fair Value Gap) zone.
This FVG is a bullish imbalance zone, which previously contributed to market momentum. If the price moves lower, we plan to exit short positions near the FVG zone and look for confirmation to enter buy-side trades, aligning with the existing bullish market structure.
Let's closely monitor these levels throughout the week. If price action aligns, we anticipate strong trading opportunities on both sides of the market.
#BTC #BTCUSD #BTCUSDT #BITCOIN #Wyckoff #Analysis #Eddy#BTC #BTCUSD #BTCUSDT #BITCOIN #Wyckoff #Analysis #Eddy
This analysis is based on the analytical style of the Wyckoff Distribution Structure of Schematics 1 and 2.
I have outlined for you the important parts of the Wyckoff style on the one-hour timeframe.
Currently, we are in Phase C of the Wyckoff Distribution Structure.
We have to wait for the completion of this phase and the start of Phase D of the Wyckoff Distribution Structure.
When will this structure be fully confirmed? When the Bitcoin price falls to the 91800 support and gathers the final spring when this support is broken for the fall, we will enter a short position by getting the necessary confirmations based on our style and strategy.
💬 Note: It is not exactly clear whether the market maker will act based on Schematic 1 or 2, so the best entry point for short positions will be the 91800 support break. If, based on the schematic 1, the Bitcoin price UTAD and test formed, high-risk traders who are willing to trade in the opposite direction can enter a short position by getting confirmation in the time frames below 15 minutes.
Where will the targets be? The first target is 62000 and the second target can be 46000 dollars.
When can you safely close the position and enter a reverse trade, that is, long or buy? When a Wyckoff accumulation structure is formed at one of the targets.
The responsibility for the trade is yours and I have no responsibility for your failure to comply with the risk and capital management.
Good luck and be profitable.
I also invite you to review and view my latest analysis on Bitcoin via the link below:
For altcoins, follow my analysis on the Total 3 chart.
My analysis of the Total 3 chart:

BTC - BIG WEEK!Last week there was clear evidence of big purchases being made on the spot market, notably on coinbase.
The question we're forced to ask ourselves here is: was this the start of a longer duration trend, or is it a one-off and should we expect some level of mean reversion next?
Comparing it to other instances, there is only one in the last year where price really kept trending like this: The November post election rally.
If we map out what that price action would look like here (blue), we can expect the 91.5k low to hold and look for a HL somewhere in the H4 trend area. If trend is strong, I would not expect this to trade below the small range poc here for long, or even at all. That level is sitting at around 93.4k, which is also the previous weekly range VAL and yearly open. If we get a sweep of the highs and price is again failing to make a LL but consolidates in the 95k area, we can expect some expansion higher still.
That is not to say we can pull back deeper and still rally after, I'm just projecting November price action on the current chart.
If we do get a pullback, it means we lost H4 trend so we look at EMA 100 and 200 next. These line up with the lower range VAH and filling the higher imbalance. It is already a lot less bullish, but I would look for a reaction there anyway. 88.5-9k is probably the line in the sand there.
Any acceptance back below the 10-200 ema cluster, then we get back into lower range VA and expect rotation to at least poc. Honestly I'd think we rotate all the way to VAL and clean up all the imbalances, possibly correct the equal lows at 74k.
I have no real bias as to what we're about to get. Blue seems like an easily invalidated play, so I'm playing that one but at the same time try to fish for top shorts in case we do get a bigger rotation down. Either I get stopped on the long and play for a big move down, or I get stopped on the shorts and look for expansion towards 100k.

Is the Crypto Market Broken ?It’s no secret — the crypto world isn’t what it used to be. A few years ago, it felt like an open frontier where anyone could jump in and strike gold. Today, the crypto space has changed dramatically. The market has become much more competitive , and the days of easy wins are largely behind us.
One of the biggest issues is manipulation. The crypto market is now heavily influenced by " whales who hold massive amounts of coins and have the power to move prices with a single trade. They can trigger panic selling or hype buying, all while positioning themselves to profit, often at the expense of smaller investors.
And that brings us to another hard truth: money in crypto tends to flow from the many to the few . Inexperienced and poorly informed traders often get caught up in hype or fear , making emotional decisions. Meanwhile, wealthy investors use strategy, patience, and insider knowledge to grow their holdings.
In short, while the crypto market isn’t necessarily “broken,” it’s definitely no longer a level playing field. If you’re thinking of jumping in, it’s more important than ever to stay educated, cautious, and aware of the forces at play.
BITSTAMP:BTCUSD COINBASE:BTCUSDT CRYPTOCAP:BTC.D CRYPTOCAP:TOTAL CRYPTOCAP:BTC

#BTCUSDT: From $74,000 to $88,000 Moving Well! More Growth CominIt’s been on a steady climb from $74,000 to $88,000. We’re expecting even more growth in the coming weeks. The price has finally broken free from its consolidation phase and is now on the rise. We think it’ll reach $94,000, then $100,000, and maybe even go up to $120,000 by the end of the year.
What do you think? Let me know in the comments below!
Thanks!
Team Setupsfx_

Is the Market Setting You Up? My BTC Manipulation TheoryEveryone’s hyped about BTC’s run — but is this rally legit, or just another carefully staged trap? Let’s break it down…
BTC, as well as other cryptocurrencies, have been performing well lately — but the big question remains: “Is this manipulation?”
Well, here’s my take.
Whenever a piece of news drops — whether it’s from regulators, governments, or financial figures — it affects crypto prices, positively or negatively. The Trump and Fed saga might be playing a part here, but I believe our collective participation has also fueled the price movement. Now with institutions stepping into our space, there’s a new problem.
Now to business.
On the chart, I’ve outlined key routes and zones from the weekly down to the 4H timeframe to help answer this question.
On the weekly timeframe, BTC fought hard and bounced off an area of imbalance. During this HTF rebalancing, it created a strong sell-side liquidity area on the 4H timeframe. There was also a period of consolidation — which shouldn’t be ignored, because it holds clues to our big question.
After this accumulation phase (which happens on all zones, because time is fractal), BTC took liquidity to the upside — making what I believe is a manipulative move.
Now, on the 4H chart, you’ll notice a sort of rebalance happening. It’ll most likely drop down to the TSE:RE zone I marked, to hit stop-losses set by the bulls, tricking people into thinking we’ve gone bearish — only to trap them again before distribution occurs (you might lose it at this point, lol).
So — we’ve identified potential market manipulation.
If this theory holds, where might distribution take place?
I’ve marked out possible areas, and it’s most likely within the $93k - $99k region.
Why?
These zones hold a significant chunk of pending orders.
BTC hitting $99k will get everyone thinking the bears are finished — perfect for a trap.
NB: Don’t expect this all to happen in a day or a week… lol.
Disclaimer: This isn’t financial advice — just my observation.
Hope it was easy enough to follow.
LEAVE A FOLLOW AND A BOOST!

#BTC #BTCUSD #BTCUSDT #BITCOIN #Update #Analysis #Eddy#BTC #BTCUSD #BTCUSDT #BITCOIN #Update #Analysis #Eddy
I have identified the important support and resistance areas of the weekly timeframe for you.
I have identified the important resistance prices for the start of the decline with the red line and the important support prices for the start of the growth with the green line.
This analysis is based on a combination of different styles, including the volume style with the ict style.
Based on your strategy and style, get the necessary confirmations for this analysis to enter the trade.
Don't forget about risk and capital management.
The responsibility for the transaction is yours and I have no responsibility for your failure to comply with your risk and capital management.
💬 Note: An important analysis will be presented on the lower timeframe on Bitcoin soon, which, based on the chart and explanations sent in that analysis, you can hunt for Bitcoin's decline by getting confirmation, pay attention to the current chart and consider important liquidity, including the Decision and Extreme areas.
Be successful and profitable.
For altcoins, proceed according to my analysis on the Total 3 chart.
My analysis of the Total 3 chart:
You can also view and review my previous analyses on my TradingView page.
Please don't forget to like and follow, your support encourages me to continue on my path and provide more analysis and updates.

BTC started the impulsive moveBitcoin exchange conditions on the daily time frame are very tempting for buying. With a pullback to the price range of 88,000, you can expect a large volume entry and numbers above $100,000.


Accumulation Underway: Bitcoin’s Next Move Could Be ViolentBitcoin has shown a strong recovery after reclaiming the 50 EMA, which had been a major dynamic resistance across multiple levels. After accumulating between $83,000–$87,000, BTC broke out sharply and is now consolidating again just below a major resistance zone at $95,000–$97,000.
The current price action shows another accumulation phase just under resistance — similar to the previous pattern before the breakout.
A clean breakout above this resistance zone could explode Bitcoin toward $100,000+.
On the downside, if rejection occurs, the 50 EMA around $87,000 could act as strong support once again.

BTC: Start shorting
BTC has begun testing the key resistance level of 96,000. Shorting can begin when it reaches this area.
All the signals I sent have been profitable, and I will continue to send accurate signals.
btcusdt sell@96000-96500
tp:94000-92000

BITCOIN - Price can exit from wedge and rise to $100K levelHi guys, this is my overview for BTCUSDT, feel free to check it and write your feedback in comments👊
Some days ago price reached resistance line of triangle and then, in a short time, declined to $80300 level.
Price broke $92000 level and then some time traded inside triangle, where it reached this level again and then corrected.
Later BTC exited from triangle and entered to wedge, where it first declined below $80300 level, but later turned back.
Then it continued to move up inside wegde, where it later made correction to support line and then rose to $92000 level.
Soon, price broke this level and even reached resistance line of wegde, after which it corrected and continues to rise.
Possibly, price can bounce up from support area to $100K, thereby exiting from wedge pattern.
If this post is useful to you, you can support me with like/boost and advice in comments❤️

Bitcoin Trading and Investment Strategy (April 2025)Bitcoin (BTC) is trading around the mid-$90,000s after rebounding ~25% in April, with market sentiment shifting to greed. BTC’s dominance is high (~64%) as capital concentrates in Bitcoin over altcoins. On-chain data shows large holders (“whales”) aggressively accumulating, even as short-term traders turn optimistic. Below is an actionable strategy.
BTC broke out of a multi-month falling wedge pattern, signaling a potential bullish reversal. On the 1H/4H charts, momentum is bullish: a textbook double-bottom formed on the daily with a neckline around $87,600 was breached, confirming upside targets near $100,600.
A bull pennant consolidation is visible on the 1H after the sharp rally, hinting at another leg up (measured move target ≈ $100,900 on breakout). Short-term EMAs (20/50) on 1H/4H have turned upward and are stacked bullishly, aligning with the daily 50 and 200 EMAs which have flipped into support. The Relative Strength Index (RSI) is in bullish territory without extreme overbought readings, leaving room for further upside. Volume has been steady to rising on upward moves, indicating buyers remain in control.
Immediate support lies at the breakout zone of GETTEX:87K –$90K (prior resistance now turned support). This area includes the daily double-bottom neckline (~$87.6K) and coincides with the top of the earlier consolidation range. Bulls want to see this zone hold on any pullback. Below that, secondary support is around $84K and roughly the 4H 200 EMA area.
Resistance is clustered at $94K–$95K (recent local high region). A 4H close above $95K with strong volume would likely trigger momentum buyers. Beyond there, $100K is a major psychological level and the short-term target from multiple patterns – importantly, a dense cluster of short seller liquidation levels sits around $100K, making it a “liquidity magnet” for market makers. Expect heavy order flow and possible volatility as BTC approaches six figures. Above $100K, minor resistance could appear near ~$102K (projected wedge target), then prior ATH ~$108K–$109K.
For longs, scale out profits in layers as BTC advances. First TP around $100K – just before the round number – to avoid slippage if a wave of selling hits there. If momentum is very strong, hold a portion for a possible extension to $102K–$105K (wedge target zone). A stretch goal for bulls would be the $108–$110K area (all-time high region), but tighten stops well before this level as profit-taking is expected near ATH.
If BTC falls back under the GETTEX:87K neckline after having broken out, it would negate the double-bottom breakout and likely accelerate downward. Thus, stop-losses for longs can be placed just below GETTEX:87K (e.g. $86K) to cap risk.
The breakout from the wedge/base was accompanied by a surge in volume, confirming institutional participation. Volume has not dried up on this rally – a positive sign that the trend could sustain. Overall, the daily chart structure sets the stage for a potential run back to five-figure territory (100K+), provided key support levels are defended.
Any dips into the high-$80Ks are buy-the-dip opportunities as long as BTC quickly reclaims $90K. Below GETTEX:87K , the next critical support is $80K–$84K. $84K was highlighted as a crucial level – failure to hold 84K during the last pullback would have signaled capitulation. It held then, so watch it on any retest.
Stop Loss:
Short-Term: 5–10% below entry ($90,000 for $92,500 entry).
Mid-Term: 10–15% below entry ($85,000 for $91,000 entry).
Long-Term: Monitor support ($80,000) but hold unless fundamentals deteriorate.
Position Sizing:
Short-Term: 1–2% of portfolio per trade.
Mid-Term: 5% of portfolio.
Long-Term: Up to 10% of portfolio.
Risk/Reward: Target 2R for short-term, 3R for mid-term, and let long-term investments ride based on fundamentals.
Not a financial advice. DYOR.

TradeCityPro | Bitcoin Daily Analysis #74👋 Welcome to TradeCity Pro!
Let's move on to Bitcoin and major crypto index analysis. As usual in this analysis, I want to review the triggers for the New York futures session for you.
⏳ 1-Hour Timeframe
In the 1-hour timeframe, as you can see, after the price was rejected from the 95306 area, it formed a short-term box between 93898 and 95306, and currently, the price is moving out of this box.
✔️ As you can see, after a large red candle and a second rejection from 95306, a lot of bearish momentum and selling volume entered the market, and now the price has broken the 93898 support. If the price stabilizes below this level, there is a possibility of a deeper correction down to 91945.
💥 The SMA99 indicator overlaps with the 93989 area, and if this PRZ (Potential Reversal Zone) formed by the price is broken, the probability of a further drop will increase.
⚡️ The RSI oscillator has also activated its divergence, and now we are seeing the effect of this divergence in the market. For a short position, if the 93898 area is broken, we can enter.
📈 For a long position, if the 93898 area gets faked out, we can enter a long with a fake breakout trigger in lower timeframes. The main trigger for a long is the break of 95306.
👑 BTC.D Analysis
Let's move on to Bitcoin Dominance. There is still a ranging box between 64.19 and 61.60, and the price is fluctuating between these two levels.
✨ Currently, confirmation for bullishness comes with a break of 64.60 or 64.41, and bearish confirmation comes with a break of 64.19.
📅 Total2 Analysis
Moving on to Total2, a ranging box has formed in this index between 1.03 and 1.05. These areas are suitable triggers for opening positions.
🧩 For a long position, a break of 1.05 could start the next bullish leg, with a target of 1.07.
🔽 For a short position, with a break of 1.03, the price could make a corrective move.
📅 USDT.D Analysis
Moving on to Tether Dominance, it is still struggling with the 4.99 support area and hasn't been able to stabilize below it.
📊 As long as this support holds, the next bullish leg in the market will not start. On the other hand, as long as dominance is below 5.14, the market trend remains bullish.
❌ Disclaimer ❌
Trading futures is highly risky and dangerous. If you're not an expert, these triggers may not be suitable for you. You should first learn risk and capital management. You can also use the educational content from this channel.
Finally, these triggers reflect my personal opinions on price action, and the market may move completely against this analysis. So, do your own research before opening any position.

Bitcoin at a Crossroads: Compression Before the Next Major Move?Bitcoin continues to consolidate within a critical range, trading between clearly defined support and resistance zones over the past week. Price action remains "trapped" within this structure, akin to a market equilibrium phase, with neither bulls nor bears taking decisive control.
Currently, BTC is testing a major historical resistance cluster — an area shaped by prior price memory and significant psychological levels. Over the weekend, price action into this resistance showed visible exhaustion, with momentum stalling and early signs of supply absorption emerging.
Simultaneously, Bitcoin is balancing on the daily anchored VWAP, a key dynamic indicator used by institutional participants to gauge fair value. A sustained breakdown below VWAP would significantly increase the probability of a broader corrective move toward key prior support levels.
Technical Scenarios to Monitor:
🔹 Bullish Resolution: Reclaiming resistance with strong volume expansion could open the door for continuation toward ATH zones and price discovery.
🔹 Bearish Resolution: Failure to hold the VWAP and daily structure support would likely trigger a deeper corrective leg, potentially retesting prior demand zones.
Market Context:
No clear trend reversal signals yet, but growing evidence of momentum loss at the highs.
Sideways price action is typical during key decision points; expect compression before expansion.
Macro structure remains bullish, but short-term caution is warranted.
🧠 Key Levels:
Resistance Zone: Watching for acceptance or rejection above current highs.
Support Zone: Anchored VWAP and key daily structure (~confirm levels based on your chart).
⚡ Stay nimble — Bitcoin is at a critical juncture where the next few sessions could define medium-term direction.
#Bitcoin #BTC #TechnicalAnalysis #CryptoMarkets

BTChere i want to share with you the pre-market bictoin analysis for the coming weeks there will be big newses that will move the market in diferent direction this is only for idea so you can agree or not and thank you for your support lets check the results

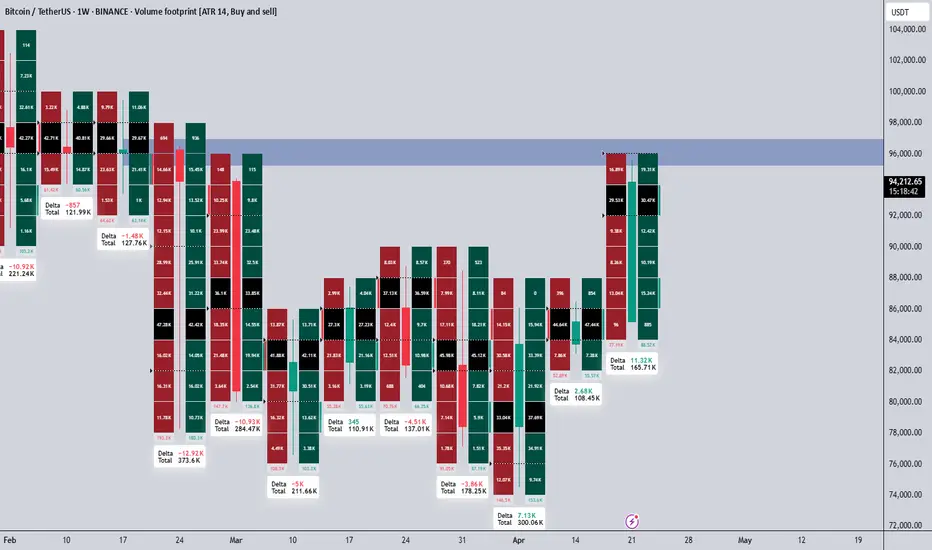
Market Recap | Last Week's Data Still Positive but Stay AlertLast week's data continues to paint a positive picture for the markets. Buyers are still clearly active based on the momentum we've observed. However, it's crucial to remember that markets are dynamic, and what looks strong today can shift quickly depending on upcoming news and developments.
📊 What the Data Tells Us:
Buyers are in control. Demand has been supporting the price across key levels, preventing deeper pullbacks.
Momentum remains bullish for now, but there’s a sense of caution creeping in as traders anticipate next week's news releases.
No major cracks yet, but we cannot afford to be complacent. Smart traders always stay flexible.
⚡ What's Next?
Until fresh news hits the market, buyers have the upper hand. But remember: your biggest strength is adaptability. Stay ready to pivot if next week’s developments shift sentiment.
Trust the data, but always respect the changing nature of the market. Confidence is good, but awareness is better.
📌I keep my charts clean and simple because I believe clarity leads to better decisions.
📌My approach is built on years of experience and a solid track record. I don’t claim to know it all but I’m confident in my ability to spot high-probability setups.
📌If you would like to learn how to use the heatmap, cumulative volume delta and volume footprint techniques that I use below to determine very accurate demand regions, you can send me a private message. I help anyone who wants it completely free of charge.
🔑I have a long list of my proven technique below:
🎯 ZENUSDT.P: Patience & Profitability | %230 Reaction from the Sniper Entry
🐶 DOGEUSDT.P: Next Move
🎨 RENDERUSDT.P: Opportunity of the Month
💎 ETHUSDT.P: Where to Retrace
🟢 BNBUSDT.P: Potential Surge
📊 BTC Dominance: Reaction Zone
🌊 WAVESUSDT.P: Demand Zone Potential
🟣 UNIUSDT.P: Long-Term Trade
🔵 XRPUSDT.P: Entry Zones
🔗 LINKUSDT.P: Follow The River
📈 BTCUSDT.P: Two Key Demand Zones
🟩 POLUSDT: Bullish Momentum
🌟 PENDLEUSDT.P: Where Opportunity Meets Precision
🔥 BTCUSDT.P: Liquidation of Highly Leveraged Longs
🌊 SOLUSDT.P: SOL's Dip - Your Opportunity
🐸 1000PEPEUSDT.P: Prime Bounce Zone Unlocked
🚀 ETHUSDT.P: Set to Explode - Don't Miss This Game Changer
🤖 IQUSDT: Smart Plan
⚡️ PONDUSDT: A Trade Not Taken Is Better Than a Losing One
💼 STMXUSDT: 2 Buying Areas
🐢 TURBOUSDT: Buy Zones and Buyer Presence
🌍 ICPUSDT.P: Massive Upside Potential | Check the Trade Update For Seeing Results
🟠 IDEXUSDT: Spot Buy Area | %26 Profit if You Trade with MSB
📌 USUALUSDT: Buyers Are Active + %70 Profit in Total
🌟 FORTHUSDT: Sniper Entry +%26 Reaction
🐳 QKCUSDT: Sniper Entry +%57 Reaction
📊 BTC.D: Retest of Key Area Highly Likely
📊 XNOUSDT %80 Reaction with a Simple Blue Box!
📊 BELUSDT Amazing %120 Reaction!
I stopped adding to the list because it's kinda tiring to add 5-10 charts in every move but you can check my profile and see that it goes on..
Market next move is comming from this level #bitcoinHello trader's
here is your next move analysis prediction
Be patient at this level so don't be rush.

BTC - Golden Pocket Confluence + FVG Sweep = Long SetupA highly refined scenario blending Fibonacci confluence with liquidity principles, setting up a controlled bullish play.
---
1. Golden Pocket + FVG Confluence — Critical Demand Zone
The blue highlighted area represents a strong confluence:
- FVG (Fair Value Gap): Imbalance left by aggressive price movement, likely to attract price for rebalancing.
- Golden Pocket: The 0.618–0.65 Fibonacci retracement zone, statistically favored for deep retracements and high-probability reversals.
Expecting strong buying interest once price taps into this confluence.
---
2. 0.618-0.65 Fib Range — Key Reversal Territory
The Fibonacci zone offers the perfect environment for engineered liquidity sweeps and smart money accumulation.
- This range often acts as a trap for retail shorts while institutions accumulate.
- A clean entry opportunity arises as price dips into this critical golden zone before expansion.
---
3. FVG Resistance Above — Initial Reaction Zone
A notable FVG resistance area is marked around 94,400–94,500:
- Upon reaching this zone, price may face initial selling pressure or short-term consolidation.
- Observing how price interacts here can further confirm bullish strength and continuation.
---
4. Smart Money Liquidity Play
The setup suggests a classic liquidity engineering move:
- Induce shorts through a pullback into the Golden Pocket.
- Absorb liquidity inside the FVG.
- Trigger a sharp bullish reversal aligned with institutional footprints.
This layered setup is clean, logical, and methodical.
---
5. Projected Price Flow
Anticipated price action structure:
- Step 1: Dip into the Golden Pocket + FVG demand zone.
- Step 2: Reversal toward the FVG resistance.
- Step 3: Breakout continuation upon reclaiming resistance, leading to further bullish expansion.
Each leg is mapped to follow high-probability liquidity behavior.
---
6. Summary:
- Golden Pocket + FVG = Prime Reversal Confluence
- Efficient Liquidity Sweep Mechanics
- Structured Bullish Progression Based on Smart Money Concepts
This plan is framed to capitalize on precision entries and liquidity dynamics without chasing price.

BTC Is Still Bullish (4H)This analysis is an update of the analysis you see in the "Related publications" section
Bitcoin is still struggling with the supply zone we identified in the previous analysis. It has not yet been able to establish itself above this supply area.
A slight correction is expected, with support anticipated from the green box.
The closing of a 4-hour candle below the invalidation level will invalidate this analysis.
For risk management, please don't forget stop loss and capital management
Comment if you have any questions
Thank You

BITCOIN SHORT SETUP ALL trading ideas have entry point + stop loss + take profit + Risk level.
hello Traders, here is the full analysis for this pair, let me know in the comment section below if you have any questions, the entry will be taken only if all rules of the strategies will be satisfied. I suggest you keep this pair on your watchlist and see if the rules of your strategy are satisfied. Please also refer to the Important Risk Notice linked below.
Disclaimer
BTC SHORT SETUP
ENTRY : 96400
PROFIT : 88174.9
STOP : 98812.8

A Simple sell set up is formed here in BitcoinCurrent Price Area: ~94000
Short-term Trend View: Downtrend
First Target: 93500
Second Target: 93000
Stop Loss: above 94400
In short: you are expecting a short-term correction in Bitcoin from 94000, with a stop-loss tight above recent highs (94400), aiming for a ~1000 point move down.
Quick thoughts on this setup:
If Bitcoin fails to break 94400 cleanly, your short view stays valid.
Watch for support near 93500 — some bounce can happen there, so partial booking or trailing stop could be smart if it stalls.
