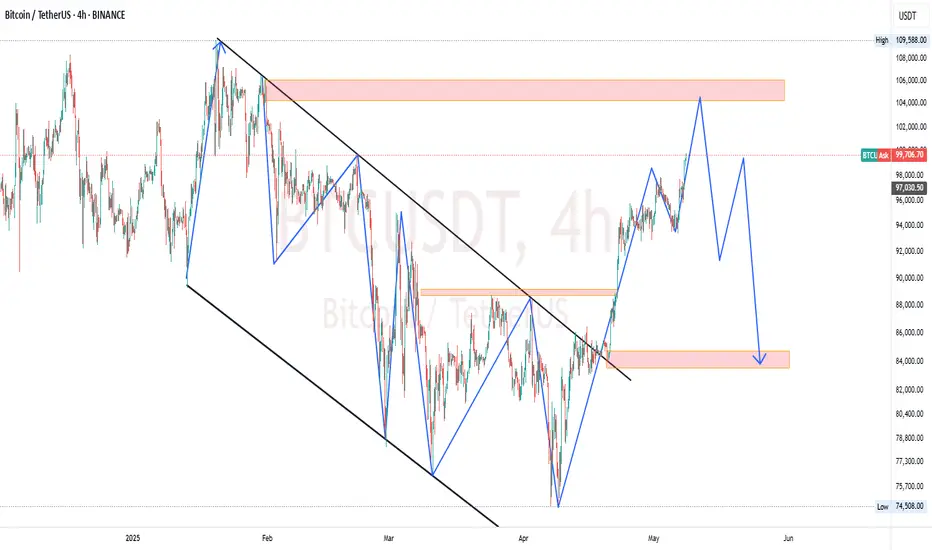
BTC - Upcoming bearish trendI think we are topping. Why?
The wave structure terminating the low is a 3 wave structure... or as it appears to me atleast.
For a trend to truly be a convincing reversal, we should be seeing a 5 wave structure indicating the end of the wave structure.
This is complex and the overall bullish sentiment makes me believe that we will top sooner or later.
BTCUSDT.PS trade ideas

BTC/USD: The Bull Run Isn’t Over yet! (READ THE CAPTION)By analyzing the #Bitcoin chart on the weekly timeframe, we can see that price has finally started rising as expected and has hit all our targets, breaking above $100,000. Bitcoin is currently trading around $103,000, and now we must wait to see if it gets rejected from this level. If there's no rejection and price breaks and holds above $110,000, we could expect higher targets around $130,000 and even $163,000 in the coming weeks. So far, this analysis has delivered over 39% return!
The Previous Analysis :
Please support me with your likes and comments to motivate me to share more analysis with you and share your opinion about the possible trend of this chart with me !
Best Regards , Arman Shaban

BTCUSDT: Drops Towards $53000 region may help us hitting $80000.BINANCE:BTCUSDT price currently in making of AB=CD pattern, it is likely to touch and reject at the $53000 which area remain crucial for most of the swing investors. The following news we can significant impact in the crypto market also 50k to 53k area remain extremely bullish. With accurate entry at 530000 area when we can target 80-100k possibly.

BTCUSDTHello Traders! 👋
What are your thoughts on BITCOIN?
Bitcoin is currently testing a major resistance zone between $98,000 and $100,000, which also aligns with the 0.707 Fibonacci retracement. This area has previously acted as a strong supply zone, raising the possibility of a short-term rejection.
Scenario 1 – Bullish Breakout:
If price breaks and closes above $100,000, we could see a strong continuation toward $106,000 → $112,000, driven by momentum and possible FOMO.
Scenario 2 – Deeper Pullback Before Continuation:
If Bitcoin gets rejected at resistance, a retest of the lower support zone (previous demand area) may follow.
A successful bounce from that support could reignite bullish momentum in the medium term.
Trading Strategy:
Wait for a confirmed breakout and candle close above $100K for a high-conviction long entry.
Alternatively, look for buy setups on a pullback toward the support zone for a better risk-reward entry.
How are you planning to trade this setup? Breakout or dip-buy? Share your strategy below! 👇
Don’t forget to like and share your thoughts in the comments! ❤️

No rush to buy.There is an extremely strong supply in the area we are in.
Buying in this area is risky and does not have a good reward.
You can make your purchases with a little patience in case of correction.

BTC New Update (12H)The upward wave appears to be a complex correction. Price may retrace downward either from this area or from the red box, and then we could see another strong bullish move from Bitcoin starting from the green zone.
It doesn’t matter where the rejection occurs | what matters is the green Rebuy zone marked on the chart.
In the green zone, we are looking for buy/long positions.
A daily candle closing below the invalidation level will invalidate this analysis.
For risk management, please don't forget stop loss and capital management
When we reach the first target, save some profit and then change the stop to entry
Comment if you have any questions
Thank You

Bitcoin's 100K Resistance Breaks Down, New ATH May '25 +AltcoinsIt only took a few days and the final barrier for a new All-Time High is now broken. Bitcoin is set to hit a new All-Time High now, in May 2025 to later continue growing; month after month after month, long-term. This is only the start.
Bitcoin challenging and breaking $100,000 easily with a full green candle is the most important bullish signal we can find. The indicators and candles are great of course, don't get me wrong, but nothing is more important than the actual price, and prices have been growing for more than a month.
— Altcoins Market Update
Most of the Altcoins market is still trading at bottom and this is only as good as it gets. Trading at bottom prices means that these Altcoins will produce massive growth in the coming weeks and days; straight up for sure, the bullish bias is confirmed.
As Bitcoin hits $100,000 and moves beyond, the entire Altcoins market is set to follow.
As Bitcoin approaches a new All-Time High in a matter of days, the Altcoins will be growing between 100, 200 and even 300% in the coming days. Think about it, 200-300% up this very same month. This is an amazing opportunity, an opportunity that you should grab; buy and hold.
Feel free to make your analysis request by leaving a comment on the Top Altcoins Choice —Your Pick trade-idea, it is live today.
Thanks a lot for your continued support.
It is truly appreciated.
We win again.
Namaste.

TradeCityPro | Bitcoin Daily Analysis #83👋 Welcome to TradeCity Pro!
Let’s dive into the Bitcoin analysis and key crypto indices. As usual, I want to review the triggers for the New York futures session.
🔍 Today, I’ll provide the analysis in the 4-hour timeframe, since not much has changed on the 1-hour chart compared to yesterday, and it's better to take a slightly longer-term look at the chart.
⏳ 4-Hour Timeframe
As you can see in the 4-hour chart, we have an upward leg that started from the 84,000 zone and extended to 97,108. Currently, it's ranging between 93,626 and 95,370.
✔️ The main market top lies at 97,108, but the price has formed a range slightly lower, with 93,626 acting as support.
⚡️ There's a strong divergence visible in the RSI — while Bitcoin has formed three consecutive higher highs, RSI has printed lower highs. This divergence was activated when RSI broke below 50, and the price corrected to 93,626.
📊 In my opinion, the market has now digested the divergence, but the impact it had was a correction down to this level. If 93,626 breaks, deeper corrections could follow.
✨ The 93,626 zone overlaps with the 0.236 Fibonacci retracement and forms a PRZ. If this level breaks, we can open a short position. I open this kind of trade in lower timeframes as a scalp and take quick profits, since it’s counter-trend.
🔽 The maximum short-term target I expect for this trade is the 91,945 area. It's possible that the price corrects further or even reverses trend, but it's not logical in my strategy to hold these kinds of trades longer.
🔑 The key supports ahead are 91,945 (which overlaps with 0.382 Fibonacci), and further down are the 0.5 and 0.618 Fibonacci levels.
📈 For a long position, breaking 95,370 is currently the best trigger. You can also enter on a break of 97,139, but there's strong resistance at 98,828 that could halt the upward move.
🔼 If the price corrects and reaches 91,945, you can consider a long entry based on the price’s reaction to the supports I mentioned.
👑 BTC.D Analysis
Let’s move on to Bitcoin dominance. On the 4-hour chart, there’s an ascending channel where price is moving, with multiple touches. Right now, it’s testing resistance at 64.91.
☘️ If this level breaks, dominance could move up to the top of the channel. There’s also a very important static resistance at 65.59. If price reaches this area, we need to watch its reaction.
📅 Total2 Analysis
Now onto Total2. Similar to Bitcoin, it had a bullish leg, but corrected more deeply — down to the 0.382 Fibonacci retracement, and now it’s at the 1.01T support.
⭐ If this zone breaks, the next supports are at the 0.5 and 0.618 Fibonacci levels. There’s also a strong support at 980B, and the major bottom is at 932B.
📉 For a short position, breaking 1.01T is suitable. For a long position, a bullish reaction from this same area is a good trigger. The main long trigger is the break of 1.05T.
📅 USDT.D Analysis
Let’s move to Tether dominance. This indicator has reached a major top at 5.19. If this level breaks, it can move upward.
👀 If it breaks, the next resistance is 5.37. This move would coincide with a market correction or drop.
📊 To confirm a bearish Tether dominance (bullish market), rejection from 5.19 is a good trigger. The main trigger is still the break of 4.99.
❌ Disclaimer ❌
Trading futures is highly risky and dangerous. If you're not an expert, these triggers may not be suitable for you. You should first learn risk and capital management. You can also use the educational content from this channel.
Finally, these triggers reflect my personal opinions on price action, and the market may move completely against this analysis. So, do your own research before opening any position.

Bitcoin 6X Lev. Full PREMIUM Trade-Numbers —2nd Entry (PP: 540%)I will explain my thinking as usual so you can make an informed decision.
I believe Bitcoin will make a new advance. When there is a move that leads to the challenge of resistance or support, there is always a stop, a retrace or pullback before additional action. Bitcoin here stopped at 95,000, which is the first resistance from our previous trade-signal and did produce a retrace but it was extremely small. This is a bullish signal.
The fact that the action remains at resistance and this resistance continues to be challenged, is also a bullish signal. The more this resistance gets challenged the weaker it becomes.
Now, a 2nd entry is riskier than the first one of course because the action is more advanced but not everybody can enter perfectly at bottom prices nor at the same time.
We manage risk through capital allocation and relatively low leverage, which is actually pretty high.
See the full numbers and you will see that risk is low.
The stop goes below the low 13-Jan. 2025. The lowest after the final advance happened at $91,688 on 24-April. This is a relatively safe chart setup.
_____
LONG BTCUSDT
Leverage: 6X
1) $96,000
2) $93,000
3) $90,000
Targets:
1) $104,250
2) $120,000
3) $131,400
4) $143,300
5) $165,000
6) $181,000
Stop-loss:
Close weekly below $86,000
Potential profits: 540%
Capital allocation: 5%
_____
I think timing is good on this one. The next move can happen within days because consolidation has been happening already for an entire week without much change in price, clearly a continuation pattern. Volume being low at this point is also a signal of consolidation.
The fact that there is no volume indicates that the true bullish action is yet to start.
Bears not being present indicates that growth will happen long-term as the bearish cycle (the previous correction) is over.
I wishing you great luck and profits.
The market always offers a second chance, always.
Namaste.

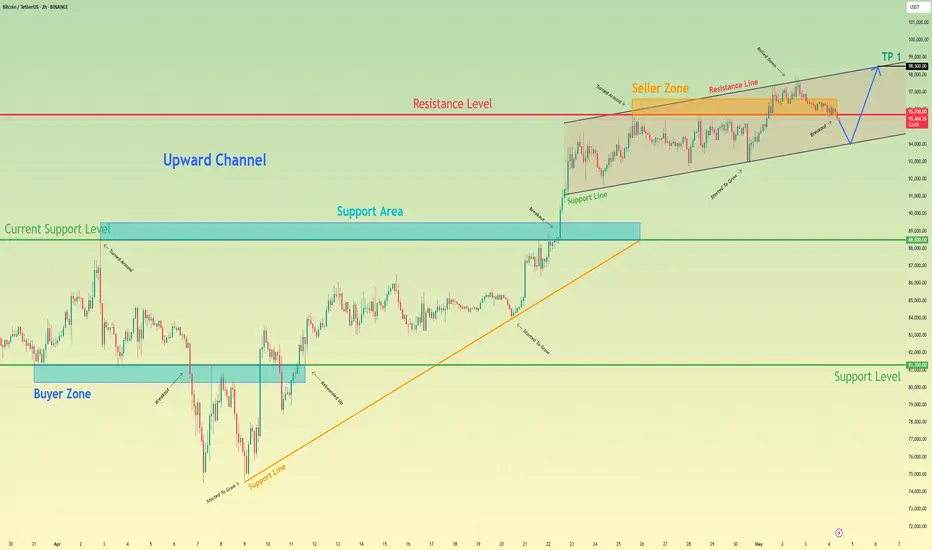
Bitcoin can bounce from support line of channel to 98500 pointsHello traders, I want share with you my opinion about Bitcoin. Looking at this chart, we can observe how the price of Bitcoin has been in recent price action. The asset had been confidently moving inside an upward channel, building structure through higher highs and higher lows. Each upward impulse was supported by pullbacks to the support line, showing continued buyer pressure. The latest breakout above the support area confirmed a bullish continuation, and the price entered the seller zone, where it faced resistance. Despite multiple attempts to break through, the price repeatedly turned around, forming a tight triangle pattern within the upper boundary of the channel. Currently, the price has broken down from the triangle, but it still holds above the channel's lower line. Given that the channel remains intact and there's no strong breakdown of the structure, I expect the price to rebound from the lower boundary and continue climbing toward my TP 1 at 98500, which aligns with the resistance line of the channel. Please share this idea with your friends and click Boost 🚀
BTC 4H analysisIn the previous analysis, the zone of 70 was determining level for us, whether it was a correction or a downward trend.
BTC continued it's upward movement from near that area.
Now Bitcoin is near it's historical resistance area, this time the zone of 110 to 114 plays this role for us.
According to ICHIMOKU and according to previous analysis, Bitcoin tends to move to higher levels marked on the chart.

btcusdtthe buyers strenght is very strong, am anticipating for now. i will like to see the market reaction at area of interest. once market meet my setup condition. i take decision to sell
Bitcoin is not going anywhere in the medium term: $68,000Bitcoin 4-hour chart: Analysis using equilibrium levels and price saturation levels from the January 2025 ceiling: After breaking the main zone, the candles failed to break the blue equilibrium line below, and the candles are turning and hitting the blue equilibrium line above to maintain balance... Due to the main zone breakdown, the candles will reach the middle zone in the medium term... Range of $65,000 to $69,000
Note: Equilibrium analyses may be slightly delayed due to the big-image view of the market, but the targets will be touched in the market.

DeGRAM | BTCUSD ended the period below 100k?📊 Technical Analysis
● Price rocketed out of the $91 300 demand zone, snapping the 6‑month descending trend and converting the $99 500 former cap into support.
● A tight bull pennant is forming just above that level; a decisive break targets the marked resistance level/supply band at $108 000. Long bias void below $93 300.
💡 Fundamental Analysis
● U.S. Treasury’s plan to boost quarterly bill issuance is flattening real yields and lifting non‑yielding assets.
● Hong Kong’s new spot‑BTC ETFs amassed >$500 M AUM in two weeks, signalling fresh Asia‑Pacific demand and tightening offshore float.
✨ Summary
Pennant continuation above new support and expanding Asian ETF inflows argue for a push from $99.5 K to $108 K; protect longs if price closes under $93.3 K.
-------------------
Share your opinion in the comments and support the idea with a like. Thanks for your support!

BTCUSD NEXT POSSIBLE MOVEremember in our last forcast on BTCUSD
Another continuation pattern found (ascending triangle)
so what do you think guys

Bitcoin 2nd Entry? Is It Possible? Can I Do 20X Now?Can I still do Bitcoin with leverage? Absolutely but...
Where were you when the prices were low?
Where were you when Bitcoin traded below 80K, 90K?
Leveraged is for experts only so I would say no and yes.
No you cannot use leverage if you want to use leverage now that prices are going up. It means you have no plan and regardless if the action keeps going for long that no plan strategy will result in a big loss later down the road.
If you do decide to use leverage after the bottom is far away ($75,000 remember?), in that case you should use a maximum of 2-3X.
Yes you can use leverage if you can I don't need to tell you so. If I have to tell you so then it means that you are better off buying some Altcoins spot. Why? Because you can get the same growth potential but without the risk, anxiety and stress.
Why would you like to use leverage now?
You are thinking of making money, lots of it and fast. You are using greed to decide.
If that's the case, no! Go back to scratch and start from zero.
It is better to earn 100% very slow than lose everything thinking of making money fast.
Imagine you have a $5,000 capital and you want to open some positions using lev. You are thinking low risk, the market is already up and several days green. Tomorrow there is some political event and shakeouts can happen out of the blue. You might think you did it good, entered with low risk but as soon as there is advance you decide to buy more and your leverage increase. As prices rise you buy more and so your risk continues to increase. Then just a strong sudden shakeout and your whole stack is gone.
The intentions were nice, you wanted to make money now that Bitcoin is going up but you didn't plan and you ignored the market 100% when prices were low. Accept the loss and move on.
Now, instead of a leveraged position use $5,000 to do some spot trades. The market is bullish, the Altcoins are bullish and ready to grow next. It should be easy to pick 3-5 top pairs and double-up in a couple months.
Say it takes three months for a 200% profits, quite do-able with the Altcoins with current market conditions; now you have a capital of $15,000. Now you can use $5,000 to try leverage as much as you want but only after a correction hits and support is in, that's the time to go LONG.
And then you have $10,000 left. $5,000 is your initial layout and $5,000 is profits to enjoy with wife, your husband, your friends, your siblings or all by yourself, all alone. Whatever you do is up to you.
It is better to earn 200% slow, than to risk losing everything because greed is eating away at your soul.
Just let it go. It is never worth it to lose your hard earned cash for a dream that never turns up. Just let it go, you are better off reading and studying, you are better off saving that money rather than giving it up.
Either way, you will learn. If you engage the market long-term, accept your mistakes, eventually, you will be on the right side. Read, study, practice and meditate.
Money is easy when you develop the right mindset.
It is all in your mind.
Namaste.


BTC Might Face a Selloff That Could Stay as a Buying OppurtunityBitcoin is enjoying the rally and the support it's receiving from the stock market. After testing the 72,000–74,000 zone, the upward reaction was so strong that even the major resistance at 91,000 failed to slow the move. However, now that the S&P 500 has reached a key resistance zone, momentum may begin to slow, at least in the short term.
If the 102,300 level breaks, Bitcoin could retreat toward the lower boundary of the newly formed trend channel. In the medium-term outlook remains bullish so any short-term pullbacks are likely to present buying opportunities, as long as the trend channel and the 91,000 support level remain intact.
For context, refer to our earlier daily timeframe posts on the S&P 500 and BTC:

BTCUSDT - Potential Long Setup Developing from FVG and Fib levelOverview:
Bitcoin (BTCUSDT) on the 1H timeframe is currently exhibiting a controlled retracement following a local top. This structure presents a potential opportunity for a long setup based on confluence between an FVG (Fair Value Gap) and key Fibonacci retracement levels. The chart highlights a likely scenario where price may continue to correct lower into a defined area of interest before resuming bullish momentum.
Market Context:
After a strong impulsive move upward, BTC appears to be in a corrective phase. The recent price action has formed a series of lower highs and lower lows, which is characteristic of a short-term downtrend within a broader uptrend context. This kind of pullback behavior is often necessary for healthy continuation to the upside and can offer high-probability entries for trend continuation traders.
Fair Value Gap (FVG):
A notable fair value gap has been identified in the 94,250–94,700 zone. This zone represents an inefficiency in the market where price rapidly moved without significant opposition, leaving behind a gap between wicks of adjacent candles. Price often returns to such areas to rebalance order flow before making its next decisive move.
Fibonacci Confluence:
The chart includes key Fibonacci retracement levels drawn from the recent swing low to swing high.
* The 0.618 Fibonacci retracement level lies just above the FVG, providing strong technical confluence.
* The 0.65 level is marked as the ideal entry zone and sits within the FVG, further validating it as a high-probability support region.
* The 0.786 level is also marked, and although deeper, it represents the final line of defense for this bullish scenario.
Anticipated Price Action:
A bullish projection is illustrated on the chart where price is expected to:
1. Continue declining toward the 0.65–0.618 Fibonacci confluence zone.
2. Wick into the FVG and reject from that level.
3. Form a short-term higher low structure and push back to reclaim prior structure highs.
4. Confirm bullish structure continuation with an impulsive breakout from the descending channel.
Market Structure and Liquidity Outlook:
The broader structure remains bullish on higher timeframes. The retracement into the FVG would serve the dual purpose of:
* Grabbing liquidity below recent lows.
* Mitigating unfilled buy-side inefficiency.
Such a development would suggest that institutional participants are filling long orders in the discounted price region, setting the stage for a potential continuation of the broader bullish trend.
Key Technical Zones:
* FVG Zone: 94,250 – 94,700
* Fibonacci Confluence: 0.618–0.65 retracement levels
* Liquidity Pool: Below current swing lows leading into the FVG
Conclusion:
BTCUSDT is approaching a critical decision zone. A move into the FVG combined with Fibonacci retracement confluence presents an attractive area for potential long entries. Confirmation of bullish reversal structure within this zone could offer a strong trade opportunity in alignment with the broader trend. Patience and precision will be key in waiting for the price to tap into this area and show intent to reverse.

Bitcoin Moving Averages: Back To BasicsBitcoin today is trading safely above the long-term SMA200 moving average on the daily timeframe. This is a major signal. The break above this level happened 22-April with a huge green candle. This event marks the confirmation of the next major advance. While Bitcoin was trading below SMA200 daily, black line on the chart, there was still space for doubt. Once the action moved above this indicator, the bullish bias is confirmed.
Bitcoin is also trading daily above EMA8/13/21 & 34 which are moving averages to gauge the short-term potential of an asset.
Then we have EMA55 and EMA89 which is used to measure mid-term potential. Once Bitcoin trades above EMA55 daily, we can say that mid-term growth potential is now active. 1-3 months. Once the action moves above EMA89, this potential is fully confirmed.
Finally, I track also EMA233 and EMA377, very long-term and Bitcoin trades above these as well. These are in the same range as SMA200.
Bitcoin is ultra-bullish right now and set to produce additional growth.
Remember that the MACD and RSI are also flashing bullish signals across all timeframes. Also basic.
All the technicals are 100% bullish.
Thanks a lot for your continued support.
Bitcoin (and the Altcoins) is going up.
P.S. The green action today allows for volatility tomorrow without hurting any of the bullish technicals. So bullish it is impossible to miss. The fifth consecutive week green.
Namaste.

BTC Cycle Top? Watching Q4 2025 for Major Reversal PotentialBTC is entering a zone I’m watching closely. Structurally, the current move reminds me of the previous two cycle tops — Q4 2017 and Q4 2021.
📅 My personal outlook:
I’m expecting a potential cycle top anytime between the end of Q3 and end of Q4 2025. Not a guarantee — just a framework to avoid emotional trades.
📌 Target zone:
1.618 Fib: ~$122,500
2.618 Fib: ~$150,000
Past cycles peaked near similar extensions. If the trend holds, these are areas I’ll consider taking action.
Let me know how you're planning your cycle moves.
#Bitcoin #BTC #Crypto #CycleTop #MacroView #PriceTarget #TradingView #FibLevels

BTCUSDTHello traders.
The first trade of the week will be from BTCUSDT.
The pair drew a lot of attention over the weekend with strong bullish momentum. Some analysts are even suggesting it could rise to 106,000 USD during the week.
However, the crypto market is currently very volatile. Despite that, I'm activating a trade based on my system.
🔍 Criteria:
✔️ Timeframe: 15M
✔️ Risk-to-Reward Ratio: 1:2
✔️ Trade Direction: Buy
✔️ Entry Price: 104000.00
✔️ Take Profit: 104596.14
✔️ Stop Loss: 103702.15
🔔 Disclaimer: This is not financial advice. It's a trade I’m taking based on my own system, shared purely for educational purposes.
📌 If you're also interested in systematic and data-driven trading strategies:
💡 Don’t forget to follow the page and subscribe to stay updated on future analyses.

its just sample sizeThe high at 4 a.m swept all the weekend bad highs (higher than the rest)
on CME theres only 1 candle (to rule them all) and a gap down of ETH (electronic trading hours)
in my experience gaps that form on weekends and gap on ETH get filled even more likely than the ones who are formed on ETH and shown on RTH (regular trading hours)
i like that this high is higher than the range and is back in the previous range it aligns with liquidity concepts.
also, on this range we can observe that the RSI is going down slightly while price remains the same. that indicates a momentoum slowdown and CVD is making higher highs while price stays in the same range which indicates aggressive buyers are actually not making a lot of progress.
I have a short now because i like this structure and my odds.
we can easily have one last sweep of liquidity twards 106 but for now im enjoying my short probabilities.
my first target is 98k where i will attempt a long if the data looks good (hidden bullish divergence, structure, swing fail pattern etc)
the long and short are there to hedge themselves.
if 97 is broken, tho.. we will break the trendline.
bearish retest of this trendline will cascade us into the stoploss domino pieces falling.. i will not stand in the way of this cheos and wait like a good boy around 82k 74k and 69k all while my short is still active.
im bullish for 2025.
