Kingbtc3.4hWelcome to kin btc. Bitcoin can be considered to have a multi-day range between 100,800 and 105,000, with a shadow moving up to 106,000 and then experiencing a price decline towards 95,630. However, if the daily candle closes above 106,000, we should expect a move towards 139,500. However, in general, we expect a price decline. This is just a possibility.
BTCUSDT.PS trade ideas

Bitcoin Weekend Retracement 3%Weekend is the only time right now to be short, retail in on and insti are off! CRYPTOCAP:BTC big shorts can happen during weekends, once we dont have inflows and retails take loads of shorts positions. hashtag#Bitcoin hashtag#Short

Btcusd temporary drop expected Btcusd has regained its 100k position. Last day market reached 104500 without any correction. So now a temporary retracement is possible market would not go up straight.
Technically there are 3 supporting areas 99500, 96500, 93500
My targets is 99500 but if market drops below this target then it will drop further to a strong supporting area 96500 which is my last target.
Entry would be 104000, 105000
Targets area 99500, 96500


BTC - Bullish SOON!Hello TradingView Family / Fellow Traders. This is Richard, also known as theSignalyst.
BTC has been in a correction phase, and it feels like it's taking forever! ⏳
As long as the blue trendline holds, the overall bias remains bullish. 📈
As BTC approaches the blue trendline—perfectly aligning with a demand zone and support—we'll be watching for trend-following longs to catch the next big impulse move upward. 🚀
For now, we wait! ⏳
📚 Always follow your trading plan regarding entry, risk management, and trade management.
Good luck!
All Strategies Are Good; If Managed Properly!
~Rich

BTC/USD: Get Ready for another Bullrun ! (READ THE CAPTION)By analyzing the #Bitcoin chart on the weekly timeframe, we can see that the price is currently trading around $95,000. Soon, we should expect Bitcoin to enter the key supply zone between $99,500 and $109,500, where we’ll closely watch for the market's reaction.
Bitcoin continues to show strong demand, and we may witness another bullish spike in the short term. All previous assumptions from the last analysis remain valid.
Please support me with your likes and comments to motivate me to share more analysis with you and share your opinion about the possible trend of this chart with me !
Best Regards , Arman Shaban

Bitcoin may rebound from seller zone and start to declineHello traders, I want share with you my opinion about Bitcoin. In the past, the price had been consolidating within a broad range, repeatedly rejecting support and resistance zones. The buyer zone between 79100 - 80300 provided a strong base, and from there, BTC began to grow, forming a bullish structure that led into an upward wedge. This growth accelerated once the price broke through the support area and continued upward until it approached the resistance level at 95500, which also overlaps with the seller zone. As the price moved inside the wedge, the bullish impulses weakened. Buyers lost strength near the resistance line of the wedge, and recent price action suggests that sellers are stepping in at the top. We’ve now seen multiple failed attempts to break higher, and the price is consolidating under resistance, forming pressure to the downside. This entire consolidation near the wedge resistance, especially inside a confirmed seller zone, indicates a likely reversal. The current structure shows signs of exhaustion, and if the support line of the wedge breaks, that would trigger a significant correction. Given this context, I expect BTC can make a bearish move toward TP1 at 91500 points. Please share this idea with your friends and click Boost 🚀

Bitcoin's Weekly MACD & RSI —Back To Basics (Part 1)We looked at Bitcoin on the weekly timeframe and mentioned the rare Michael Saylor 4 weeks green bullish signal. But what about the MACD and RSI? What are these indicators currently saying?
Let's dive deep into these two and see what we can find.
First, Bitcoin's weekly RSI.
1) Here we have first what is called a hidden bullish divergence. The RSI hit a lower low in March 2025 compared to September 2024, but Bitcoin is currently trading within a strong higher low (March/April 2025 vs September 2024). This is an interesting signal.
2) The same RSI support that was activated in September 2023 and September 2024 worked in March 2025. Once this level was activated—blue dotted line on the chart—the RSI started to move upward.
Each time this support is activated Bitcoin goes on a major bullish wave. In September 2023 Bitcoin started a major rise from 20 something toward 70K+. In September 2024 Bitcoin started a major advance from 60 something toward 110K.
3) A triple bottom. Another signal related to this same support level is a triple bottom. It was challenged three times and holds. In 2025, this support zone was pierced briefly and then the RSI started growing. This makes the reversal signal an even stronger one.
Bitcoin doubled in 2024 from this RSI support and more than triple in 2023. So this time around we can count on a double minimum but can be a triple or more. If it increases each time, first a double, then a triple and then a quadruple.
The next signal is Bitcoin's weekly RSI broken downtrend and bullish reading:
1) The downtrend has been broken on the RSI, pretty simple. Here depicted with blue lines. Needless to say, when the downtrend breaks the RSI moves up. A strong RSI is bullish for Bitcoin and this takes us to #2.
2) The RSI has a strong reading at 59. Bullish is above 50 and there is also a bullish cross, when the RSI moved above the RSI based MA (moving average).
The weekly RSI reveals Bitcoin's eternal bullish bias. Over time this indicator becomes overbought but never oversold. Interesting isn't it? It shows that market participants are ready to buy beyond what is reasonable but not willing to sell that much.
As it happened back in late September 2024, the RSI doesn't have to move straight up, there are ups and down within a rise, please keep that in mind. The RSI doesn't necessarily reflect what Bitcoin is doing or will do, it only supports a broader bias, trend or cycle, in this case the bullish case.
Next comes the MACD (Moving Average Convergence Divergence).
This is pretty interesting as well and the first signal is a higher low in April 2025 vs September 2024, a standard bullish signal:
Revealing Bitcoin's eternal bullish bias, the MACD starts to recover without reaching the bearish zone. The bearish zone is when the MACD moves below zero, here the recovery is happening above.
The fact that the bullish cross on the MACD, when the MACD line crosses upward the signal line, is not yet in means that this bullish cycle is still early.
When the MACD line (blue) starts to curve on the weekly timeframe after making a long-term low, as it is now, the market turns bullish and there is no going back.
I will go deeper on the MACD in part 2 of this publication.
If you enjoy it and like it boost it to give me feedback. The more feedback, the deeper the next analysis will be.
Thanks a lot for reading, your support is truly appreciated.
I'll see you next time.
Namaste.

BTC breaks out - Can it sustain the bullish momentum?Over the past week, Bitcoin (BTC) has shown notable strength, forming an ascending triangle pattern, a typically bullish structure that often resolves to the upside. True to form, BTC has now broken out above the triangle's resistance, pushing higher with strong momentum.
-------------------------------
Price target ascending triangle
This breakout sets a technical price target above $98,000, suggesting there’s still significant upside potential if the pattern plays out fully. However, the rally is now approaching a critical test.
-------------------------------
Golden Pocket + POC
BTC is currently moving into a zone of strong resistance, both the Golden Pocket Fibonacci retracement level and the Point of Control (POC) from recent months converge in this area. These technical levels often act as magnets for price and can serve as significant barriers, potentially leading to a pullback or consolidation.
-------------------------------
Stochastic RSI
Adding to the caution, the daily Stochastic RSI remains in overbought territory, where it has lingered for an extended period. While this doesn’t guarantee an immediate reversal, it does suggest that a corrective move could be on the horizon.
-------------------------------
Conclusion
Still, there's a chance BTC could first push toward the psychologically significant $100K level before any major retracement occurs. Traders should keep a close eye on how BTC behaves around this key resistance area, confirmation or rejection here will likely shape the next major move.
-------------------------------
Thanks for your support.
- Make sure to follow me so you don't miss out on the next analysis!
- Drop a like and leave a comment!

BTCUSD – Multi-TF Bearish SFP & Fib Retrace Before ATH Rebound
Bearish SFP printed on 4H / 8H / 12H / 1D at $103 345 – $104 985 after a parabolic ~$94 k → $104 k run and multiple rejections at $104 k–$106 k resistance.
Trump tariff-cut announcement sparked a sharp spike into resistance that was quickly sold off, confirming heavy supply at $104 k – $106 k.
Baseline plan: drop to 0.786 Fib ~$102 586, then 0.618 Fib ~$100 613, before a push toward the ATH ~$109 588.
Trade Setups
Short – SFP Breakdown
Trigger: 4H close below $103 345
Entry: ≈ $103 300 on retest
SL: $105 500 (above swing high)
TP1: 0.786 Fib ≈ $102 586 RR ≈ 0.7
TP2: 0.618 Fib ≈ $100 613 RR ≈ 2.6
Long – Fib Rebound
Trigger: Bullish reversal at 0.618 Fib / FVG cluster ≈ $100 613
SL: $99 300 (below FVG)
TP1: SFP top / range high ≈ $104 145 RR ≈ 2.7
TP2: ATH ≈ $109 588 RR ≈ 6.8

Bitcoin vs. Saylor: The Power and Danger of fanatical promotionToday I want to talk about Michael Saylor and his influence on many crypto minds and, to some extent, the movement of Bitcoin’s price.
It’s very important to understand who we’re listening to, who we’re following, and whether this person has hidden motives we don’t see due to lack of information or unwillingness to get it — due to our stubborn desire to see only what confirms our own fantasies and thoughts and serves our expectations.
Let’s turn on our reason and objectivity and face the facts.
Michael Saylor is a well-known figure in the crypto world. He promotes the idea of eternal Bitcoin growth and actively buys it to support his words. When the price drops, he even suggests his readers sell their organs, which, to me, is too much.
Let’s move to the facts — everything is Googleable, and promptable.
Facts:
📈 Hype of 2000
In 2000, he rode the dot-com hype with his company MicroStrategy. MicroStrategy was promoted as a pioneer in business analytics and data management software, and he saw himself solely as a visionary of the new economy.
The boom was sky-high — just read about the dot-com era. Stocks of new tech companies were soaring, and it was enough to say “software” and “I see the future.”
In 1998, MicroStrategy successfully held an IPO. In 2000, at the peak of the dot-com boom, the company’s stock reached an incredible $333 per share in March.
He skillfully used the hype, and here was his 2000 narrative:
Digital transformation: Saylor claimed the world was entering a new era where data would become the main asset of companies, and MicroStrategy — the key tool for processing and analyzing it.
Unlimited growth: In the dot-com era, Saylor pushed the idea that tech companies like MicroStrategy would grow exponentially, ignoring traditional financial constraints.
The future is now: Saylor created the feeling that MicroStrategy wasn’t just following trends but shaping them, offering solutions that would define the future of business.
At the same time, he was building a cult around himself, cultivating the image of a genius entrepreneur.
⚠️ Financial reporting scandal
The U.S. Securities and Exchange Commission (SEC) launched an investigation into MicroStrategy. The company overstated revenues, which led to a stock crash (from $333 to $86 in one day) and a loss of investor trust. The stock kept falling and dropped to $0.4 (–100%!).
The SEC filed charges against Michael Saylor personally (CEO), as well as CFO Mark Lynch and the chief accountant. They were accused of intentionally misrepresenting financials to keep stock prices high.
SEC investigation results:
In December 2000, the SEC concluded the investigation, and MicroStrategy agreed to settle without admitting guilt:
* The company paid a $10M fine.
* Saylor, Lynch, and other executives paid personal fines.
* Saylor agreed to pay $8.28M in “disgorgement” (unjust enrichment) and a $350K fine — a total of about $8.63M.
* MicroStrategy committed to revising its reporting and implementing stricter internal controls.
In addition to the SEC settlement ($11M from leadership, including $8.63M from Saylor), MicroStrategy faced shareholder class-action lawsuits, which were settled for $10M.
No executives were criminally charged, but the company’s and Saylor’s reputations suffered greatly.
In other words, Michael didn’t have any moral hesitation about faking company profits during losses. But investors and journalists started asking questions — and the SEC came knocking.
Let’s call it what it is: Saylor committed fraud, using hype, promising endless growth, and creating a cult around himself as a “financial genius and visionary.”
Michael went quiet, and the media tone shifted quickly — from super-visionary to one of the biggest losers and scammers.
To give him credit, he managed to keep the company alive and kept a low profile until 2020, like a mouse. 20 years — a generation change and a new hype cycle.
And what does a tech visionary do? Of course — jump into the new wave. A chance to restore his image — probably more important to him than money.
🟠 Bitcoin Era, 2020
Before 2020, Saylor was a Bitcoin skeptic. In 2013, he even tweeted that “Bitcoin’s days are numbered” and compared it to gambling.
But in 2020, he changed his position after deeply studying crypto. His mission: to protect capital and restore his image as a prophet — and he decided to buy Bitcoin.
But his own money seemed insufficient, so he turned to borrowing.
Here’s how the scheme works:
1.MicroStrategy issues stocks and bonds
📈 They sell new MSTR shares → get cash.
💵 They issue bonds (debt papers) → investors give them money at interest.
2. They use that money to buy Bitcoin
🟧 All the raised funds go into BTC purchases.
They don’t sell. Just hold. Never lock in profit.
3. If BTC rises → MSTR stock price rises
MSTR becomes a kind of "BTC ETF."
📊 BTC growth = MicroStrategy’s market cap growth.
🔁 Then they repeat the cycle.
Stock price up → issue more shares/bonds → buy more BTC → repeat.
📌 The catch:
They use other people’s money (debt) to buy BTC.
They sell almost nothing.
They bet BTC will grow faster than interest on the debt.
So as long as the price goes up — everything is fine.
Let’s admit: his fanaticism, aggressive marketing, and bold statements have helped Bitcoin.
But the main question: will the inevitable market correction wipe out this belief in endless growth?
🔍 His personality
It’s crucial for us as traders and investors to understand who really runs the company or project. The personal traits of leaders are useful information that gives us insight and a behavioral map.
We need to research not only products and financials, but also the psychological types of those making the decisions.
Saylor’s aggressive marketing and loud statements are part of his personality.
He fed off the hype around his persona more than any growing bank balance.
And there’s nothing wrong with that — until you start deceiving people to keep attention on yourself.
For example, in the 2000s, *Forbes* noted that Saylor “sold the dream” of a new economy where traditional profit metrics didn’t matter.
It attracted investors — but didn’t reflect reality. Forbes hinted that his desire to maintain the genius image may have led to accounting manipulation.
Saylor created an "expectations bubble" that burst.
His desire to prove he’s a genius led to a disconnection from reality.
He often talks about himself as a genius and visionary (sounds like a grandiose ego).
He positions himself as the savior of capital through BTC (messiah complex).
He publicly mocks “weak hands” and traditional investors (shows superiority).
He never admits mistakes, even after losing billions (denial and overconfidence).
He repeats his ideas again and again (manic fixation on being right).
His speech is like a manifesto, not a dialogue. He doesn’t converse — he proclaims.
I don’t sense greed in him. I sense emptiness that demands a cult.
He doesn’t live for money — he is obsessed with the idea.
And that’s the problem — there’s no objectivity here. It feels more like revenge after the humiliation and downfall of 20 years ago.
He’s smart — no doubt. But it’s not just intelligence. It’s cold messianism.
Obsession, not passion.
Psychotype: Grand strategist with a humiliation trauma
Trait Behavior
Narcissistic core “I’m special, my vision is above all.”
Obsession with greatness “I must be the truth, not just be right.”
Hyper-rationality “I survive through logic, not feelings.”
Psychological armor “I won’t show weakness. If I break, I disappear.”
Fanatical visionary “My idea is supreme. I don’t need to be humble.”
💸 More facts:
In 2024, Michael paid a FWB:40M fine for tax evasion.
The accusation:
He didn’t pay income tax in D.C., while actively living there — yachts, property, planes, frequent visits.
His tax returns didn’t reflect reality, and the investigation used GPS, Instagram, flight data, banking, and other digital traces.
Saylor didn’t admit guilt but agreed to settle for around $40M.
His personal wealth is mostly in MicroStrategy shares (9.9% or ~$8.74B by end of 2024).
Theoretically, he can sell them — but he must file a report within two days.
Current status:
MicroStrategy owns 555,450 BTC
Average purchase price: ~$68,550
Total purchase cost: ~$38.08B
Unrealized profit: ~$14.7B
And remember — Saylor’s slogan: Forever HODL.
📉 But the key point:
The company’s current debt is $7.24B.
All is good — as long as the price rises.
Analysts estimate BTC would have to fall to ~$20K before MSTR is forced to liquidate.
But if BTC nears the break-even zone, fear might hit shareholders first — triggering stock sell-offs.
If MSTR shares fall — which is likely during a BTC crash — bondholders, especially those with convertible bonds (which make up most of the debt), might demand repayment.
That could force Saylor to sell BTC.
Because in a crypto winter, buyers for MSTR stock or bonds may disappear.
So BTC could fall — not because of actual sales, but from fear of those sales.
This is my main concern with Saylor’s oversized influence on the market.
🐍 A bit of “reptilian” theory
What if BlackRock *planned* to use Saylor’s hands to push Bitcoin and concentrate large amounts in one basket — then take it from him?
Among the main bondholders are big institutions:
* Allianz Global Investors
* Voya Investment Management
* Calamos Investments
* State Street
These bonds are usually unsecured and non-convertible, making them attractive to investors who want Bitcoin exposure without direct ownership.
In case of default, bondholders have priority over the company’s assets — including BTC reserves.
🏛 State Street Corporation
Public company traded on NYSE.
Its biggest shareholders: Vanguard Group and BlackRock .
If so — they could end up holding as much BTC as Satoshi.
BlackRock’s IBIT holds ~500K BTC.
MicroStrategy holds ~500K BTC.
🤔 Questions to reflect on:
* Is industry leader fanaticism good for the development of crypto?
* What is Michael Saylor really doing? Avenging the past? Or truly in love with the technology?
* What risks does a whale with media influence and fanaticism and pockets full of Bitcoin and debt pose to the market?
Waiting for your thoughts in the comments, dear traders! Hugs! 🤗

Continued Bitcoin AnalysisAccording to the exact analysis, Bitcoin fell to the specified range and is currently on an upward path. You can follow the rest of the analysis in the main analysis updates.
Sasha Charkhchian

BTCUSD BULLISH SUSTAINANCE.BTCUSD Trading Signal
Market Sentiment: The market is currently experiencing a price surge following a strong rally throughout April. Bitcoin has shown positive momentum and remains in a clear ascending market structure.
Key Levels:
Resistance: $92,000 (broken)
First Target: $95,750
Final Target: $97,800
Technical Overview:
Bitcoin continues its upward movement, supported by strong volume and higher highs. Moving averages point to a strengthening market, with momentum indicators confirming an ongoing bull run. Traders may consider entering on pullbacks or confirmed breakouts above $95,750.

Bitcoin's Blueprint: Channel Breakout Sets Stage for $104K Push
Looking at the Bitcoin/TetherUS 1D chart from May 6, 2025, we're witnessing a critical technical setup that suggests significant upside potential.
The price is currently at $94,758 , having established a solid foundation after the April recovery. This technical analysis reveals a powerful bullish scenario developing:
Master Pattern: Ascending Channel Continuation
Bitcoin has formed a textbook ascending channel (yellow boundaries) since the February-April bottoming pattern. After testing the lower boundary in April at approximately $74,508, price has rebounded sharply and is now consolidating in a rectangular accumulation zone (purple box).
Key Technical Elements:
- Diagonal Support Break : Price has successfully broken above the descending trendline (gray) that had capped gains since early 2025
- Channel Position : Currently trading in the lower half of the ascending channel, suggesting significant upside room
- Volume Confirmation : The 10.61K volume with positive price action (+0.03%) indicates healthy accumulation
Projected Movement Pattern
The blue arrows map out the anticipated price movement:
1. Current consolidation within the purple box (accumulation phase)
2. Initial thrust to upper channel boundary (~$100K)
3. Minor pullback to establish higher support
4. Final push toward the target of $104k
Strategic Insight: "The Channel Magnet Effect"
Bitcoin's price action demonstrates the magnetic pull of the upper channel boundary after confirmed breaks of diagonal resistance. The purple consolidation zone serves as the launchpad for this measured move.
This pattern is particularly significant as it mirrors Bitcoin's historical tendency to build momentum through rectangular consolidations before channel expansions.
Traders should watch for a convincing break above $98,000 as confirmation of this bullish scenario, with potential for acceleration once psychological resistance at $100,000 is breached.
For risk management, the lower boundary of the purple box provides a clear invalidation point for this bullish thesis.

OLD BUT GOLD! Warning BTC next recession!In the previous article [ BTC may slightly decrease before the next move ] we pointed out the risk volatility of BTC in the ~96k range. So far, the BTC price analysis is going quite well as expected (not 100% accurate):
- The price increased to touch 109k5 and formed a resistance zone.
- Then the price dropped sharply and locked the 96k zone and headed to key level the 70k zone but stop at 74k7.
- Next, price is recovering very well to the 97k zone
- Please note that the analysis is for reference only, the BTC price movement is similar to the image, but not 100% correct, the price move up and down through the zone while moving. This analysis is based on personal technical analysis, not investment advice! => please consider your skills before making a decision!
The main content of this article will be the current price movement after recovering to the 97k area. The price tends to increase, but the upward force is much weaker , currently the price has created a form of resistance at the 97k area. In my personal opinion, this weakness can reverse at any time => ending the recovery phase into a downtrend phase. If this analysis is correct, we will look at the price of the nearest important support zone at 83k (move 1), if this price cannot be maintained, the price may continue to decrease further to the 70k area (move 2).
Everyone wants the price to rise and make good profits, but from a technical analysis perspective, we need to be objective to avoid buying or increasing positions in risky areas or maybe buying more in cheaper areas. I am not a fortune teller, this analysis will be wrong when the price breaks the 97k resistance and increases further. Trade safe!
The key support and resistance levels in this article are used from the BBND script.

BTCUSDT SHORTHere’s the translation for your analysis:
"The price here is a good level to open a sell position. The future buy and sell levels I've marked are based on the perspective it creates for us, but for now, it's just a viewpoint."
ITS POSSIBLE SCENARIO FOR BTCUSDT.

BTC Short Setup IdeaFollowing the recent impulsive move, we’ve seen a significant number of short liquidations. There’s a high probability of a correction toward the accumulated liquidity near the lows. Additionally, keep an eye on the CME gap between $91,920 and $93,440 — a potential magnet for price.
The impulse itself shows signs of weakness, and there's a noticeable bearish divergence on the RSI, suggesting downward momentum. Price is currently testing a strong resistance area, corresponding to the 0.786 Fibonacci retracement level from the entire correction since the ATH. Moreover, the RSI has entered overbought territory.
I recommend starting to look for short entries from this zone, supported by these technical signals. As always, proper risk management is essential.
Looking forward to hearing your thoughts and feedback on this idea!

Strong resistance or a rebound from the upswing to resistance agStrong resistance or a rebound from the upswing to resistance again, trying again

BTC is heading towards 109-112With this idea we can buy the smallest possible volume to probe, because the current price is at the 2.618 profit level. If the price goes up, we will also make profit with a small volume of buying. I still prefer the price to return to where it started to increase, take all the liquidity and then increase strongly, however this is unlikely but not impossible.
BTCUSDT:Sharing of the Latest Trading StrategyAll the trading signals today have resulted in profits!!! Check it!!!👉👉👉
Today, the price of Bitcoin has broken through the level of $100,000. Bitcoin's upward performance remains strong. In terms of trading operations, one can simply open a long position following the trend. Pay attention to the support within the range of $98,000 - $100,000. Wait for a pullback and then open a long position.
Trading Strategy:
buy@98500-99500
TP:100500-101500
The signals in the Signature have brought about continuous profits, and accurate signals are shared every day. Hurry up and click to get them!
👇 👇 👇 Obtain signals👉👉👉

$BTC Finally $100K Surprised and Take Profit Done✨ CRYPTOCAP:BTC Surprise Finally Touch $100K Milestone again, All Take Profit and bonus Done.
💫 From Breaking News:
• Arizona Bitcoin Bill: Crucial SB 1373 Advances for State Bitcoin Reserve
• New Hampshire Becomes First to Approve Bitcoin Reserve—Will Other States Follow?
First introduced in January, HB 302, gives officials the ability to allocate state funds to both precious metals, and specific digital assets with a market capitalization of over $500 billion. That means Bitcoin, which, as of this writing, has a market cap of roughly $1.9 trillion per TradingView, is a prime candidate.
The newly enacted law states that any digital assets obtained must be kept using high security custody protocols. This can be done directly in a state managed multisignature wallet, via a qualified financial institution custody, or by investment in U.S. regulated exchange traded products (ETPs). Dennis Porter, CEO and Co-Founder of Satoshi Action, said:
“Satoshi Action drafted the model, New Hampshire engraved it into law, and now every treasurer nationwide can follow that roadmap. HB 302 proves you can protect taxpayer money, diversify reserves, and future-proof state treasuries all while embracing the most secure monetary network on Earth. New Hampshire didn’t just pass a bill; it sparked a movement.”
#Write2Earn #BTC #BinanceSquareFamily #MarketRebound #SUBROOFFICIAL
Disclaimer: This article is for informational purposes only and does not constitute financial advice. Always conduct your own research before making any investment decisions. Digital asset prices are subject to high market risk and price volatility. The value of your investment may go down or up, and you may not get back the amount invested.

#BTC how will it develop next?📊#BTC how will it develop next❓
🧠From a structural point of view, we are currently moving near the weekly resistance zone. We can only judge that we have successfully broken through the resistance zone when the closing price of the weekly candlestick chart is higher than the blue resistance zone, so we still need to remain vigilant before this condition is met.
➡️If we continue to break through the previous high, it means that the bullish power is still continuing, but the breakthrough is near the gray resistance zone, so wait patiently for the opportunity of a pullback before considering participating in long trades.
➡️I am not considering participating in short trades at present, because short trades are still counter-trend trades. I will only look for short trade opportunities after breaking the inflection point 93340 to establish a short structure or the price rises to the red target zone.
⚠️The Federal Reserve interest rate decision will be announced today, and we will wait patiently for the signal of market structure to appear.
Let's see👀
🤜If you like my analysis, please like💖 and share💬
BITGET:BTCUSDT.P

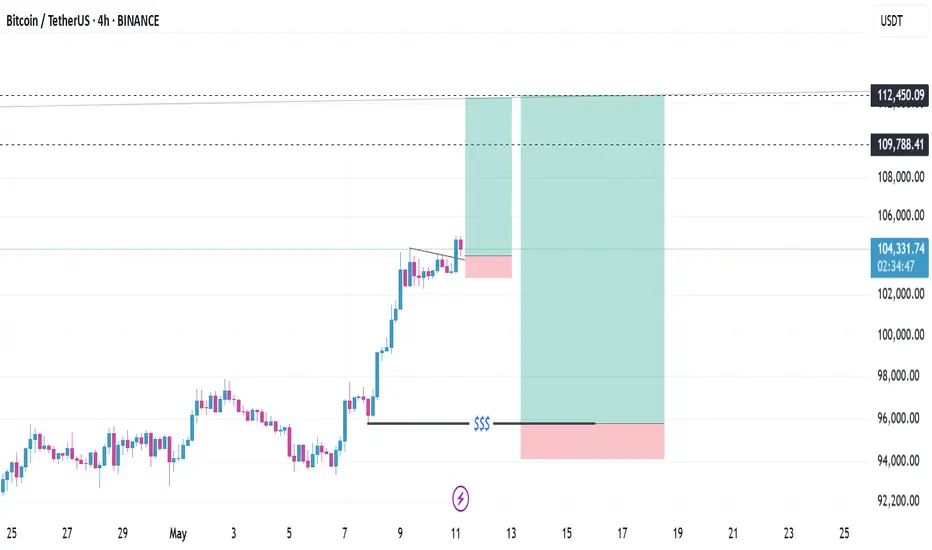
Nice trade set up yesterday, watch these Trades for the weekWe got a delicious deviation from range low yesterday giving us an easy 9x.
Can we get in on a continuation long up to supply?
