its just sample sizeThe high at 4 a.m swept all the weekend bad highs (higher than the rest)
on CME theres only 1 candle (to rule them all) and a gap down of ETH (electronic trading hours)
in my experience gaps that form on weekends and gap on ETH get filled even more likely than the ones who are formed on ETH and shown on RTH (regular trading hours)
i like that this high is higher than the range and is back in the previous range it aligns with liquidity concepts.
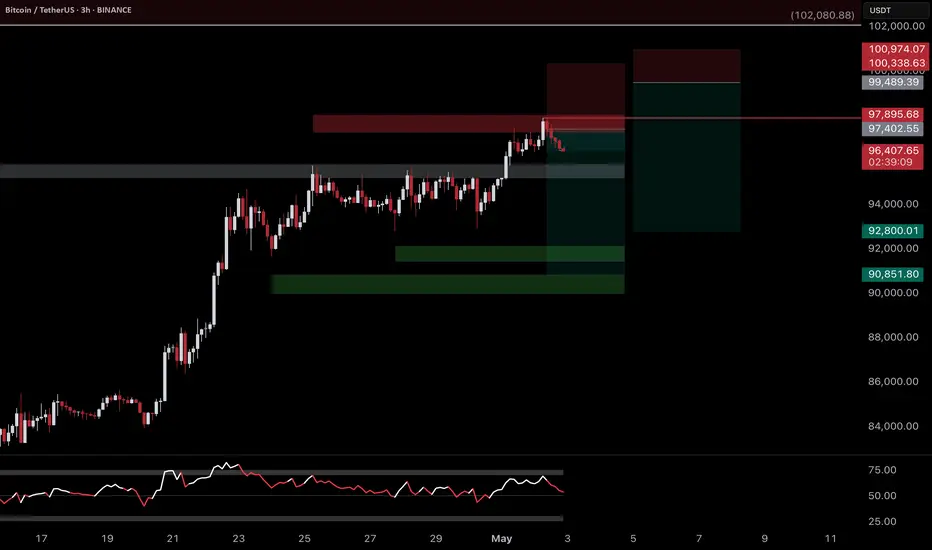
also, on this range we can observe that the RSI is going down slightly while price remains the same. that indicates a momentoum slowdown and CVD is making higher highs while price stays in the same range which indicates aggressive buyers are actually not making a lot of progress.
I have a short now because i like this structure and my odds.
we can easily have one last sweep of liquidity twards 106 but for now im enjoying my short probabilities.
my first target is 98k where i will attempt a long if the data looks good (hidden bullish divergence, structure, swing fail pattern etc)
the long and short are there to hedge themselves.
if 97 is broken, tho.. we will break the trendline.
bearish retest of this trendline will cascade us into the stoploss domino pieces falling.. i will not stand in the way of this cheos and wait like a good boy around 82k 74k and 69k all while my short is still active.
im bullish for 2025.
BTCUSDT trade ideas

My swingsight on bitcoin,possible area of target $120K to $140KFrom impulsive move to pullback all marked (rectangle/golden zones) were being respected.I am now expecting another impulsive move to the upside particularly on $120K to $140K.DYOR and TAYOR.

12/05/25 Weekly OutlookLast weeks high: $104,972.46
Last weeks low: $93,385.49
Midpoint: $99,178.97
Bitcoin climbs over 12% from weekly low to weekly high, an incredible achievement despite a mixed performance in Tradfi. A pattern we've seen since the $74,500 double bottom following Liberation day goes; A strong rally for a week, consolidation in a tight trading range for a week, then repeat. Should this pattern continue we should see consolidation between weekly high and $102,075 (0.75 line).
CPI & PPI take place this week on Tuesday and Thursday respectively, inflation is still a big talking point but baring a crazy print I would be surprised if these events move BTC. In the last few hours at time of writing The US has reduced tariffs on China to 30% for 90 days, China has reduced tariffs on the US down to 10%. To me this signifies the worst of the trade war narrative is behind us.
This week I will be tracking altcoins with strong fundamentals as BTC.D rolls over from its highest point since January '21, ETH has already had a strong breakout from the downtrend and with BTC at ATH levels with strong resistance this should be the time to see altcoin strength and play catch-up.
Good luck this week!

#BTCUSDT SELL CHART The chart you've shared is a 45-minute candlestick chart for BTC/USDT on Binance, with a technical analysis overlay suggesting a potential bearish move. Here's a quick breakdown:
Highlighted Zone (Top, around 104,348 USDT): This appears to be a resistance or supply zone where the price has reversed previously.
Highlighted Zone (Bottom, around 102,853 USDT): This is marked as a potential support or target zone.
Blue Arrows and Patterns: These indicate a projected bearish move, likely based on a harmonic or price action pattern such as a double top or head and shoulders.
Red and Green Box: This shows a risk-reward setup — red is the stop-loss zone (above resistance), green is the take-profit zone (near support).
This chart suggests the analyst is expecting a short-term decline toward the 102,800 range.
Would you like help analyzing this setup further or converting it into a trading plan?

BTC on the edge of two way📊 Bitcoin Macro Scenarios — What’s Next?
We’re at a critical junction for BTC. The chart outlines two high-probability paths:
🔴 Scenario 1 (Red): Bullish breakout toward $175K with an initial target near $146K, marking the final impulse wave of this cycle before a potential major correction.
🔵 Scenario 2 (Blue): Mid-term pullback to retest the IDM zone around FWB:65K , before resuming the larger uptrend into 2026.
Key Levels:
• First Target: $146,800
• End Point: $175,500
• IDM Reclaim Zone: ~$65,000
Below the chart, our custom Long Short Dom (VI+) indicator confirms increasing bullish pressure — but divergence zones are also forming ⚠️
This is a make-or-break region. Patience and positioning will be key.
📅 Eyes on Q2–Q3 2025 for confirmation.
🧠 What’s your take — do we rocket or retest?

Bitcoin - Buy to sell set-upImo Bitcoin is forming a big three drive pattern. So the next move is expected to hit $160k and after that there will be a crash to $61k. Happy trading!
NFA. DYOR

BTCUSD SELLGiven the resistance levels and the hidden divergence, it returned to the previous support level.

Scenario #BTCUSDT long📉 LONG BYBIT:BTCUSDT.P from $104,353.0
🛡 Stop loss: $103,572.0
🕒 Timeframe: 1H
✅ Market overview:
➡️ The price confidently broke above $103,729 and held, confirming the uptrend.
➡️ The next target zone is $104,720–$105,090 — nearest movement objectives.
➡️ Volume increased during the impulse, indicating strong buyer presence.
➡️ A local support level formed around $103,729 — on a pullback, this zone may hold the price.
➡️ POC at $94,479 remains far below — the market has left the balance zone and is trading in an impulsive phase.
🎯 TP Targets BYBIT:BTCUSDT.P :
💎 TP1: $104,720.0
💎 TP2: $105,090.0
💎 TP3: $105,275.0
⚠️ Important: current structure BYBIT:BTCUSDT.P suggests possible correction (wedge breakdown), requiring caution or exit on key level loss.
⚠️ Despite the initial long from $104,353, a breakdown below $103,572 (stop loss) invalidates the long setup.
📢 If H1 closes below $103,572 — better to exit, scenario invalid.
🚀 Scenario BYBIT:BTCUSDT.P valid while holding above $103,729 — below that, correction likely toward lower targets!

BTCUSD STRONG BUY AREA BTCUSD strong buy area wait for market come these level and we will buy for swing trade at this we have trade to some scalping ( logic ) RBS level+tredline+liqudity
Stay tuned

BITCOIN READY FOR 108K AND 113K.BTC HAS STARTED ITS UPWARD MOVE AND HIGHER CHANCES OF HITTING 108K AND 113K.
THIS can be a good chance to buy Btc.
1- Use stop.
2-Break even at 1 ratio 1 or half stoploss least.
3-Dont give market all profit nor book all profit put some at breakeven and let trade move.
4-If h4 fvg didnt work then wait for whole fvg to be filled and long again when filled.
Good luck guys.


BTC 1H Chart setupThis chart features BTC on a 1-hour timeframe with a 50-period SMA, RSI(14), and trend lines. Created for technical analysis and personal reference. Shared for transferring to another account.

Bitcoin Low Time FrameBitcoin create a double top formation in low time frame
if 101.5 can hold its great, maybe some consolidation and chop
but if we break 101.5 i think 98k is possible

Bitcoin | Short | Target 92kThis technical analysis is for informational and educational purposes only. It does not constitute financial advice. Remember to always research and consult with a professional before making investment decisions. Good luck! 📈💼🚀
After $105K Peak, Bitcoin May Revisit 0.382 FOB Level!CRYPTOCAP:BTC is pulling back after hitting a high of $105,800
If you look at the daily chart, we haven’t seen any healthy pullback, the price has gone straight up.
In my opinion, a retest of the 0.382 FOB level around $94K would be a healthy correction for Bitcoin. Based on the liquidation heatmap, we’re also seeing liquidity building up at lower levels.
This is one of the signs of a pullback, which is important for a sustainable and healthy market.
Stay tuned and follow for more updates!

BTC TargetsIn my experience, my bitcoin targets for this cycle in consider to symmetrical movement could be one of the upper prices.

Bitcoin Short-Term Support Zone, Buy Zone & Extreme Danger ZoneBitcoin is now trading within its main long-term 100K-200K beyond entry and buy zone. These prices are listed green on the chart.
The support zone is above $91,000 and the extreme danger zone (which won't be tested—Bitcoin is safe and strong) is $89,250.
If Bitcoin trades below $95,000 this is a major opportunity to buy and even to open LONG (lev.) positions. Any trading above $90,000 is ultra-bullish.
If Bitcoin trades at $89,250 or higher market conditions remain extremely good but this is a rare opportunity. It is likely we will not be able to enjoy these prices again but if it happens, make sure to make the best of it.
Any trading below $95,000 is a super strong buy.
Any trading above $95,000 confirms the continuation of the bullish move.
Bitcoin is neutral while the Fed decision is in. When the Fed publishes its decision, there will be some volatility followed by growth.
» Late May 2025 the entire Cryptocurrency market will be ultra-bullish. Repeat, ultra-bullish this very same month.
» Whatever you do, buy and hold and accumulate like it is the end of the world. This is truly the last chance. You've been warned.
Thanks a lot for your continued support.
You deserve the best and you are Gold!
Namaste.

Bitcoin - now or never, sell in May go away! (crash soon)As long as Bitcoin is below the 0.618 FIB retracement and below the POC on the volume profile, Bitcoin is in a bear market, and we have a great opportunity to sell not only Bitcoin but also altcoins in general. Have you ever heard of the sentence - "Sell in May, go away?" That's exactly what you should do on Bitcoin if we take historical data into consideration. May is still a pretty good month for Bitcoin, but not in the case of bear markets. What we can see in the picture is that Bitcoin is extremely weak during the summer and very bearish in September! So you want to sell in May and buy in October.
From a technical point of view, the current price of Bitcoin is below the 0.618 FIB retracement of the previous February/March drop. A very strong resistance is ahead, so selling into this cloud may be very wise. Of course you want to sell at resistance and buy at support, not the opposite way. Right now I expect a drop to 85k also because the current uptrend created a pretty significant FVG, and these types of FVGs tend to be filled quickly.
Write a comment with your altcoin + hit the like button, and I will make an analysis for you in response. Trading is not hard if you have a good coach! It is not a trade setup, as there is no stop-loss or profit target. I share my trades privately. Thank you, and I wish you successful trades!

BTCUSDT trading signal analysis- Bullish Channel as an corrective pattern in Short Time Frame
- Break of Structure
- RSI - Divergence
- Change of Characteristics
- Completed " 123 " Impulsive Waves

Millions Of Trades Liquidated —Bitcoin Flash Jump Beyond $100KMillions of people are about to get liquidated. The thing is that they set up their orders so that liquidation only happens above 100K and they think they will be able to close their position before Bitcoin reaches that level if it doesn't break down.
First, Bitcoin is not breaking down. Just notice that every time there is any type of bearish action it is quickly bought.
Second. No, no second that's all.
Bitcoin is set to grow and will do so in a flash. Rather than a flash crash, a flash advance.
Bitcoin always surprises so prepare because this is what will happen. Rather than going down as the majority actually expect, Bitcoin will break-up and do so strong, so strong that there will be no time to react. People will be caught in the shock and while they wait to look around and see what happens, Bitcoin will be moving up.
Instead of $100,000, it will go to $102,000 or $104,000 or higher just to make sure that all the over-leveraged are kicked out before additional growth.
This is just a friendly reminder.
Pray for the dead bears and people without a clue, they are about to lose everything, for them, it will be tough.
On our side though... Enjoy the profits as they come.
Namaste.


#BTCUSDT:Price Moving Well From $88,000 to $96,000,Next $128,000Bitcoin has moved well from our last idea of $88,000 to $96,000. However, a small correction is expected, which could be a good point to enter a swing trade. This could take the price to a new record high of around $128,000.
We have three targets, but each can be set based on your overview. The last three candles are not clear, so it’s best to wait for price to have a clearer indication of its next move.
We wish you the best and good luck in your trading journey. Thank you for your unwavering support! 😊
If you’d like to contribute, here are a few ways you can help us:
- Like our ideas
- Comment on our ideas
- Share our ideas
Team Setupsfx_
❤️🚀

Bitcoin (BTC): Liquidity Grab Happened, Bullish CME Got FilledBuyers showed a strong dominance during the Asian session, where we had strong candles forming, which filled the bullish CME gap and formed some sort of resistance zone.
As we had a stronger rejection near the resistance zone, now we are going to look for possible MSB in the current area, which would give us similar downward movement.
We are going to wait for MSB as long as we are below the liquidity line.
Swallow Academy
