Bitcoin Weekly Chart Summary-2 (as of May 6, 2025)Trend: Bullish, inside a rising parallel channel.
Price: ~$93,767, facing resistance near $95K–$100K.
Support Zones: 88K, $80K, $73K.
Breakout: Confirmed from descending wedge; above major EMAs.
RSI: Neutral-bullish (~57), room for upside.
ADX/DMI: Positive trend, but flattening—watch for momentum shift.
Volume: Declining—needs breakout confirmation with strong volume.
Key Level to Watch: Close above $95K may target $110K–$120K; drop below 88K risks retracement.
BTCUST trade ideas

BTC, lets see bearish pin bar behaviourBearish pin bar appeared + bearish divergence, expecting to get into a minor correction before further growth.
This post is nostly dedicated to bearish pin bar to see how it works in real time environment during active trade.

Potential Short SetupA rising wedge is forming on the 4H chart, hinting at potential bearish pressure. Adding to the caution, CVD divergence suggests that buying volume isn't fully supporting the price action—possible exhaustion ahead.
⚠ Not Financial Advice ⚠
Trade with caution! If you don't have a proper risk management plan, DO NOT TAKE THE TRADE. Always manage your exposure wisely.

BTCUSDT:Sharing of the Latest Trading StrategyAll the trading signals this week have resulted in profits!!! Check it!!!👉👉👉
The price of BTCUSDT fluctuates around $100,500. Technically speaking, if it can firmly stand at the level of $100,000, it is expected to challenge the level of $105,000. If it breaks below $98,000, it may trigger a pullback. Pay attention to the support at $100,000 and the strong support at $98,000. In terms of trading operations, one can open a long position with a small position near $100,000.
Trading Strategy:
buy@100000-101000
TP:103000-105000
The signals in the Signature have brought about continuous profits, and accurate signals are shared every day. Hurry up and click to get them!
👇 👇 👇 Obtain signals👉👉👉


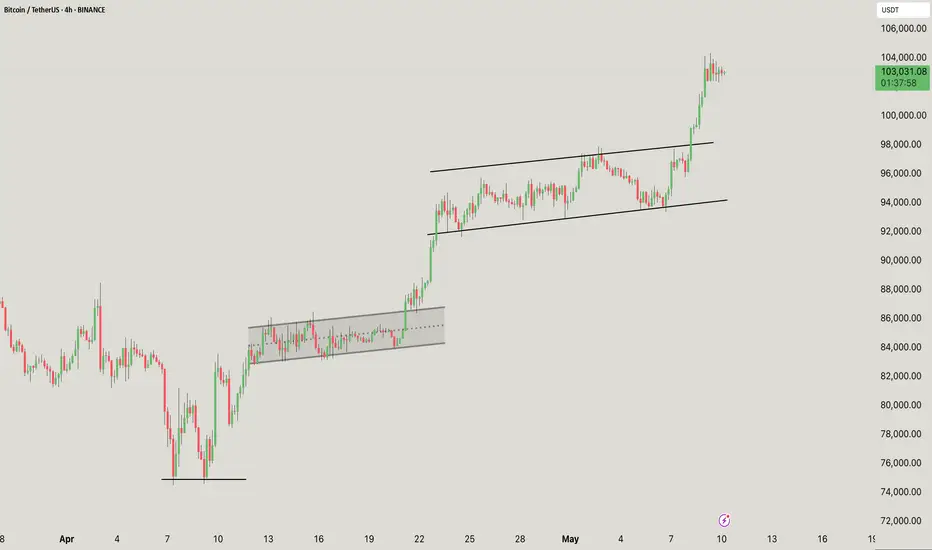
BTC/USDT Analysis – 4H Chart
This chart shows classic bullish continuation through ascending channels and consolidation breakouts:
A solid double-bottom structure was formed in early April
Marked the start of the uptrend
First consolidation box (~$90K–$93K)
Horizontal accumulation (highlighted gray box)
Resulted in a clean breakout and continuation
Rising channel (~$94K–$99K)
Rising Mid-trend consolidation wedge/channel
Price respected both trendlines
Eventually broke out to the upside → Strong momentum candle followed
Current Status (~$103K)
Price has broken above the rising channel
Now forming a new mini flag or consolidation at the top
Momentum is still in favor of the bulls
If you found this analysis helpful, hit the Like button and share your thoughts or questions in the comments below. Your feedback matters!
Thanks for your support!
DYOR. NFA
Bitcoin LongIf you feel sidelined this is an area where u can start bidding longs for that 103k target.
I think 97k is an area where btc can easily comeback to.

btcusdt - short i thinq time to short?
Push like if you think this is a useful idea!
Before to trade my ideas make your own analysis.
Write your comments and questions here!
Thanks for your support!


BTC path is clearShort term indicator showing side way channel consolidation, if bottom line breaks going down, if upside range breaks up going higher to 109k

$BTC go to 142000🪙 Bitcoin Analysis - Daily Timeframe
🚀 Entry Point:
The ideal buy entry is at $96,302, where we have a confluence of the 0.618 Fibonacci level, FVG, and a Breaker Block. This zone could trigger buy orders and potentially push Bitcoin towards the first target at its previous all-time high of $109,000, and ultimately to the final target at $142,650.
🔴 Critical Support:
The current support level is $93,947.
If a daily candle closes below this level, a bearish structure will form, opening the door for further decline to the next support at $85,000.
💡 Trading Signal: ❤️
Buy Limit: $96,302
Stop Loss: $93,347
Take Profit Targets: $109,000 - $142,000
🔵 Risk Management:
Risk only 1% of your capital in this trade.
Adjust margin size so that in case the stop loss is hit, your account loss will not exceed 1%.
This is a Swing Trade setup. Stay disciplined and manage your risk effectively. ✅

BTCUSDT-4Hafter sweep 3 levels of liquidity bitcoin can be corrective for saving energy to form new HH...

Bitcoin (BTC): We Will Re-Test ATHs | Crazy VolatilityCrazy movement is happening in the markets recently, where we are once again seeing markets being driven by news and enthusiastic bullish movement.
As we mentioned yesterday, if we see a break of the liquidity zone near $99K, we will be retesting ATH most likely, and this is our view as of now. FOMO on the markets will lead the price to upper zones where, once back at ATH, we will be looking for MSB.
Of course, if we see strong dominance by buyers near the ATH, then $140K might be the next target, but nothing is confirmed yet; it is just a thought.
Swallow Academy

“+$25K Profit & Still Long – Don’t Chase, Trade Smart”Since the drop to 74K, we've seen an incredibly fast and powerful rally over the past month—and I’m currently sitting on a realized profit of over $25,000 during this move.
One of the most bullish signals in this entire structure is that since the reversal in April, we’ve never seen a proper correction or trend-reversing retracement. As I mentioned in previous updates, this shows exceptional strength and suggests the uptrend remains firmly intact.
In fact, we’re climbing without breaking any key lows—what I like to call a “step-by-step” grind upward. On higher time frames, these look like strong bullish candles, meaning more buyers than sellers, and aggressive market orders pushing price higher. That’s a characteristic of strong trends—remember that.
Now, with the historical ATH at $109,000 getting closer, I do not expect an immediate breakout to new highs. Instead, we might see a healthy consolidation—either price-wise or time-wise—around this major supply zone. This is not the time to FOMO in.
The recent surge was fueled by comments from President Trump, and that breakout candle was significant. But sharp moves often bring sharp corrections. If price pulls back to the 96–95K zone and finds support, that could be the base for a new push toward all-time highs.
If you’re not in a position right now:
🚫 Do NOT rush into the market.
We are at a spot where both a breakout and a reversal are possible. Whether you’re using the lower or higher time frame, wait for clear confirmation—a pullback, a base, a proper setup.
Look to long only after strong support is confirmed, or short if price keeps failing to break highs. Either way, keep a tight stop and let your winners run—there’s still opportunity here, but only with proper risk-reward.
I’ll say it again because it’s important:
If you missed this long, it’s okay.
The market will correct—whether sharply or slowly—and your edge is not in chasing, but in being ready. Don’t let impulsive trades erase your capital or your confidence.
Oh, and by the way—I’m still holding my long position.

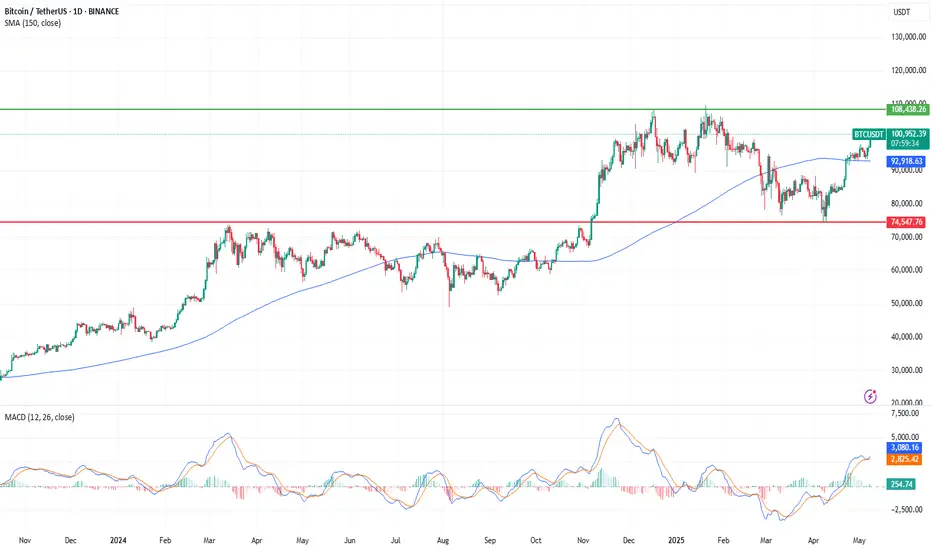
Bitcoin Approaches Key Resistance: Pullback or Breakout?CRYPTO:BTCUSD
📈 Technical Analysis (description for the post):
On the daily chart of BTC/USDT, we can see that the price is once again approaching the psychological and structural resistance around 108,000 USDT, a level that previously acted as a strong rejection zone. Currently, Bitcoin is trading above the 150-period simple moving average (SMA150), which reinforces a short- to mid-term bullish outlook.
The MACD indicator shows a clear bullish continuation signal, although already in high territory. This could suggest some short-term consolidation before a solid breakout. If BTC manages to break above the 108,000 USDT level with strong volume, it could open the path to all-time highs.
The most relevant support remains near 74,500 USDT, a key level that served as the base of the latest upward move. This structure allows for trading strategies with a favorable risk-reward ratio, especially for swing traders.
📌 This analysis is created using tools similar to those we integrate into our AI systems for traders. If you're interested in automating your strategy or implementing virtual assistants into your trading platform or customer service, learn more at:

Bitcoin Analysis - 7 MayThe price continues to move within the range of $91,700 - $100,400.
In approximately 3 hours, the FED will announce its interest rate decision.
The expectation is for it to remain unchanged.
If it remains unchanged;
there could be a horizontal consolidation between 94,990 – 97,500.
If a breakout occurs, the upward movement will accelerate; otherwise, there could be a pullback to the 91,781 – 94,990 levels.
If the interest rate is reduced;
the psychological resistance at 100,400 USDT may be tested, and if surpassed, the target of 109,605 (ATH) comes into play.
If the interest rate is increased;
the supports at 94,990 USDT and below could be tested quickly.
The levels of 91,781 and 85,085 USDT become potential targets.
With stronger selling, the support zone at the 2024 ATH level of 73,776 USDT may come into play.

BTC/USDT Analysis: Is the Long Trend in Question?
Hello everyone! This is a daily update from a CryptoRobotics trader-analyst.
Last week, posts were not published every weekday due to holidays — but we’re back now.
Yesterday, Bitcoin reached a support zone. Signs of defense were observed, but so far, there has been no meaningful recovery.
In the current buy zone, the power balance remains even: on one hand, market buyers failed to resume the uptrend, but on the other, we noticed absorption of sell orders according to delta analysis.
At the moment, the buyer appears weak, so entering long positions is not advisable.
The main scenario remains bearish. In addition to the two scenarios described yesterday, a third one has emerged — a short entry from the current price.
Sell Zones:
$96,100–$96,600 (local volume area)
Level $98,000
$107,000–$109,000 (volume anomalies)
Buy Zones:
$95,000–$93,400 (accumulated volumes)
$91,500–$90,000 (strong buying imbalance)
$88,100–$87,000 (absorption of market selling)
$85,500–$84,000 (accumulated volumes)
$82,700–$81,400 (volume area)
Level $74,800
$69,000–$60,600 (accumulated volumes)
What scenario do you think is most likely?
Share your thoughts in the comments — it’s always interesting to compare perspectives!
This publication is not financial advice.

Can #BTC hit a new all-time high?📊Can #BTC hit a new all-time high?
🧠From a structural perspective, the goals of the long structure in the daily support zone have all been achieved, so we need to be wary of the risk of a pullback! As we get closer to the all-time high, the resistance will become heavier, so I won't chase the rise here under huge pressure. I think even if a new all-time high is reached, the expectation of a pullback is very large.
➡️The current closing price of the weekly candlestick chart is above the blue resistance zone, so the resistance zone turns into a support zone. So if we want to participate in a new long trade, we should wait patiently for the price to return to this yellow support zone before considering it.
Let's see 👀
🤜If you like my analysis, please like 💖 and share 💬
BINANCE:BTCUSDT

BTCUSDTPreferably suitable for scalping and accurate as long as you watch carefully the price action with the drawn areas.
With your likes and comments, you give me enough energy to provide the best analysis on an ongoing basis.
And if you needed any analysis that was not on the page, you can ask me with a comment or a personal message.
Enjoy Trading ;)

BTC Technical Market Update! $110,000?Bitcoin (BTC) Technical Market Update
Over the past several trading sessions, Bitcoin (BTC) has demonstrated a pattern of strength, particularly visible on the 4-hour chart. Price action has consistently respected the Fair Value Gap (FVG) zones on this timeframe, taking support from these areas without breaching any significant downside levels. This repeated behavior indicates a strong underlying bullish sentiment, suggesting that market participants are actively defending key support zones.
Furthermore, Bitcoin recently approached a high-liquidity resistance zone—a level that historically acts as a supply barrier—and not only absorbed the liquidity but also decisively broke through it. This move implies that bullish momentum is firmly in control, and short-term resistance levels are being invalidated one after another. The market structure remains intact, with higher highs and higher lows supporting the current trend.
As of now, BTC has just bounced from a 4H FVG and is trading above that support. However, a short-term pullback remains possible. If such a retracement occurs, it is expected to revisit the next significant 4H FVG support zone, which lies approximately between $98,800 and $97,400. This area could act as a strong accumulation zone for buyers, potentially fueling another bullish wave. In the case of renewed upward momentum from this level, Bitcoin could target the $101,000 to $105,000 range in the short to mid-term.
Market participants are advised to remain cautious and observe price behavior as it unfolds in the coming days. Technical setups are aligning in favor of the bulls, but volatility may increase near key resistance and support levels. Always base your trades and investment decisions on thorough analysis, and keep in mind that no setup guarantees results.
Disclaimer: This is not financial advice. Please ensure you conduct your own independent research and analysis (DYOR) before making any trading or investment decisions.

Btc Future Scalp setupEnter at cmp 104200 2nd entry 103k, Sl 1hr closes below 102920 on binance future chart. Tp 106k this is a touch n go zone so put limit 105.8k. until unless we don't closes below 102920 at least 2hrs candle chances are high for new ath.

