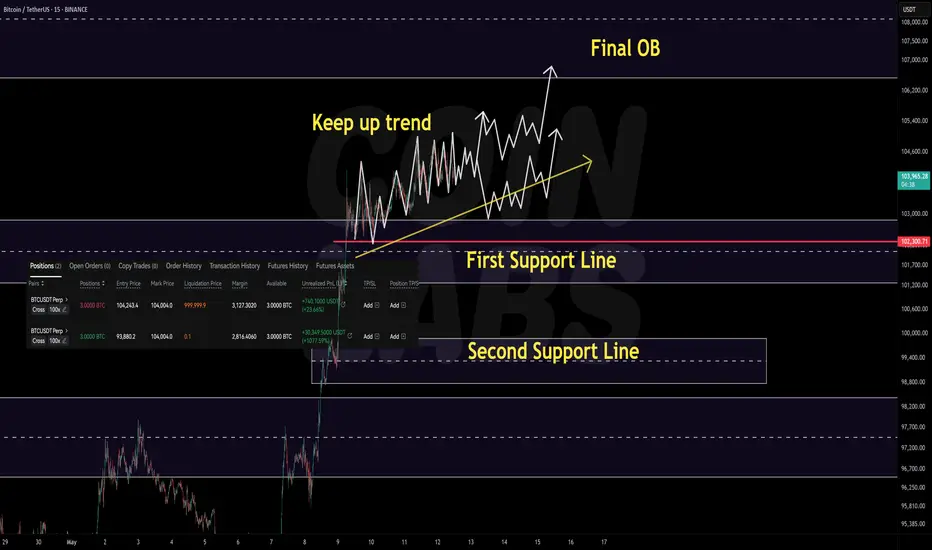
+$30K Unrealized | Still Long, Is ATH Next?Even after the strong rally that pushed Bitcoin past the 100K level, the price continues to hold critical support zones without breaking recent lows. We're seeing a steady, stair-step climb ("grinding higher")—absorbing previous supply through sideways consolidation while still making higher highs.
After forming a local high near 105,000, we’ve seen some pullback—but so far, there’s been no breakdown of major support, especially on lower timeframes. The structure still favors continuation to the upside, and the broader uptrend from the 74K–83K zone remains intact.
That said, we haven’t seen any major correction yet. With the market now testing the final supply zone before all-time highs, failure to break out could trigger a wave of profit-taking. This could lead to short-term selling from traders who bought lower, anticipating new highs.
We're now in a zone where volatility can spike in both directions, making it a tough area for clean entries. Long positions may feel risky due to the high level, and shorting too early might get squeezed out by another high. But this environment also presents great short-term opportunities—as long as you're quick and manage risk tightly.
If the current bounce fails to break above 105K, it may signal a larger corrective move. The first support zone to watch is 103K, followed by 99K. Even if price pulls back to these levels, the overall trend may still be valid—these are key zones where the uptrend could resume.
At this point, we must observe whether this bounce leads to further continuation or becomes a “trap” before a larger move down. If price holds the previous supply zones as support, we could see another leg up. If not, a deeper retracement may unfold.
This is also a zone where many traders may FOMO in, expecting an immediate breakout, only to get caught in a fakeout or shakeout. Personally, I think the market is more likely to test this final supply zone with increased volatility and a deeper correction before making a real move to new all-time highs. Risk management is crucial here.
We’ve had a strong rally with no significant retracements, and while the uptrend may continue, failure to break out soon—or if profit-taking kicks in—could lead to meaningful corrections. Be prepared.
To summarize, we are in a very important decision zone:
Will price continue holding the lows and grind higher to new ATHs,
or will it reject from supply and trigger a larger retracement?
Whatever happens next, don't rush into a position out of fear of missing out.
Wait for structure, wait for confirmation, and remember: entering one step later at a better level is far better than entering too soon and getting stopped out.
BTCUST trade ideas
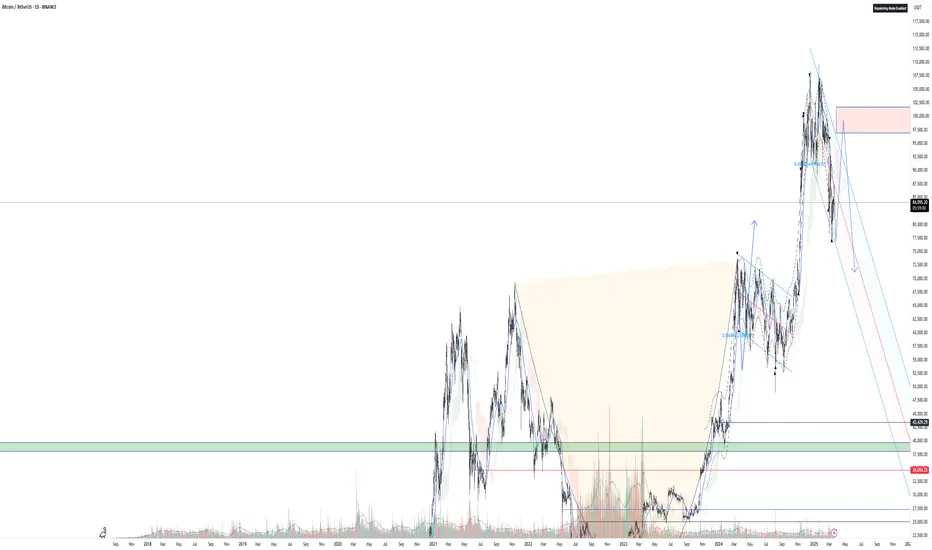
$6000 Leap for BTC?This idea is super concise!
Bitcoins price appears to have found support on a 3M 0.618 retracement level.
The logical next step would be a leap to the 0.786 retracement level at 102,000.
Looks like BTC is loading its canon..

Manifestation Manifestation generally refers to the act of making something visible or real, often through the application of visualization, affirmation, and positive thinking, in the belief that this will increase its likelihood of happening. It can also describe the outward expression of something, like a disease, or a public demonstration.

BTCUSDTPreferably suitable for scalping and accurate as long as you watch carefully the price action with the drawn areas.
With your likes and comments, you give me enough energy to provide the best analysis on an ongoing basis.
And if you needed any analysis that was not on the page, you can ask me with a comment or a personal message.
Enjoy Trading ;)

106k next target!BTC PUMP AND PUMPED , but 106k will the end of wave 3. Then fall to 102k (wave4) and after this correction we will have NATH (112) . Good luck 👍

Bitcoin resilience and momentum toward new highs?Bitcoin has demonstrated notable resilience in recent days, with price action maintaining a strong upward trajectory that suggests the potential for a move toward new all-time highs. This bullish momentum has persisted despite key resistance levels, signaling continued market strength.
Key Points to Consider:
- Bullish Market Structure**: The broader market continues to exhibit a bullish structure, characterized by higher highs and higher lows. This reinforces the ongoing uptrend and suggests that market participants remain optimistic.
- Key Highs Remain Intact**: Previous significant highs have not been breached to the downside, preserving the integrity of the bullish trend. This structural consistency indicates a healthy and sustainable rally.
- $104,300 – Major High Timeframe Resistance**: This level represents the last major resistance on the higher timeframes. A decisive break and close above this point would likely confirm a bullish continuation and open the door for price discovery beyond historical highs.
If buyers can sustain this momentum, the likelihood of a bullish expansion significantly increases. Importantly, there have been no clear signs of weakness — such as strong rejections or bearish reversal patterns — suggesting that market confidence remains robust.
Price action has consistently displayed strength, even at historically significant resistance zones. The absence of notable rejection at these levels is particularly telling, as it reflects strong demand and buying pressure. Such behavior often precedes continuation moves, provided volume supports the breakout.
A true corrective move or market pullback is likely to occur only after a **climactic volume node**, where excessive buying activity may lead to short-term exhaustion. Until then, the current trend appears well-supported by bullish sentiment.
However, **vigilance is crucial**. Once a correction does materialize — which is inevitable in any trending market — it may present a valuable "buy the dip" opportunity. During such phases, identifying and monitoring **key support zones** becomes critical to assessing the health of the trend and spotting optimal re-entry points.
Outlook:
For now, the momentum remains bullish, and higher prices are likely in the immediate short term. The market structure, strength at resistance, and absence of bearish signals all point toward the potential for further upside. Still, staying prepared for a correction and having a clear strategy for when it arrives will be essential for capitalizing on the next phase of the market cycle.

BTC Testing Critical Reclaim Zone on the 3D Chart
🚀 BTC 3D Timeframe Insight
📈 Bitcoin is pushing back into the upper region of its parallel channel, showing renewed strength after recent sideways action.
🛡️ Key Support Zone: Holding above the 99,500 – 100,500 area is vital for bulls to keep momentum alive.
⚠️ A solid close above this range could unlock the next leg up—continuation depends on this level holding firm.
👀 Price action around this zone will decide the next move—stay alert!

BTC 104k, what can we expect next?Bitcoin 4H Chart Analysis
1. Trend Structure:
Current trend: Strong bullish impulse from ~$84,000.
Price broke previous highs (~$100,000) and is holding above.
All EMAs (50/100/200) are sloping upward — confirming the uptrend.
No reversal signs yet in the current structure.
2. RSI (Relative Strength Index):
RSI is near 80, but is it overbought?
No clear bearish divergence on the 4H chart.
RSI might cool off via sideway consolidation movement, not necessarily a sharp drop.
3. Key Levels:
Current Price: ~$103,800
Immediate Resistance: $104,400–$105,000
Major Resistance: $106,800–$108,000
Immediate Support: $102,000 → $100,500
Key Support Zone: $98,000–$99,000
4. Scenarios:
Scenario A – Final push to ~$105k, then pullback
Price breaks $104.4k, reaches ~$105k, then retraces to ~$101.5k–$102k.
Probability: 60%
Scenario B – Strong breakout to $106k–$108k without pullback
Price continues impulsively despite RSI being overheated.
Probability: 30%
Scenario C – Reversal from current level (~$103.8k)
Price fails to break $104.4k, forms a double top or fakeout.
Probability: 10%
Conclusion:
Current trend is bullish, but momentum is stretched in consolidation.
Most likely: price will test $104.4k–105k and pull back slightly before deciding the next move up.
If price moves above $106k cleanly, we’re likely entering a new breakout phase and on the way for the new ATH!

BITCOIN ( Is this the final DIP ? )I bought the dip but it just keeps dipping!
it's time to put on my bear glasses and check this ponzi chart !! oh yeah
As you can see in these patterns the moments everyone ready for breakout, bitcoin dumps to another lower level and kills all hopium that moonboyz, frog army and GM gurus got
if you think that you are person who manage to buy the exact number at dip you are wrong too, like people who bought at 60k and had plan to sell at 90k
RSI looks bearish like the pattern , I start shorting at 17490 and not going to close it till 16950$
If you got crypto on Huobi and Gemini exchange watch out too
funds are NOT safu

Bitcoin long Long setup for those who believe that btc breaks all time highs.
If Btc does what it is doing , she will not let you buy the dips , because dips will be pretty small.
I think 101500$ might be a nice area to place a long order followed by another one at 99k.
Let us see what this month will bring on the table.

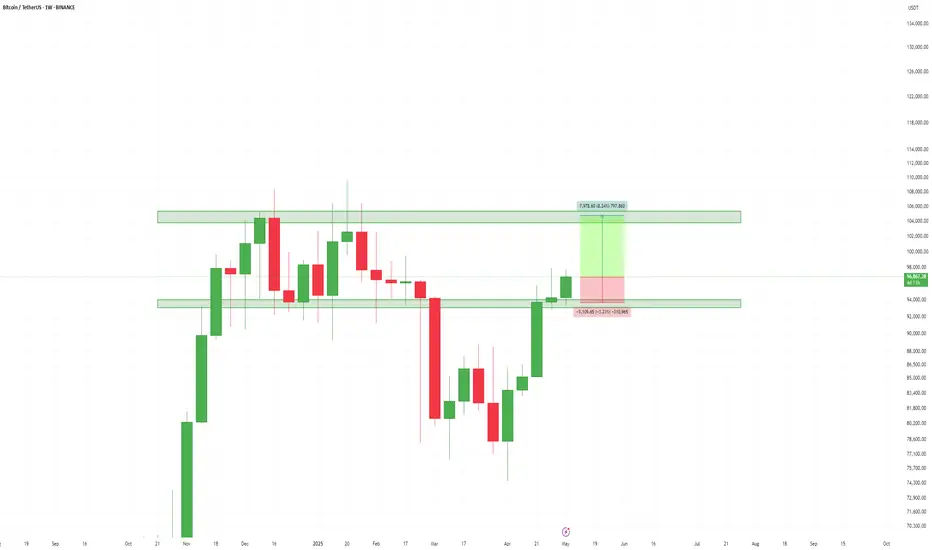
BTCUSDT: Safe Zone Vs Risk Zone, Which one would you choose? Dear Traders,
WE have possible buying opportunities, with the first entry, the only reason that we think that price would reverse is, possible end of year bullish push which may take price to another record higher high. Although, since the price already has rejected we think price is unlikely to reject at the level, and may drop to 75k region.
good luck.


BTCUSDT Take ProfitThe BTCUSDT trade I shared 44 minutes ago has just hit take profit. Hope you took advantage of the opportunity 🙂

Bitcoin MAsAfter a good rally bitcoin had 2 weeks age, now still managing and staying above 20MA for weekly, which is really bullish to me

BTC at a Crossroads: Bull Trap or Moon Mission?A possible bearish scenario is playing out on BTC, but hey—just one of many possibilities before the real bloodbath begins. 👀 This could just be a classic trap to lure people in before shaking them out. The key resistance zone is between GETTEX:97K and $101K, a big range to clear. If we flip it and close above $102K on the weekly, that would be amazing—but let’s be real, we’ll need a strong catalyst for that. If we do, then we’re likely talking about the $120K range.
On the flip side, if we drop lower from here, the most obvious support sits at $72K. Below that… well, let’s just say we don’t wanna go there—next real support isn’t until $50K. For everyone’s sake, let’s hope we don’t see those levels. Big decision point ahead—let’s see who wins this battle! ⚔️🚀

BTC Breaks 95K — What's Next?Bitcoin has finally broken above the tough resistance level at $95,000 , a level we’ve struggled to conquer for the past 15 days. It's now trading around $96,800 , and the bullish momentum appears to be building.
I believe this momentum could carry the price beyond GETTEX:97K – GETTEX:98K , potentially leading us to the next major resistance zone at $100,000.
However, $100K won't be easy to break. Expect significant profit-taking around that level, as we’ve seen in the past. Our previous failure to break above it led to a bloody market throughout 2024. While this time could be different, remember: $100K is a massive resistance wall.
Altcoins, meanwhile, have lost a bit of momentum, as capital has been flowing steadily into BTC. As Bitcoin gains strength and dominance, altcoins are temporarily being pushed to the sidelines.
But don’t lose hope— incredible altcoin opportunities are coming soon.
Stay tuned.
When to buy BTC again?BTC has two resistance levels on its way to reaching $120k. Another upward rally will follow if BTC consolidates above the $119.730 line. I'll add the two targets and update the chart in that case.

Bitcoin Long Long from 94350$ region.
There is a npoc level at that region .
Also there is a gap at around 97.2k to be filled .
Target remain 97.2k.

$BTC Update – Bearish Breakdown Alert! 🔻 🔻
BTC is breaking below the rising parallel channel on the 4H chart — a bearish signal suggesting potential downside pressure.
🔸 Price: $93,821
🔸 Channel Support Broken: ~ $94,500
🔸 Immediate Downside Target: $89,992
🔸 Stop Loss for Shorts: Above $95,715
⚠️ Warning: Avoid aggressive long entries unless BTC reclaims the channel support. Momentum is currently favoring the bears.

BTCUSDTI’ve cancelled this trade. The new setup will be the one I’m sharing now. 🔄📉
A potential short signal is forming on BTCUSDT. However, it's not ideal to open the sell position right now — we need to wait for the price to reach a specific level. Once it does, we can execute the trade.
So, what are the entry, TP, and SL levels for this setup?
If you’ve just started following me, let’s get started!
🔍 Criteria:
✔️ Timeframe: 15M
✔️ Risk-to-Reward Ratio: 1:1.50 / 2
✔️ Trade Direction: Sell
✔️ Entry Price: 95652.05
✔️ Take Profit: 95300.05
✔️ Stop Loss: 95827.73
🔔 Disclaimer: This is not financial advice. It's a trade I’m taking based on my own system, shared purely for educational purposes.
📌 If you're also interested in systematic and data-driven trading strategies:
💡 Don’t forget to follow the page and subscribe to stay updated on future analyses.

"...I'm tired, I'm leaving..."Well, that’s it — Bitcoin is tired of resisting the bears. As long as there was enough buy volume, the bears were offloading quietly. But now, we’re heading down.
Happy May holidays, everyone. I’ll post a more detailed update tomorrow — stay tuned!

Crypto psychology *special ep* : Short conversation with Wojack Wojack: Yo Monstralian, guess what—I just found this new coin that’s gonna absolutely crush it this year! It’s tied to AI, RWA, blockchain, Solana, and even AI agents.
Me: Oh really? How’d you hear about it?
Wojack: Bro, everyone’s talking about it all over social media! It already did a 5x from the bottom. I just bought in. This is my shot to finally pull a 10x and make back all the money I’ve lost.
Me: So you’re saying everyone on social media buying now is gonna get that 10x too?
Wojack: Not everyone, man. Some people don’t have the funds, others aren’t paying attention. Only a few of us are smart enough to buy at these prices.
Me: Hmm… but if it’s such a good deal, why didn’t the influencers hype it up earlier, when it was at the bottom? Why only now, after it’s already pumped 5x?
Wojack: That’s ‘cause the project just announced some huge news and big partnerships!
Me: But wouldn’t it have made more sense for them to announce that news when the price was still low?
Wojack: Bro, you’re overthinking this. People who overthink always miss out. I guarantee you’ll be chasing in once it’s up 10x—while I’m the one dumping on you!
* Bogdanoff receiving a call ...
Phone : "Master , he just went all in "
Bogdanoff : He bought ? ... (I let you say it in the comments)
BINANCE:XRPUSDT BINANCE:SOLUSDT BINANCE:ADAUSDT BINANCE:SHIBUSDT
