A massive f-you move from BTC....??Takes out the relative equal lows of Monday's range.
Bulls get wiped out.
BTCUST trade ideas


BTCUSDTHello Traders! 👋
What are your thoughts on BITCOIN?
Bitcoin has reclaimed the $90K– GETTEX:92K zone after a sharp 32% correction from its all-time high, closing the week strongly above this critical area.
As long as price holds above $90,000, the primary bias remains bullish. The $90K– GETTEX:92K area now acts as a key support zone, ideal for pullback buying opportunities.
A breakout above $101,000 could trigger a strong acceleration toward the next major targets at $115K–$125K.
A weekly close below the green support zone would invalidate the bullish scenario and suggest caution.
What’s your outlook? Will Bitcoin maintain momentum and break $101K? Share your thoughts below!
Don’t forget to like and share your thoughts in the comments! ❤️

Bitcoin, Repeating Patterns (Support Turned Resistance)On the way down, Bitcoin found support in a price range between $94,000 and $98,000 between 3 and 21 February. This support zone was weakened by repeated challenges and then it broke. Bitcoin went on to produce its 2025 pre-bull market correction bottom and low. Then the dynamics are reversed.
On the way up, the same price range that worked as support is now working as resistance, between $94,000 and $98,000. The more this range is challenged the weaker it becomes. Bitcoin will continue to weaken it until it finally breaks and we see additional growth. It is the same.
Just as prices found support for a while before moving lower, Bitcoin is challenging resistance before moving higher. What is certain is that the end result is higher prices.
Bitcoin is going up, ignore the short-term.
There can be small swings while this resistance zone is challenged, but it will definitely break. A higher high will happen next.
» Retraces and corrections are an opportunity to buy-in, rebuy and reload.
» Bitcoin is still a bargain below $100,000.
Thank you for reading.
Namaste.

Bitcoin short from 98200$This is how i think the market will react starting from next week .
Close NPOC print at 98k and then we have a Npoc print at 88k in binance futures, but in bitmex futures it is around 91.2k . Either way a drop is a must to shake everyone .

Rare Signal Confirms Bitcoin "As Bullish As It Gets" Michael SayThis is a rare signal. Bitcoin hardly ever closes four consecutive weeks green. When this event happens, it means the market is as bullish as it gets.
How are some people still bearish when the market is closing green four weeks straight?
How is that even possible? Continued growth for so long... It is obvious is what I say.
» Bitcoin will soon be trading above 100K.
Bitcoin is moving above $120,000 in May and will hit around $130,000 or can be higher; do you agree?
The bulls are in—the bullish bias is confirmed Bitcoin has been growing for an entire month. The best part is that it is still early, let me explain. Notice the trading volume, it is still so very low. This means that nothing has happened yet, there will be a major advance... So strong, it will break all resistance in a matter of days.
» Bitcoin is bullish now. The Altcoins are bullish now.
You can be certain that we are going to see growth daily, weekly, monthly long-term.
Bullish is good.
Adapt to the market. If it is bullish, don't fight it just join the wave.
Bitcoin is bullish now. 1,000,000%.
Thank you for reading.
Namaste.


TradeCityPro | Bitcoin Daily Analysis #77👋 Welcome to TradeCity Pro!
Let’s dive into the analysis of Bitcoin and key crypto indexes. As usual, I’ll walk you through the triggers for the New York futures session.
⏳ 1-Hour Timeframe
As you can see in the 1-hour timeframe, Bitcoin is still ranging, and volume has decreased compared to yesterday. In times like these when market volume is low, you need to pay closer attention.
✔️ Today, I’ve drawn an ascending trendline on the chart. When price performs very shallow corrections after an uptrend and each low is higher than the previous one, it indicates a very strong bullish trend. So if this trend continues, it can lead to some very attractive trade setups.
💥 As mentioned, volume is quite low today, and volatility is also lower than before. This means that most market participants are waiting to see what will happen before reacting. We should take the same approach and wait for our triggers to be activated.
📈 For a long position, it’s pretty clear that Bitcoin has a very important resistance at the 95370 level, which is currently the only long trigger. If you don’t have a position from lower levels, this is a very logical and attractive entry, and I suggest having a position ready if this level breaks.
📊 For a bearish scenario, we haven’t yet received confirmation, and we need to wait until at least the trendline is broken. After that, with the activation of a trendline trigger like the 93626 level, we can enter a short position.
👀 As I’ve said in previous analyses, I personally won’t open a short position unless Bitcoin reaches the 91945 level, as that’s my first confirmation for a trend reversal.
👑 BTC.D Analysis
Let’s check Bitcoin Dominance. The dominance range box continues, and yesterday it again moved upward from the 64.22 support and reached the range top at 64.60.
☘️ If you had opened a position on altcoins like ETH after their triggers activated yesterday, you probably hit stop-loss because of this dominance move. As dominance moved up after those triggers, capital flowed out of altcoins, causing many of them to fake out and fall back below their resistance.
📅 Total2 Analysis
Now for Total2. Just like Bitcoin, Total2 is forming a range box, but it has significantly less bullish momentum. While Bitcoin has some upward slope during its range, Total2 is completely flat and oscillating between 1.03 and 1.05.
⚡️ Triggers for Total2 remain unchanged: breakout of 1.05 for bullish confirmation and 1.03 for bearish. But just like I mentioned that I won’t act on Bitcoin’s 93626 break and will wait for 91945, here I also won’t act on a 1.03 break—I’ll wait for confirmation below 1.00.
📅 USDT.D Analysis
Let’s move to Tether Dominance. A new lower high has formed just below 5.14, and for now, I’ve adjusted the resistance level to 5.10, because as you can see, the price is reacting well to this area and we can use it as a trigger.
🧩 For a bearish USDT.D scenario (which would mean bullish for the market), breaking below 4.99 remains the key trigger. For a bullish USDT.D scenario, breaking above 5.10 would be the first confirmation of a shift in dominance upward.
❌ Disclaimer ❌
Trading futures is highly risky and dangerous. If you're not an expert, these triggers may not be suitable for you. You should first learn risk and capital management. You can also use the educational content from this channel.
Finally, these triggers reflect my personal opinions on price action, and the market may move completely against this analysis. So, do your own research before opening any position.

#BTC/USDT Update. Bitcoin is currently trading around a key resistance zone.
The immediate support lies near $95,554, while a confirmed breakout above $97,300 could trigger an uptrend toward $104,000.
Until then, trade with caution.
DYOR. NFA.

Bitcoin is poised for a 95K breakout. 100K target?After a fairly rapid growth (rally) bitcoin did not correct, the price could not reach 0.382 within the local correction, the range is squeezed between resistance and 0.236, which indicates a bullish interest in the current situation
The price has been in consolidation for the last 4-5 days. This is enough to break the resistance at 95600 and give us a good momentum.
Scenario: If bitcoin continues to slowly and gradually approach the 95600 resistance, there is a high probability of triggering a crowd when the resistance is broken, which will push the price to 100K.

Bitcoin is at a critical decision pointBitcoin:
Currently, Bitcoin is at a key resistance zone around the $97,500 level, which holds significant technical importance as it has acted as a price barrier multiple times in the past. In a bullish scenario, if Bitcoin manages to decisively break through this resistance and stabilize above this level, a strong upward movement could begin. With increased trading volume and buyer support, the price could target the next level at around $115,000. This scenario is particularly likely if positive fundamental factors, such as favorable news regarding Bitcoin adoption or improving macroeconomic conditions, support this move.
However, in a bearish scenario, if Bitcoin fails to overcome the $97,500 resistance and faces selling pressure, a price correction becomes more probable. In this case, the first significant support level is around $92,000, which could serve as an initial correction target. If selling pressure persists and this level is breached, the next support lies at approximately $89,500, which may act as a temporary price floor. Given the current market conditions and recent volatility, my personal view leans more toward a potential price decline, as technical factors and market uncertainty may strengthen sellers.
Risk Warning: Investing and trading in the cryptocurrency market involves high risk. Prices can be highly volatile, leading to significant profits or losses. Please conduct thorough research and seek professional financial advice before making any trading decisions. This analysis is solely a personal opinion and should not be considered financial advice. You are solely responsible for any trading decisions you make.
Good luck
Pooya Salehipour
Bitcoin long Long position from LTF .I think btc is ready for 98k npoc level.
Let us wait and execute the order.

Bitcoin - Follow the trend Until it breaksBitcoin - Follow the trend Until it breaks
Long at VAL
short in a case of bull trap

Bitcoin - Major Daily Imbalance and Possible Move to $105k?Bitcoin already broke out of the bearish structure a while back, and honestly, that was the first major shift everyone should have been paying attention to. Ever since that breakout, we have been building bullish structure on the higher timeframes, higher highs, higher lows, and overall strong momentum to the upside. This gave the bulls a clear advantage, and so far, nothing has really changed that bigger picture.
Consolidation Structure
Now, looking at the current price action, something important stands out. During the last big push up, Bitcoin left behind a massive daily imbalance zone. It is way too big to just leave open like that. Markets hate inefficiencies, especially ones of that size, and more often than not, these kinds of imbalance zones get filled at some point.
Because of that, I am fully expecting price to come down, revisit this imbalance area, and fill it properly before making any serious move higher. It is a natural thing for the market to do, clean up inefficiencies, grab liquidity, and then continue the main trend if the structure holds.
Bullish/Bearish Scenarios
The most important thing to watch here is how Bitcoin reacts once it gets into the imbalance zone. If we dip into it and then start seeing bullish reactions, I will be looking for confirmation that the bullish structure is still intact. Specifically, if we can avoid a daily candle close below the bottom of that imbalance, the bullish case remains valid.
However, if we get a full daily close below the imbalance, that would be a strong warning sign. That would tell me that the bulls lost control and we could be looking at deeper downside or a shift back into bearish conditions.
But as long as that does not happen, I am still looking for the market to respect the structure. A dip into the imbalance, hold, and then continuation higher, that is the ideal scenario.
Price Target and Expectations
If we get the reaction I am looking for after filling the imbalance, I think Bitcoin has a real shot at rallying towards $105,000. That level lines up perfectly with a strong resistance area on the chart, and it would make sense for price to reach for it if the momentum stays bullish.
Now, reaching $105,000 will not be easy. That is going to be a major test for the market. There will likely be heavy selling pressure around there. But if the trend stays strong and we keep putting in bullish structures even as we approach that resistance, it is definitely possible to break through eventually.
Current Stance
Right now, I am being patient. I am not chasing the current move higher. I am waiting for price to come back down into the imbalance zone. If we get a proper retest and hold, that is where I will be looking for my entries, targeting the move towards $105,000.
No daily close below the imbalance zone = bullish continuation plan still in play,
Daily close below = reassess everything and possibly step aside.
Conclusion
To sum it up, Bitcoin already shifted bullish a while ago with the structure break. Now it is just about cleaning up the inefficiencies it left behind during the move up. If the market does what it usually does, fill the imbalance and maintain bullish structure, then the setup towards $105,000 is very much alive.
Patience is key here. Let the market come to us. No need to force anything.
___________________________________
Thanks for your support!
If you found this idea helpful or learned something new, drop a like 👍 and leave a comment, I’d love to hear your thoughts! 🚀
Make sure to follow me for more price action insights, free indicators, and trading strategies. Let’s grow and trade smarter together! 📈

Bitcoin - Gearing Up for a Break Above Key ResistanceBitcoin has been grinding just below a key resistance zone, marked clearly around the 95,400–95,800 region. This area has seen multiple rejections in the past, making it a strong level where sellers are actively defending. Despite this, the broader trend structure remains intact to the upside, with price respecting a higher-timeframe ascending trendline and forming higher lows.
Consolidation Structure
Current price action shows a range developing just under resistance, with signs of weakening bullish momentum in the short term. We’ve had multiple wicks into the highs, but no convincing close above. On the flip side, there’s a visible support zone around 93,000–93,800, which has previously been used to absorb liquidity and fuel moves higher. This zone is confluenced by the ascending trendline from previous swing lows, offering a clear area for a liquidity sweep.
Bullish/Bearish Scenarios
In the short term, a pullback into the green support block looks likely. This would serve two purposes: sweep out late longs and provide fresh liquidity for a stronger bullish push. A dip into this level that still respects the trendline would maintain bullish structure despite violating the local higher low.
If price holds this zone and begins forming higher lows again, we could see an impulsive move into and possibly through the resistance. A clean break and close above 95,800 would likely open the door for much higher prices, as the level has capped upside multiple times and a breakout would likely trigger stop orders and breakout buying.
Failure to hold the green zone and the trendline, however, would break the short-term bullish structure and increase the probability of a deeper retracement, possibly invalidating the breakout thesis temporarily.
Price Target and Expectations
If the resistance breaks, the path toward 105,000 remains in play. That target aligns with the macro breakout structure and continuation from the trendline, supported by higher timeframe bullish sentiment.
What do do now
Watching for a pullback into 93,000–93,800 to see if liquidity is swept and support holds. No interest in chasing price into resistance. The key is to see how price reacts at the next low and then again at 95,800. If the pullback unfolds and buyers step in with momentum, that would provide the cleanest long opportunity into new highs.
Conclusion
The market looks poised for a short-term dip to rebalance liquidity before mounting a serious attempt to break a long-standing resistance zone. As long as the trendline is respected, the bullish structure is intact, and any sweep of local lows may offer a strong risk-reward entry for continuation toward 105k.
___________________________________
Thanks for your support!
If you found this idea helpful or learned something new, drop a like 👍 and leave a comment, I’d love to hear your thoughts! 🚀
Make sure to follow me for more price action insights, free indicators, and trading strategies. Let’s grow and trade smarter together! 📈

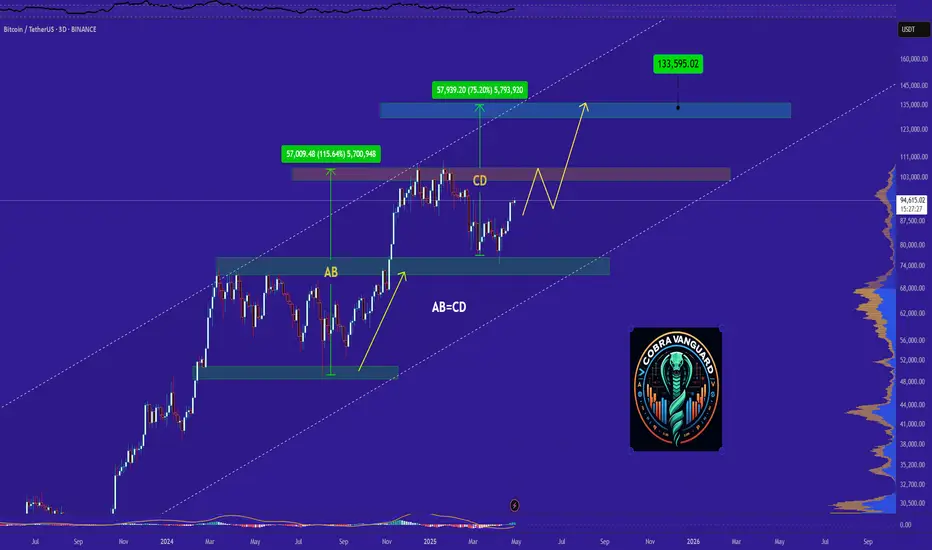
Do you think I'm joking ???I might be wrong and this might never happen, but it might come true From a technical perspective!!!
Give me some energy !!
✨We spend hours finding potential opportunities and writing useful ideas, we would be happy if you support us.
Best regards CobraVanguard.💚
_ _ _ _ __ _ _ _ _ _ _ _ _ _ _ _ _ _ _ _ _ _ _ _ _ _ _ _ _ _ _ _
✅Thank you, and for more ideas, hit ❤️Like❤️ and 🌟Follow🌟!
⚠️Things can change...
The markets are always changing and even with all these signals, the market changes tend to be strong and fast!!
BTCUSDT Roadmap From Demand to Potential Sell-Off ZoneBitcoin has successfully broken the descending trendline resistance, confirming a bullish continuation toward the upper levels. Price is currently supported by the Immediate Demand Zone between 90,970 and 92,917. Below that, a stronger support lies around the Strong Demand Zone between 84,011 and 86,374.
If momentum holds, Bitcoin is poised to test the 103,898 - 107,211 region, identified as a Dangerous Supply Zone where potential heavy sell-offs could occur. An extended push could aim for the projected high at 105,428.
Invalidation would occur if price sharply falls below 84,000, returning pressure to the downside. Structure remains bullish as long as higher demand zones continue to hold.

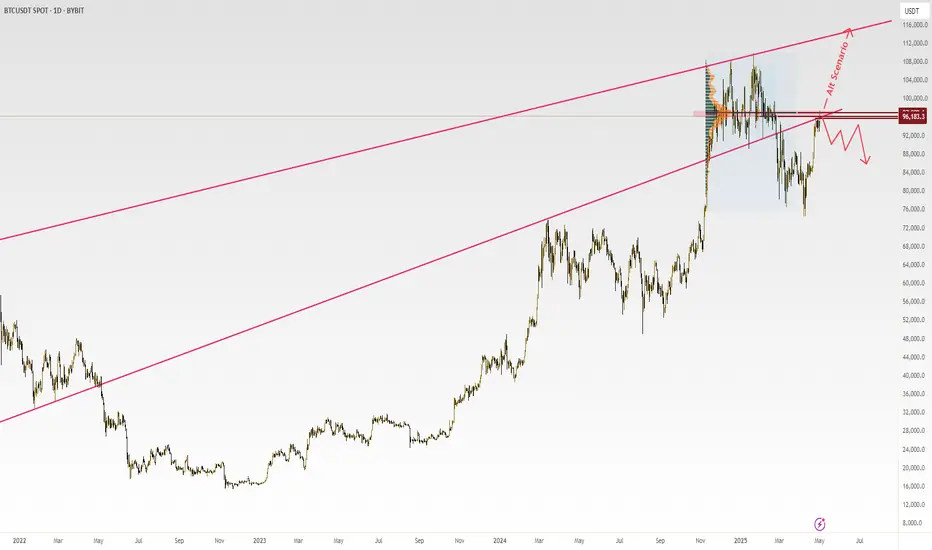
BTC alternative bullish scenarioI've posted a couple of macro scenarios for btc but this is just an alternative view, replaying what happened during the last bull cycle.
This alternative option is similar to others I've charted in that we have some kind of top end of September. I don't think it will be an instant retrace as price may fluctuate through Oct before bulls get exhausted.
Where this alternative differs from others, is that after this top we see a huge retrace to 73k (ish) then some kind of pump in Jan 2026 before a final dump down to 56-57k areas.
not a nice scenario but possible.

TradeCityPro | Bitcoin Daily Analysis #76👋 Welcome to TradeCity Pro!
Let’s dive into the Bitcoin analysis and key crypto indices. As usual, in this analysis I’ll review the futures triggers for the New York session.
⚡️ Not much has changed since yesterday, so without reviewing the previous analysis, let’s get into today’s setup to see what positions we can open.
⏳ 1-Hour Timeframe
As you can see on the 1-hour timeframe, the price is still within its range box. Even though yesterday it tested the lower range once and we expected a breakout to the upside, that didn’t happen, and the price was rejected from the 95370 resistance and continued to range.
✔️ After the rejection from this level, volume began to decline, which is a good sign. The lower the volume gets, the sharper the breakout move from the box is likely to be.
💥 If 95370 is broken, I definitely recommend having an open position, as the risk of hitting the stop loss is worth the potential gain. The target in case of a breakout will be the 98828 resistance.
⭐ The SMA99 is also providing good support and is currently sitting below the candles, which adds to the positive bias for this scenario.
🎲 If the price gets rejected from the resistance again, we’ll likely see more range-bound action today. But due to the strong bullish momentum, I don’t think the price will lose its support levels, and it’s likely to test 95370 again.
💫 That said, if I observe structural changes and see support levels like 91945 breaking, I’ll also be ready to take short positions.
🔽 However, for shorting, I think we should wait for more structure to form. Once the price shows more reaction to the 93626–95370 range box, and if 93626 breaks, we can enter a short. But right now, I’d personally wait for a break of 91945 before going short.
👑 BTC.D Analysis
Moving on to Bitcoin dominance, the range box is still intact, and price is above the 64.22 level. If Bitcoin breaks the 95370 resistance and BTC.D continues to rise without breaking below 64.22, then Bitcoin will outperform altcoins. If 64.41 is broken, we can expect a sharp bullish move in Bitcoin.
📊 To enter positions on altcoins, the best confirmation remains the break of the 64.22 level on BTC.D.
📅 Total2 Analysis
As for Total2, the 1.05 resistance still hasn’t been broken. To confirm the beginning of a bullish move in altcoins, we need a breakout of this level. The first target of this move would be the 1.07 resistance.
📉 To turn bearish, the first trigger is at 1.03. We’ll need to wait for the price to test it, so we can determine the precise level and react accordingly in future retests and breakouts.
📅 USDT.D Analysis
USDT.D behaves slightly differently from Bitcoin and Total2. While Bitcoin and Total2 are both near resistance and poised for a breakout, USDT.D is still some distance from the 4.99 support.
☘️ The probability of this support break coinciding exactly with Bitcoin and altcoin triggers is low. However, I believe this is a more significant trigger than Total2’s.
❌ Disclaimer ❌
Trading futures is highly risky and dangerous. If you're not an expert, these triggers may not be suitable for you. You should first learn risk and capital management. You can also use the educational content from this channel.
Finally, these triggers reflect my personal opinions on price action, and the market may move completely against this analysis. So, do your own research before opening any position.

Btc4hWelcome to king btc 3. Bitcoin is expected to have a price decline to 88760, given the 4-hour divergence and the pattern formed at 95000, and there the conditions must be examined, which will start a rise to 99800 or continue to experience a decline to 76600, and this is just a possibility. Stay tall.

BTC 1HA final liquidity hunt can be expected before or after the monthly close. Then we expect a correction movement with the first week of May.

BITCOIN New Update (4H)This analysis is an update of the analysis you see in the "Related publications" section
The 96k–97k zone is an important area. It is expected that with a touch or hunt of this zone, which we have shown on the chart with an orange circle, Bitcoin will give a correction and altcoins that are ready for correction will also correct.
For risk management, please don't forget stop loss and capital management
Comment if you have any questions
Thank You

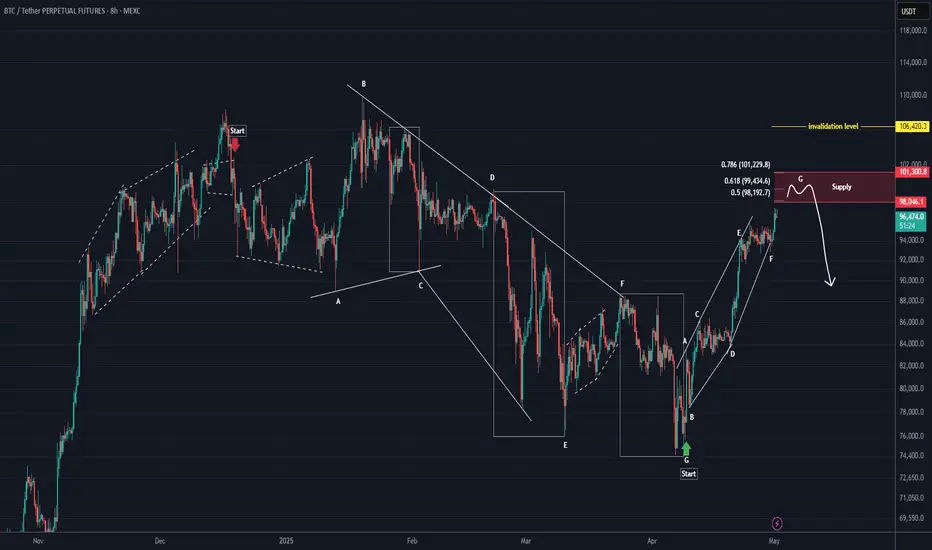
BTC New Update (8H)This analysis is an update of the analysis you see in the "Related publications" section
In the previous scenario, we considered that Bitcoin was in a diametric where wave E had extended. However, after reviewing the charts and analyzing various scenarios, we decided to revise the wave count as shown in this update, since wave E of the previous diametric scenario became overly extended.
You can see the complete wave count of the chart in this update. The correction in Bitcoin started from the point where we placed the red arrow on the chart. This correction was a diametric and ended where the green arrow is placed.
From the point where the green arrow is shown on the chart, Bitcoin's bullish wave has started, which is either wave A or W.
According to this scenario, the expected rejection zone should be between 98K and 103K.
The lowest-risk area for price rejection is the red box.
A daily candle close above the invalidation level will invalidate this analysis.
Let’s see what happens.
For risk management, please don't forget stop loss and capital management
Comment if you have any questions
Thank You