CRYPTOCHECK Throwback - BEST POSTS 2025New Year loading 🥳🥂
Setting up your trading technique and sticking to it
The Dunning Kruger Effect
How to trade Bollinger Bands
How to Dollar-Cost-Average
Spotting reliable Bottom Patterns
These ideas may help you improve your strategy and become a more profitable trader. Happy Trading!
Trade ideas

BTCUSDT Liquidity Grab at Resistance – Bearish Reversal SetupBitcoin is currently ranging between a well-defined resistance zone near 88,000–88,400 and a support zone around 86,700–86,300. Price action shows repeated rejections at the top of the range, suggesting strong selling interest.
🔵 Resistance Zone (88,000–88,400)
This blue block has acted as a major supply area. Each time price taps into this zone, sellers quickly push the market back down.
The circle on the chart highlights a potential final liquidity grab before a move lower.
• Expectation: Price may spike back into the resistance block to collect liquidity before reversing.
🟡 Support Zone (86,700–86,300)
This area has held multiple times and remains the primary demand zone of the range.
However, the reactions here are becoming weaker, suggesting buyers are losing strength with each test.
📉 Bearish Scenario (Most Probable)
• Price likely moves back into the 88,000–88,400 resistance to fill liquidity.
• From there, a rejection is expected as sellers dominate.
• A break below the support zone opens the path toward your target area around 86,400.
This aligns perfectly with the downward arrow drawn on your chart.
📌 What Confirms Bearish Continuation?
• Bearish rejection candles inside the resistance zone
• Break of structure below 86,700
• Increased sell volume on the push down
❌ Bullish Invalidations
The bearish outlook is invalidated only if price:
• Breaks and closes above 88,400,
• Sustains new higher highs on the 15m.
Until then, the setup remains bearish within a range-bound market.

(BTC) Update — Three-Drive Pattern Forming at Key SupportBitcoin is consolidating within the $75,000–$78,000 support cluster, where a potential three-drive reversal pattern may be taking shape. Price is trying to stabilise after a strong bearish expansion wiped out major structural levels.
Although downward momentum remains dominant, this region is historically significant for Bitcoin. The emerging three-drive structure, combined with early signs of compression, suggests the market may be preparing for a potential shift in direction.
Key Points
- Bitcoin stabilising inside the $75K–$78K support cluster
- Early signs of a potential three-drive reversal structure
- Market showing initial compression after extended downside
What to Expect
If Bitcoin completes the third drive and reclaims the $78K zone with momentum, a stronger recovery may form. Failure to hold this support could lead to deeper downside continuation.
Long btcAfter recording a new low, Bitcoin can now follow wave B after making its corrective wave C to the specified Fibo ranges.

Bitcoin - H1 Breakout Alert – Bulls Taking Control!BTC/USDT - Bitcoin has officially broken its descending trendline and completed a successful retest from the demand zone. This shift signals a potential momentum reversal, with buyers stepping in aggressively after weeks of corrective price action. BINANCE:BTCUSDT
🔍 Technical Overview
✔️ Clean trendline breakout on H1 timeframe
✔️ Strong retest at demand zone → buyers defended perfectly
✔️ Price now trading above the trendline, indicating bullish structure
✔️ First target: $95,000 (psychological level + key resistance)
✔️ Second target: $100,000 (major psychological level)
If bullish pressure continues, liquidity grabs above these zones could fuel an extended move.
📊 Fundamental Insight
Institutional interest rises, especially around accumulation zones
ETF inflows remain positive, boosting overall sentiment
#BTC #Bitcoin #BTCUSDT #Crypto #CryptoTrading #BitcoinAnalysis #TradingSetup #Breakout #TrendlineBreakout #PriceAction #TechnicalAnalysis #Binance #CryptoMarket #Bullish
💬 Support the Idea
If you found this analysis useful,
👉 Please LIKE 👍 and COMMENT 💬
Your support helps me share more setups daily!
⚠️ Disclaimer
This analysis is for educational purposes only.
Not financial advice. Always manage risk (1–2% per trade) and follow your trading plan.

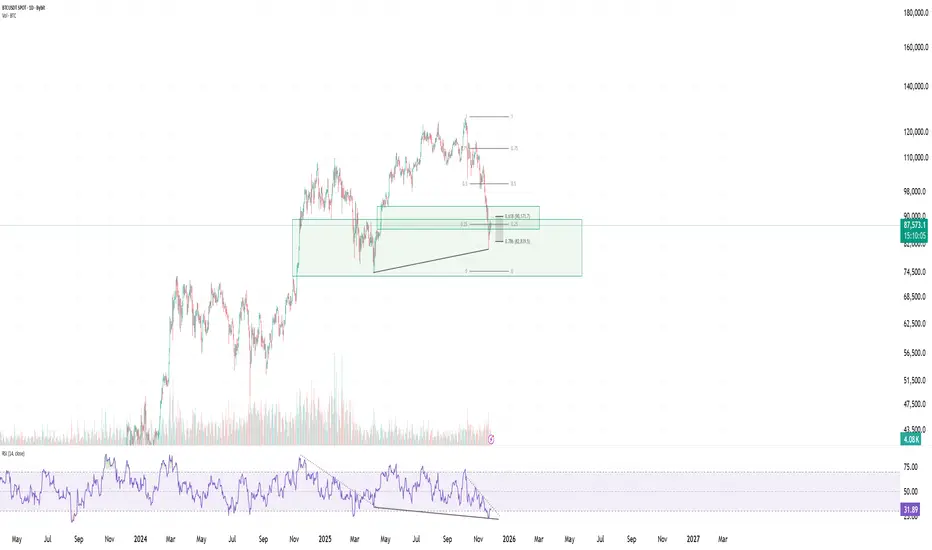
Bitcoin at Extreme Discount , Hidden Bull Signal AppearsBTC has now reached a major extreme discount zone, completing a deep retracement into one of the strongest demand regions on the chart. This level aligns perfectly with key Fibonacci supports, making it a high-value area from a technical perspective.
Price has tapped the 0.618 – 0.786 Fibonacci cluster, which historically provides strong reactions during corrective phases. Combined with a clearly defined demand block, this forms a confluence that often marks the end of a corrective leg rather than the beginning of a deeper breakdown.
At the same time, the RSI is showing a hidden bullish divergence, where price makes a higher low while RSI makes a lower low. This pattern typically appears during continuation setups and suggests that underlying bullish strength may be returning despite the aggressive downside move.
These elements together create a scenario where the market is positioned in a high-probability reaction zone. As long as BTC holds above the key demand structure, the technicals support the idea of an upward continuation forming from here.
Key Technical Highlights:
• Strong confluence between the 0.618 – 0.786 Fibs
• Price is inside a major discount demand zone
• RSI showing hidden bullish divergence (continuation signal)
• Structure still supportive of an upside bounce as long as demand holds
• Market conditions resemble previous early-reversal zones
In simple terms: BTC is sitting inside a major discount area, touching the strongest Fibonacci supports, and RSI is flashing a hidden bullish signal. If this zone holds, it may mark the beginning of a recovery phase.
BTC – Inside Monday’s Range During a Holiday WeekWe are currently trading inside the Monday range, and given the holiday conditions, price action is likely to stay contained.
🎯 Base case:
Trading the range until it breaks makes the most sense.
With the bullish opening of the day and 0.5 retracement of the range holding, the most probable scenario is a sweep of Monday’s high.
However, once Monday high is taken, we also have resistance there. If we get a bearish daily open afterward, I would look for shorts.
These remain the highest-probability plays for me.
If we get a strong bullish close after taking Monday high AND hold above TWO, then something may be shifting. Until then, I’m keeping decisions strictly based on the scenarios above.

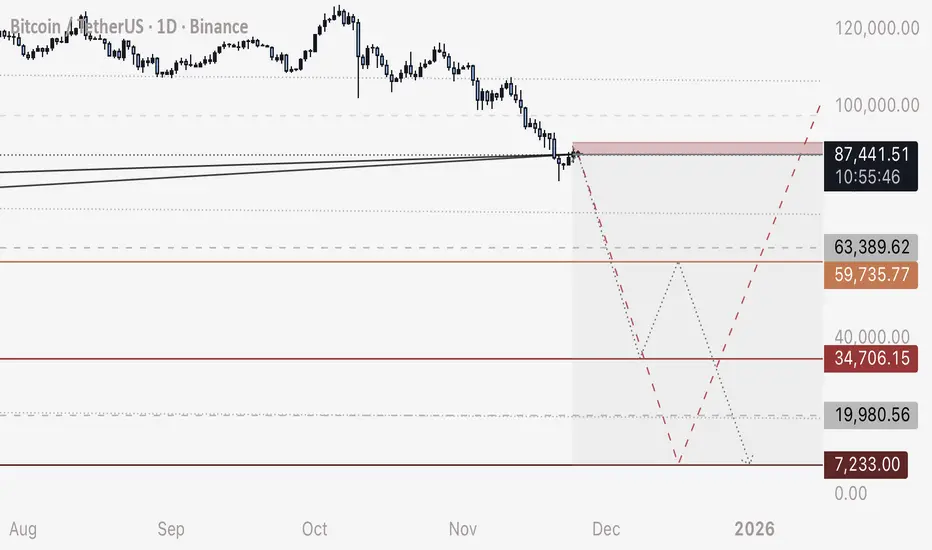
BTC - Short Update - Next Three MovesAs an update to my BITCOIN short plan, here are my next three expected moves / trades:
1. SHORT
Entry - 87,500-87,800
Stop Loss - 89,700
Target - 38,000 (exact wick bottom expected 34,700)
2. LONG
Entry - 34,800 to 35,500
Stop Loss - 33,000
Target - 55,000
3. SHORT
Entry - 58,500 to 59,500
Stop Loss - 64,000
Target - 10,000
Happy Trading
- DD
BTCUSDT.P - November 26, 2025Bitcoin is consolidating in a choppy range after early gains, with price repeatedly testing support at 86,547 and resistance around 88,200. A breakout above the upper boundary signals momentum toward the next major resistance at 91,882, while failure to hold current support risks a push to the stop level near 83,866. The current price action reflects indecision, as neither bulls nor bears control trend structure. Technicals suggest trend confirmation will depend on a decisive move away from the 86,547–88,200 range.

Bitcoin’s Overshoot Zone: Panic, Patience or Both?Bitcoin didn’t crash.It unwound.
Not with one dramatic candle — but through weeks of slow bleed, where every bounce gave hope and every rejection drained it further.And now price sits in a place most people don’t know how to act in:
The Overshoot Zone.
.......................................................................................................
This isn’t a buy zone. It’s a psychology zone.
Price has travelled from mid structure all the way down into the extreme −125% to −150% Projection Range.
This zone isn’t about calling bottoms.It’s about watching behavior.
Historically, this area attracts two types of players:
Those leaving out of exhaustion
Those entering with patience
The problem is — you can’t tell which side is winning until the structure changes.And that’s where most traders lose emotional control.
............................................................................................................
What the channel is telling us -
This wasn’t random selling.Price followed a clean descending channel for weeks.
Every recovery stalled at the channel top.Every bounce turned into distribution.
But now there’s a shift:
Momentum is slowing.
The slope is flattening.
Candles are compressing.
This isn’t strength yet — but it is a change of energy.And energy always changes before structure does.
...............................................................................................
Why this zone matters psychologically? Most retail psychology moves like this:
Hope
Confusion
Frustration
Capitulation
Numbness
The Overshoot Zone usually lives between stage 4 and 5.
Where:
Fear gets quieter
Volume spikes or dries
Everyone starts waiting instead of reacting
Not because price reversed but because most participants are simply exhausted.
.....................................................................
What to observe instead of predict
• If price stabilizes in this band → it’s not bullish, it’s absorption.
• If price expands below it → it’s not weakness, it’s unfinished fear.
Either way, this zone isn’t for excitement. It’s for observation.
..............................................................................................
Chart structure presented using Projection Levels + NeuroPolynomial Channel.
These are structural frameworks, not prediction tools.
..............................................................................................
#BTC #Bitcoin #BTCUSDT #MarketPsychology #PriceAction #CryptoTrading

Bitcoin (BTC): MSB Has Been Formed, Potential Push | BullishBTC formed the market structure break, which is the first step towards breaking the curse of the bearish trend that we have been having for quite some time now.
What we are looking for now is simply a confimational BOS at $89,150. There should be more movement to higher zones once we have that.
Swallow Academy

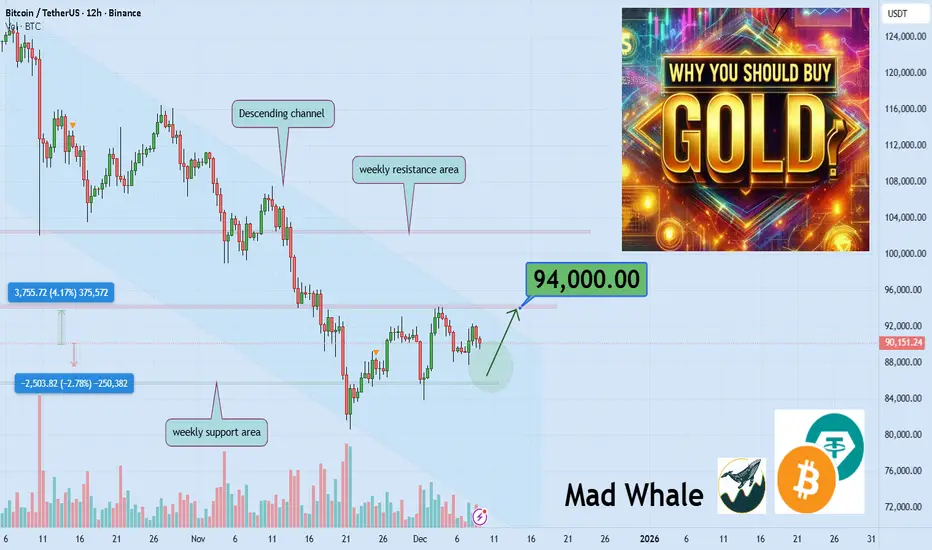
“BTC Pressure Point – Rising Channel Losing Steam ”🌊 BTC Channel Watch – Trendline Under Pressure 🏄♂️📉
BTC’s flow is pretty straightforward right now. Price has been climbing inside that small ascending channel, but today it’s leaning hard against the lower trendline — and the candles look tired. No strength, no conviction, just soft taps drifting downward 🌬️.
Above us, the 90K block is still the major supply zone. Every time price even peeks at that area, sellers show up instantly. It’s a ceiling that hasn’t cracked once, and BTC isn’t even close to giving it another test yet 🧱🚫.
If this rising channel breaks down — and honestly, structure already looks weak — we could see a clean continuation lower. There’s no strong demand pocket sitting in between, just open space for price to glide down smoothly 📉🌊.
So right now I’m focused on how BTC behaves around this trendline:
👉 If bulls defend it with real momentum, we may get another push inside the channel.
👉 If not, the next wave looks aimed lower — the red curve on the chart basically shows the flow 🔻.
Not predicting, not trying to force the market. Just reading structure, staying patient, and letting the waves speak for themselves 🏄♂️🌬️.
💬 What do you think about this scenario? Only share your idea if you’ve got another opinion — otherwise just hit that button 👍
#BTC #Bitcoin #Crypto #Trading #TechnicalAnalysis

BITCOIN:LIVE TRADEHello friends
considering the decline we had, the sellers made a bottom and the buyers came in. The sellers again broke the previous bottom with strength and made a bottom, and the buyers came in and raised the price and succeeded in hitting a higher ceiling.
And in the pullback, the open price is supported and here we can enter a buy transaction considering the support of buyers and hitting a higher ceiling, of course with risk and capital management and be careful not to make emotional decisions.
*Trade safely with us*

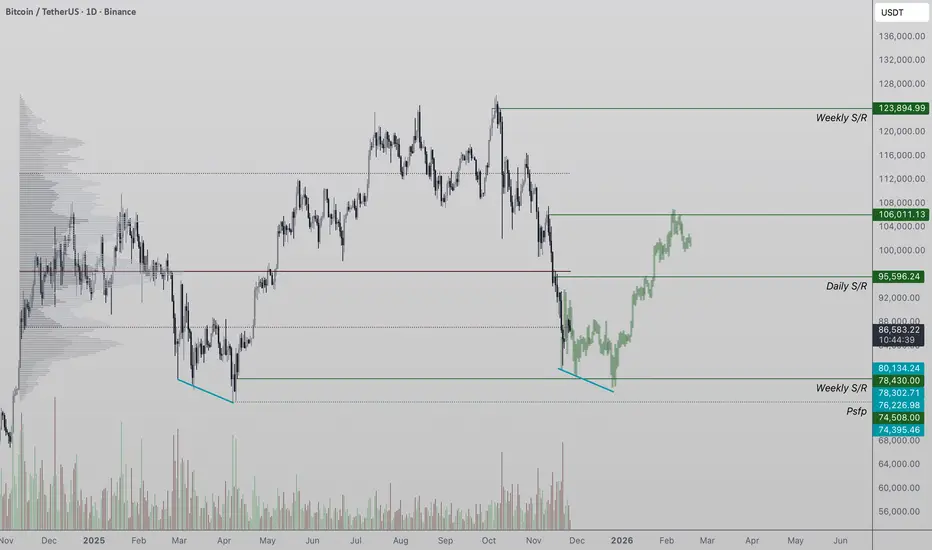
BTC/USDT Building an Early Base, High Chance to Retest 93K-108+BTC/USDT — Building an Early Base, High Chance to Retest 93K → 108K+
Bitcoin is forming a stabilization zone between 80K and 93K, which could mark the start of a deeper recovery phase. The recent bounce off the lower boundary suggests that buyers may be re-entering, setting up a potential long-term trend shift.
Key Technical Points:
📉 Support Zone: The lower range around 80.6K has held, showing strong demand at these levels.
🔁 Current Structuring: BTC’s price action shows a gradual range build — this isn’t just a short-term bounce, but a possible formation of a base.
🎯 First Upside Target: A clean breakout above 93K would signal renewed strength and is likely to trigger further buying.
🚀 Extended Target Potential: If momentum confirms and volume supports the move, BTC could aim for the 100K+ region. This would align with a multi-wave recovery to reestablish higher long-term structure.
Trade Outlook:
Holders: This could be a key accumulation setup — building on strength around the base may pay off if the breakout runs.
Short-term traders: Watch for a breakout above 93K with volume as your trigger for re-entry or scaling in.
Risk: If BTC fails to reclaim 93K decisively, a retest of the 80K base is still possible.
Summary:
There’s a realistic and structurally sound scenario where BTC could recover from this base and push toward 93K, with a strong shot at going 100K+ if the breakout materializes. Conditions are setting up for a potential multi-wave uptrend, but confirmation will be critical.

BTC - NEW ATH in December or DROP?Hello BTC Watchers 📈
Bitcoin has, historically, been very bullish in Decembers. We see the most drastic increase in 2020, when BTC climbed over 140%.
During the times that BTC corrected over December, it's been 10% and 31%.
This makes it hard to predict seeing that it seems to be different every year with one year even trading in a tight range.
A few things we can do to clarify the possible direction of BTC This December:
1️⃣ Check the Macro
From a macro perspective, Bitcoin has increased and been increasing since April, with the hard drop only showing now in November.
This could mean two things - the correction before a final leg up or, the beginning of the bearish cycle.
2️⃣ Check Technical Indicators
a) The moving averages is pointing towards short-term BEARISH, since we are trading UNDER the 200d Moving averages(green line):
b) The Bollinger bands are showing an expansion (aka widening) but to the bottom, as the price is trading on the lower BBands, also indicating strong selling pressure for the short to near term:
3️⃣ Watch the News
Bitcoin has been coming up in many seemingly "bullish" articles. This is usually a bad sign before the liquidation - create hype, and then short the market.
Conclusion:
I'm leaning towards a soft pump in December to soften the blow of the current correction , but not a new ATH. The next increase will likely be a "fake-out" before the real bearish season starts in the new year.

BTC Weekly – Potential Buy Zones
**BTC Weekly – Potential Buy Zones**
Based on the BTC.w chart, the yellow zones appear to be suitable areas for those planning long-term investment and considering the possibility of a deep correction.
With this approach, you can place laddered buy orders around:
$75K – $65K – $50K
and even $28K
If Bitcoin behaves similarly to previous cycles and corrects around 77%, reaching the $28K range is not unrealistic.
This scenario is fortunate for those holding cash, but unfortunately difficult for those who bought Bitcoin or altcoins at higher prices—although smart dollar-cost averaging** can help reduce losses.
In the most pessimistic scenario, we must also consider one point:
There is a gap in the $12.5K–$15K range. Major global events—such as **wars, geopolitical crises, or internet disruptions**—could easily push the market toward that zone.
Everything ultimately comes down to three key actions:
Patience… Selling… Buying…
and knowing *what you will do, and where.
What’s your opinion?


How to Buy Gold, Which Type to Choose, and Avoid Scammers?!If you want to profit in this inflationary market, you need to know how to buy gold, which type to choose, and how to protect yourself from scammers. Choosing the right type of gold and a reliable source is the key to success. Careful research and safety measures will protect your investment from unnecessary risks.
Hello✌️
Spend 3 minutes ⏰ reading this educational material.
🎯 Analytical Insight on Bitcoin:
From a technical standpoint, Bitcoin needs to fill that unusual gap it sharply created to the downside a few days ago. The price is currently forming a head and shoulders pattern, and everything now hinges on the crucial support level sitting right below its neckline. If this support holds firm, we can expect a rebound and the bullish scenario I've mapped out on the chart becomes likely. However, if it gives way, a further decline toward the next target is the more probable path. I've defined targets for both scenarios. Personally, judging by the technical confluence, I still see a credible chance for a recovery and a move upward.
Now , let's dive into the educational section,
💰 Inflation and Its Impact on Investment
Inflation is the main reason investors are returning to gold.
As currency value declines, safe-haven assets like gold become more attractive.
Investors should understand that gold can preserve wealth in almost any condition, but how you buy it matters a lot.
🏅 The Best Way to Buy Gold
Jewelry gold has high taxes and manufacturing costs, so profits are limited.
Buying physical melted gold is the best option, provided there are no legal restrictions in your country.
In countries where physical melted gold is restricted, reputable non-physical gold can be a suitable alternative, but check the company’s credibility and real gold backing carefully.
Always purchase from certified, reliable companies.
Never put all your investment in one asset; diversification is essential.
🧠 Investor Psychology and Behavior
Greed and fear can disrupt your decisions.
Many people enter the gold market without research and fall victim to fraudulent companies.
Controlling emotional behavior through mental discipline and technical analysis is crucial.
🔍 Practical Tips for Buying Gold
Buy physical melted gold from trusted sources.
For non-physical gold, carefully verify the company’s credibility and backing.
Always limit your investment risk and avoid putting all your funds into a single asset.
Carefully review contracts and purchase terms before committing.
📈 TradingView Tools and Features
Volume Profile: Identify key supply and demand zones in the gold market
Moving Average: Track long-term and short-term trends
RSI: Detect overbought or oversold conditions and market sentiment
Alerts: Set notifications for important price changes
Watchlist: Manage and monitor your assets regularly
💡Summary
Buying physical melted gold from a certified company is the best way to hedge against inflation and protect wealth. In countries with restrictions on physical gold, reputable non-physical gold can be a practical alternative. TradingView tools help make your analysis precise and actionable.
Personally, I expect the global gold ounce price to reach 5000 units by mid-2026, making now a strategic time for careful planning and smart investment.
🏆 3 Important Recommendations
Always diversify your investments across multiple assets to reduce risk.
Buy gold with knowledge and technical analysis, avoiding market-driven emotional decisions.
Thoroughly research any company offering physical or non-physical gold, checking credibility and actual gold backing to prevent scams.
✨ Need a little love!
We pour love into every post your support keeps us inspired! 💛 Don’t be shy, we’d love to hear from you on comments. Big thanks, Mad Whale 🐋
📜Please make sure to do your own research before investing, and review the disclaimer provided at the end of each post.
Wyckoff Distribution. Long term liquidity levels reached.Liquidity we have been tracking for months from orderbook instability in our lower time frame threshold tracker has just been absorbed, see horizontal boxes on screen. I believe we are happy here, waiting for fed…

Emotional Patterns: What Your Trades Reveal About YouTrading feels technical on the surface, yet the deeper layer is psychological. Charts highlight opportunities, but the way you behave inside those opportunities shapes the outcome. Each trade reflects how you respond to pressure, uncertainty, and risk. Over time, these reactions create emotional patterns that influence results more than strategy.
One early pattern appears after a loss. A losing trade often triggers frustration, and that frustration pushes traders into fast entries aimed at regaining control. The decision becomes driven by emotion rather than process, and this behaviour can quickly lead to a cycle of overtrading.
Winning streaks create a different pattern. Confidence expands, and many traders begin increasing size, loosening rules, or entering before confirmation because recent success feels reassuring. This overextension usually leads to sharp setbacks when the market shifts.
Another frequent pattern is hesitation. Traders with inconsistent execution tend to freeze at key moments. They wait for additional confirmation, delay entries, or watch clean setups move without them. The pause often comes from the memory of previous mistakes rather than a lack of technical understanding.
Entries reflect trust in the system. Exits reflect trust in personal decision-making. Closing a trade too early often shows discomfort with open profit. Holding a losing trade too long often comes from discomfort with accepting a loss. These behaviours reveal the trader’s relationship with risk far more clearly than any written reflection. The chart becomes a mirror.
Recognising emotional patterns provides clarity. When recurring behaviours appear—chasing, hesitating, forcing trades, avoiding losses—they become easier to interrupt. Once a pattern is visible, it starts losing influence.
Structure then supports the change: rules, checklists, routines, and clear confirmation criteria. These elements stabilise execution and reduce the impact of emotional impulses.
A strategy defines potential entries, but emotional patterns determine whether the trader can execute consistently enough to benefit from it. Awareness strengthens decision-making. When you understand what your trades reveal about your behaviour, you can adjust it and bring execution closer to intention.
This is where consistency begins.

$BTCUSD— $85,100–$84,100 Demand Zone Could Spark the Next Rally!BINANCE:BTCUSDT is building a solid bullish structure after a confirmed CHOCH and multiple BOS signals. Price is now approaching the $85,100–$84,100 demand zone, which is the key area to watch for a potential long entry.
If buyers step in and the zone holds, upside targets remain $88,000, $93,000, and $100,000.
A breakdown below $82,100 invalidates the setup and suggests deeper downside.
This demand zone will determine whether BTC continues its emerging bullish momentum. Stay patient and manage risk accordingly.

Bitcoin Trading range between two Points Resistance or Support Bitcoin Price is currently fluctuating within a defined range between 92k and 89K. The highlighted zone shows a period of consolidation with both bullish and bearish reactions inside the range.
Technically Bitcoin is maintaining its position inside this channel, but the overall structure is leaning bearish as price repeatedly tests the lower boundaries focus on the key levels, price may decline deeper toward the next major support areas at 87K and possibly 85K
If price holds above 90K a bullish rebound is possible, with potential upside targets at and 93K further at the upper channel level near 95k bullish scenario, where price bounces upward and breaks the upper region of the range, rising toward the marked targets.
If the price reacts to the bearish side where price fails to hold above support and follows a downward continuation downside then support level would be 87K to 85K,
You may find more details in the chart,
Trade wisely best of luck buddies.
Ps; Support with like and comments for better analysis thanks for supporting.

Bitcoin Price Prediction: Recovery To $100,000 Could Be Tainted Bitcoin’s price is at $90,399 at the time of writing, sitting just below a downtrend that has persisted for one and a half months. BTC is attempting to flip $90,400 into a support level, which would mark the first step toward reversing the trend.
If macro conditions align and rate cuts revive broader market optimism, BTC could rebound sharply. A clean bounce from $90,400 may drive a retest of $95,000, and breaking that resistance would open a clear path toward the long-anticipated $100,000 level.
However, if short-term holders sell into strength, Bitcoin may struggle to maintain upward pressure. A rejection from $95,000 or failure to break the downtrend could send BTC back toward $86,822, invalidating the bullish scenario.
