MACD: More Than Just a Crossover ToolHello, traders! 🔥
The MACD (Moving Average Convergence Divergence) indicator is one of the most trusted tools in technical analysis — but often one of the most oversimplified. While many traders focus on signal line crossovers, the real power of MACD lies in its ability to visualize market momentum, subtle shifts in trend strength, and early signs of potential reversals.
Let’s unpack how MACD behaves using the weekly BTC/USDT chart ✍🏻.
🔧 Understanding the Mechanics
At its core, MACD is the difference between two exponential moving averages — typically the 12-period EMA and the 26-period EMA. The result is the MACD line (blue). The orange line represents a 9-period Exponential Moving Average (EMA) of the MACD line, commonly referred to as the signal line. The histogram reflects the distance between them, helping to visualize when momentum is building or fading.
📊 MACD in Action — Weekly BTC Chart Breakdown
Looking at the BTC/USDT weekly chart, several notable MACD behaviors stand out:
1. The Bullish Acceleration in Early 2023
In early 2023, MACD crossed above the signal line, accompanied by a sharp rise in the histogram. This indicated strong positive momentum, as the price began recovering from the 2022 lows. The histogram’s expansion confirmed increasing divergence between the short- and long-term EMAs — a classic sign of trend acceleration.
2. Peak Momentum in Late 2023
Around late 2023, the MACD line peaked while the histogram also reached maximum height. This wasn’t just a confirmation of strength — it also hinted that momentum may have reached a climax. Despite price continuing to rise slightly, the MACD curve started to flatten — an early warning of potential exhaustion in trend strength.
3. Bearish Convergence into Q1 2025
In early 2025, the MACD line turned downward and eventually crossed below the signal line, while the histogram flipped to red. This reflected a cooldown in bullish momentum rather than an immediate reversal. What’s notable is how price didn’t collapse sharply, but moved into a pullback phase — illustrating how MACD can show momentum softening before price visibly reacts.
📌 What This Can Tells Us
The MACD indicator on this weekly BTC chart shows how momentum often shifts before the trend itself breaks. Each crossover, divergence, or histogram change is not a guarantee, but a cue to pay closer attention.
Key takeaways:
Strong Histogram Expansion = Confidence in the Current Move.
Peaks in MACD Without Price Making New Highs = Potential Divergence.
Shrinking Histogram + Converging Lines = Momentum Stalling.
🧠 Final Thought
MACD isn’t just about “buy when it crosses” or “sell on red bars.” It’s a narrative tool, showing how the story of the price develops beneath the surface. On higher timeframes, such as the weekly chart, it can potentially highlight macro momentum shifts long before they become apparent in price action alone.
BTCUST trade ideas

BTC Bullish continuation in progressThis formation is one to keep close watch on. The market has printed a well-defined Inverse Head and Shoulders (ISHS) pattern with a clean breakout above the neckline. The breakout was followed by a classic bullish pennant, which perfectly retested the neckline zone—now acting as a strong support base.
The resulting bounce has been impressive, driving price toward the previous All-Time High (ATH). A confirmed breakout above that ATH will likely validate a powerful continuation phase, with the next key target projected around $138,000 and beyond as outlined on the chart.
The structure remains technically sound, and price action continues to favor bulls as long as the neckline holds.

Bitcoin Hits PRZ — Reversal or Breakout?As I expected in my previous idea , Bitcoin ( BINANCE:BTCUSDT ) started to rise from the Support zone($95,760-$95,200) . One of the news that pumped Bitcoin was " Arizona Becomes Second U.S. State to Adopt Bitcoin for State Treasury "
Bitcoin is trading in the Resistance zone($100,200-$97,700) and near the upper lines of the Ascending Broadening Wedge Pattern , Time Reversal Zone(TRZ) and Potential Reversal Zone(PRZ) .
Also, we can see a Regular Divergence(RD-) between Consecutive Peaks.
From an Elliott wave theory , it seems we should wait for corrective waves because the Cumulative Short Liquidation Leverage($100,888-$99,826) is very important and I DO NOT expect it to be broken by a single attack .
Another point we can pay attention to is the existence of two small CME Gaps , the first CME Gap($98,430-$98,380) is likely to be filled.
I expect Bitcoin to drop to at least $98,100 in the coming hours, and if the Support zone($97,900-$97,240 ) is broken, we should expect further declines, so I will label this idea as ''Short' '.
Cumulative Long Liquidation Leverage: $98,500-$97,514
Note: If Bitcoin can break the Potential Reversal Zone(PRZ) with the good volume, we can expect a new All-Time High(ATH).
Do you think Bitcoin is on track for a new All-Time High(ATH)?
Please respect each other's ideas and express them politely if you agree or disagree.
Bitcoin Analyze (BTCUSDT), 2-hour time frame.
Be sure to follow the updated ideas.
Do not forget to put a Stop loss for your positions (For every position you want to open).
Please follow your strategy and updates; this is just my Idea, and I will gladly see your ideas in this post.
Please do not forget the ✅' like '✅ button 🙏😊 & Share it with your friends; thanks, and Trade safe.

Bitcoin is consolidating and may continue to riseBitcoin is in consolidation and feels good. We have a bullish trend sitting, strong support, zone of interest and liquidity and strong resistance. Most importantly, we have consolidation
Price may test 103000 before continuing upwards
There may be a small correction to 103K before breaking 104200, but if the price does not continue to fall, but returns to 104.2, we can expect a break of resistance and continued growth.
Scenario: consolidation between 104200 and 103000 will increase the chances of resistance breakout and growth.
If bitcoin continues the correction, then we can consider a retest of 102300, 101800 before continuing growth.
Targets: 106500, 108400

BTC/USD) bullish trend analysis Read The ChaptianSMC Trading point update
Technical(BTC/USDT) analysis outlines a bullish outlook with key technical levels and scenarios. Here's a breakdown of the idea:
Key Observations:
1. Trend Break and CHoCH (Change of Character):
The chart shows a clear break of the downtrend, confirmed by the CHoCH label — a common Smart Money Concept (SMC) signal indicating a potential trend reversal from bearish to bullish.
2. Key Zones Highlighted:
EVC-Buying Zone: Around 86,000 – 88,000 (aligned with EMA 200), marked as a strong accumulation area.
New Support Level: Around 92,000 – 93,000, potentially forming a bullish support after the recent rally.
Resistance Levels: Two major resistance zones near:
99,600 (intermediate resistance and target)
106,400 (final target)
3. RSI Indicator:
RSI is near 64, indicating strong momentum but not yet overbought — a potential sign of further upside.
4. Two Bullish Scenarios:
Scenario 1 (Aggressive Bullish): BTC continues upward from the current level and breaks above resistance toward the 106,447 target.
Scenario 2 (Retracement Bullish): BTC dips to the new support or even into the buying zone (86–88k), then rebounds to reach the same targets.
Mr SMC Trading point
---
Idea Summary:
The chart suggests bullish continuation, with potential pullbacks into strong demand zones. It supports both breakout and retracement entries, with targets at 99,632 and 106,447. If price holds above EMA 200 and RSI remains supportive, the upside thesis remains valid.
Pales support boost 🚀 analysis follow)

BTC at Critical DP: Rising Wedge Breakdown or Bounce?!Hello guys!
1. Bearish Breakdown (Primary Setup):
If price breaks below the rising wedge support and sweeps the recent low, it confirms the breakdown.
This would be a strong signal to enter short positions, with a downside target around the 99,000–98,500 zone.
Breakdown confirmation: Close below both wedge support and the horizontal support from the previous swing low.
2. Bullish Bounce (Alternative Setup):
If price respects the wedge support and shows bullish momentum (e.g., strong wick rejections or bullish engulfing candle), the wedge may invalidate.
In this case, look for long opportunities targeting the upper wedge boundary and possibly higher resistance zones beyond 104,000.
📌 Strategy Summary:
🔻 Breakdown = SHORT to target area (below 100K)
🔺 Support holds = LONG toward 104K+
Risk management is crucial here, as the pattern is at a tipping point. Wait for a clear breakout or bounce before entering a position.

TradeCityPro | Bitcoin Daily Analysis #87👋 Welcome to TradeCity Pro!
Let’s get into the analysis of Bitcoin and major crypto indices. As usual, I’ll review the triggers for the New York Futures session.
⏳ 1-Hour Timeframe
On the 1-hour timeframe, Bitcoin moved sideways yesterday as I mentioned, and after the RSI exited the Overbuy zone, it corrected down to the 102391 area.
🔍 This was a very minor correction, mainly due to the RSI leaving the Overbuy zone. Currently, the oscillator has reset, and if it re-enters Overbuy, we can confirm the start of bullish momentum.
✨ Now the candle has closed above the 103642 area, and if the price stabilizes above this level, it could move toward the main resistance at 106247.
📊 In my opinion, the price will move toward 106247 and then enter a correction because the breakout of 103642 was accompanied by increased volume, and if this volume continues, the probability of this move increases.
📉 If the correction starts from the current level, the first support we have is 102391, and after that, there is no solid support until 99337.
🧩 The reason I’m not using Fibonacci to find support zones is that the price hasn’t confirmed the start of a correction yet, and a proper top hasn’t been formed. I’m waiting for that top and confirmation of the correction before identifying key correction levels.
✔️ For now, only these two support levels are important, and as long as the price is above 99337, the trend remains bullish.
📈 For opening a position today, the Bitcoin trigger at 103642 has been activated and is currently getting a pullback. If you get confirmation from this pullback, you can enter a position — but be careful, there's a very important resistance at 106247 and that zone is highly significant.
👑 BTC.D Analysis
Let’s move to Bitcoin dominance. Yesterday, dominance had a slight correction and pause, and today it broke the 63.61 area and is moving toward the 63.23 support.
⚡️ It seems there’s strong bearish momentum in dominance, and if it continues to drop, I believe it could easily break 63.23 and move further down.
📅 Total2 Analysis
Let’s check out Total2. Yesterday, the 1.17 trigger for this index also activated, and you could open positions on altcoins.
💥 The next resistance we currently have is the 1.22 area, and considering the drop in Bitcoin dominance, this index can easily move toward that resistance.
🔔 At the moment, I can’t give you any trigger on this index — you can only enter based on confirmation from individual coins.
📅 USDT.D Analysis
Now let’s look at Tether dominance. This index has also continued its move and after a short pause, broke below 4.65 and is moving downward.
🎲 For now, the trend in dominance is bearish, which pushes the market upward.
❌ Disclaimer ❌
Trading futures is highly risky and dangerous. If you're not an expert, these triggers may not be suitable for you. You should first learn risk and capital management. You can also use the educational content from this channel.
Finally, these triggers reflect my personal opinions on price action, and the market may move completely against this analysis. So, do your own research before opening any position.

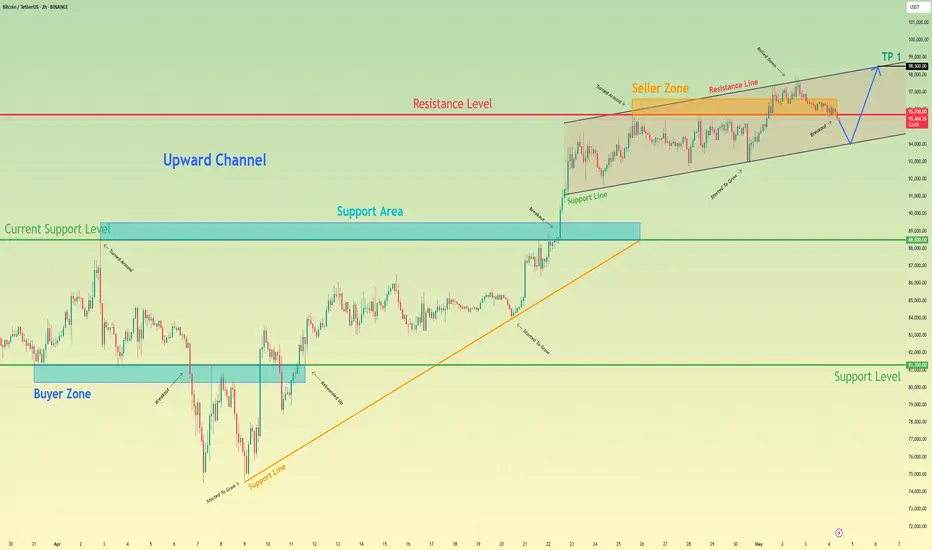
Bitcoin can bounce from support line of channel to 98500 pointsHello traders, I want share with you my opinion about Bitcoin. Looking at this chart, we can observe how the price of Bitcoin has been in recent price action. The asset had been confidently moving inside an upward channel, building structure through higher highs and higher lows. Each upward impulse was supported by pullbacks to the support line, showing continued buyer pressure. The latest breakout above the support area confirmed a bullish continuation, and the price entered the seller zone, where it faced resistance. Despite multiple attempts to break through, the price repeatedly turned around, forming a tight triangle pattern within the upper boundary of the channel. Currently, the price has broken down from the triangle, but it still holds above the channel's lower line. Given that the channel remains intact and there's no strong breakdown of the structure, I expect the price to rebound from the lower boundary and continue climbing toward my TP 1 at 98500, which aligns with the resistance line of the channel. Please share this idea with your friends and click Boost 🚀
BTCUSDT Non stop pumping (Soon or late another ATH cooking)As we can see price is near ATH resistance zone and we are looking for maybe a short-term correction and rest and soon after that more pump here is expected like green arrows and even breakout of ATH and new ATH like 113K$ or 120K$ is cooking for next two months.
DISCLAIMER: ((trade based on your own decision))
<<press like👍 if you enjoy💚

Bitcoin Potential Continuation To The UpsidesHey Traders, in today's trading session we are monitoring BTCUSDT for a buying opportunity around 100,000 zone, Bitcoin is trading in an uptrend and currently is in a correction phase in which it is approaching the trend at 100,000 support and resistance area.
Trade safe, Joe.

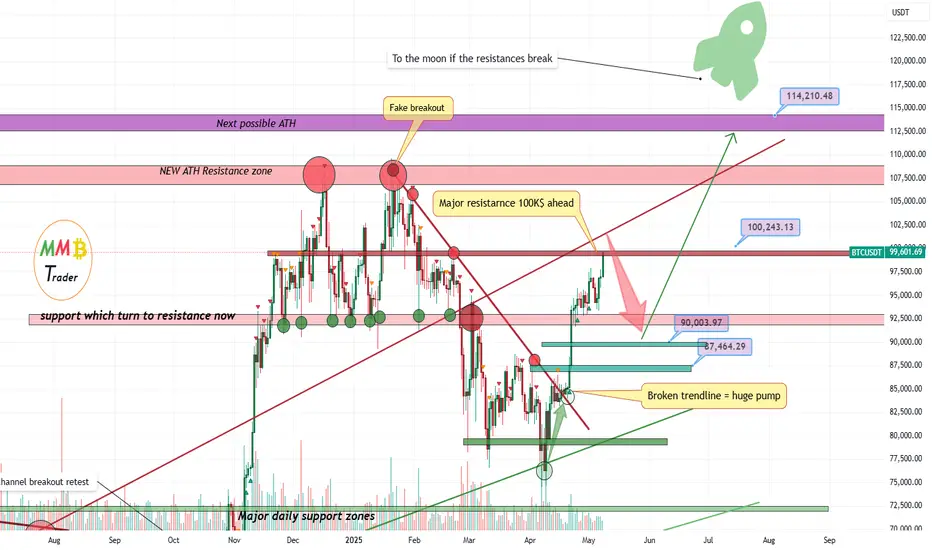
Bitcoin near 100K$ resistance zone(breakout and 114K$ or ...)As we can see two major resistance which are red trendline and 100K$ resistance zone are ahead so major Sell zone and resistance zone now is 100K$ to 102K$ so we can expect fall or short-term correction now here near this major resistance zone like red arrow But we should consider this that soon or late after maybe more range price will also break this resistance zone and heavy pump is ahead to the targets like 114$ at least in our long-term plan or even more.
DISCLAIMER: ((trade based on your own decision))
<<press like👍 if you enjoy💚
Bitcoin may correct a little and then continue to grow in wedgeHello traders, I want share with you my opinion about Bitcoin. The price has been moving confidently inside an upward wedge structure, which often signals a continuation in strong bullish trends but also warns of potential exhaustion if momentum fades. In this case, the wedge is forming after a clear impulse move and is supported by a solid base at the buyer zone. Multiple impulses from this level and consistent support at the current support zone have pushed the price higher, with bullish momentum now clearly in control. After a breakout from the previous resistance zone and a clean retest of the support area, the price started a strong rally. This move aligns well with the wedge formation, where both trend lines are narrowing upward, indicating that buyers are pushing steadily higher while sellers are becoming more aggressive, a setup that often leads to an explosive breakout if the resistance is breached. Now BTC trades above 93700, consolidating slightly below the wedge resistance line. Based on the wedge geometry and the strong impulse structure that preceded it, I expect the price to continue growing and test the 100000 level, which aligns perfectly with the upper wedge boundary and serves as my TP 1. Please share this idea with your friends and click Boost 🚀

TradeCityPro | Bitcoin Daily Analysis #84👋 Welcome to TradeCity Pro!
Let’s dive into the analysis of Bitcoin and major crypto indices. As usual, I’m going to review the New York futures session triggers for you.
⏳ 1-Hour Timeframe
As you can see in the 1-hour timeframe, yesterday after news of tensions between India and Pakistan, Bitcoin moved upward and made a sharp rally to the 97409 zone, returning once again to this high.
📰 This news created fear in the market, and the buying that occurred was driven by fear and news impact. In my opinion, this bullish leg won’t be sustainable in the long term unless the price stabilizes above the 97409 level and starts a new upward leg.
✨ If the 97409 level is broken, we can enter a long position since it aligns with the current bullish trend, and we can position ourselves for the breakout with a wide stop-loss.
✔️ But make sure your stop-loss is wide and placed below the market’s main support because a significant resistance is being broken, and there's a high chance of volatility before the market actually moves upward. A tight stop-loss may get triggered before the actual rally begins.
💥 A momentum confirmation for today’s long position could be RSI entering the Overbuy zone, and if that happens, the chances of breaking 97409 increase significantly.
📉 For a short position, we should wait and see how the news impact plays out in the market. If it turns out to be driven by FOMO, naturally in the next few days, the price may move back down, and we could enter short positions on breaks of levels like 95370 or 93626.
👑 BTC.D Analysis
Let’s move to Bitcoin Dominance. Yesterday, dominance stabilized above the 64.91 level and managed to move up to 65.25.
🎲 Currently, Bitcoin is a much better option for long positions since dominance is rising, and even breaking 65.28 would confirm another bullish leg in dominance, potentially pushing it toward the top of the channel.
📅 Total2 Analysis
Let’s analyze Total2. Yesterday, this index faked a breakdown below 1.01 and simultaneously moved upward with the news, now reaching the 1.03 zone. A break of this zone could confirm a bullish move toward 1.05.
⭐ The main trigger for a long position remains the break of 1.05, and I strongly recommend being positioned if that level is broken.
🔽 For a short position, you can still enter on a break of 1.01 — I still think it’s a valid trigger.
📅 USDT.D Analysis
Now for USDT Dominance: yesterday, this index also faked a move above the 5.20 level and has since dropped to 5.04.
💫 Activation of the 5.04 trigger could be confirmation for a long position and a sign of USDT dominance starting to decline. The main trigger remains the break of the 4.99 bottom.
❌ Disclaimer ❌
Trading futures is highly risky and dangerous. If you're not an expert, these triggers may not be suitable for you. You should first learn risk and capital management. You can also use the educational content from this channel.
Finally, these triggers reflect my personal opinions on price action, and the market may move completely against this analysis. So, do your own research before opening any position.

BTC - From Bullish to Extreme Bullish...Hello TradingView Family / Fellow Traders. This is Richard, also known as theSignalyst.
🏢 BTC Building Blocks:
📈 Bullish:
BTC is currently trading within the second floor, between $92,000 and the previous all-time high (ATH) at $109,000.
As BTC retests the $96,000 demand zone, we’ll be looking for trend-following long setups!
📈 Extreme Bullish:
For the momentum to shift from Bullish to Extreme Bullish and enter the price discovery phase, a break above the previous ATH around $109,000 is needed.
📚 Always follow your trading plan regarding entry, risk management, and trade management.
Good luck!
All Strategies Are Good; If Managed Properly!
~Rich

TRADINGVIEW IS LOOKING FOR A NEW ENGLISH MODERATOR - IS IT YOU ?Join Our Team: Exciting Opportunity to Become a Moderator for the ENGLISH Language Community at TradingView!
Hello TradingView Enthusiasts,
Are you passionate about trading and the TradingView platform? We are on the lookout for a new moderator to join our ENGLISH Language Community and help elevate the experience for users like you.
As a moderator, your role is pivotal. You'll guide members, ensure adherence to our community standards, and help users maximize their TradingView experience. This is your chance to shine and directly influence the community dynamics while ensuring a friendly and respectful environment.
The General Tasks are:
✅ Replying to user inquiries that might get sent to you.
✅ Welcoming and encouraging new users
✅ Help reward and recognize users through TradingView Coins and Editors Picks.
✅ Keeping the peace in our chat rooms
✅ Helping ensure that the site rules are followed
✅ Help maintain the quality of the site - eg unsuggesting poor ideas and untagging non-educational posts.
✅ Being visible - keep posting your ideas, chat with users, post comments on users' ideas etc
While this is an unpaid volunteer position, the benefits are substantial:
✅ Exclusive Access : Engage directly with our internal team, including the founders.
✅ Influence Development : Provide input on platform enhancements and new functionalities.
✅ Free Plan : Enjoy a free EXPERT ($1,200 USD plan) account along with free data packs and exclusive merchandise.
✅ Boost Your Profile : Gain significant exposure, increase your follower count, and enhance your presence across the site.
✅ Career Opportunities : Many of our moderators have transitioned into full-time roles, using this position as a stepping stone to further their careers within TradingView.
We are looking for a Community Leader. We're looking for someone who:
✅ Has in-depth knowledge of the TradingView platform.
✅ Maintains a strong reputation within the community through high-quality content and helpful interactions.
✅ Engages positively with community members, respects diverse opinions, and upholds our community standards.
✅ Dedicates at least one hour daily to moderating and supporting the community.
✅ Has been an active, respected TradingView member for over six months with minimal rule violations.
✅ Possesses solid general trading knowledge and can communicate effectively in both spoken and written English and of course ENGLISH.
A good indication of this is:
✅ 100 or more posted trade ideas especially including educational ideas
✅ Consistently get likes for your posted ideas (quality over quantity)
✅ 100 or more genuine followers
✅ Interacts in Minds
✅ Interacts in Chatrooms
✅ Regularly responds to comments on their own and others posts
✅ Has created and posted a Script
You don't need to have done all of these things, but it does help you stand out in the crowd and demonstrate you are familiar with multiple areas of our site.
Think this could be you? Learn more about what it means to be a moderator here:
www.tradingview.com
Ready to apply? Please fill out this form in English:
forms.gle/bsdGF1hw64wc3Epq6
🤔 If you have any questions or need further information, feel free to reach out to @zAngus .
We're excited to see who will join our team next and help us continue to provide a world-class trading community experience.
Warm regards,
💖 TradingView Team

TradeCityPro | Bitcoin Daily Analysis #85👋 Welcome to TradeCity Pro!
Let’s move on to the analysis of Bitcoin and key crypto indices. As usual in this analysis, I’ll review the futures triggers for the New York session.
📰 Yesterday, the U.S. interest rate decision came out, which remained unchanged and didn’t have much impact on the market—this was expected for some time. Now that the news had no real effect, the market can continue its previous trend.
⏳ 1-Hour Timeframe
As you can see in the 1-hour timeframe, after the news came out yesterday, the price ranged a bit and then moved upward, triggering the 97409 level. I hope you entered a position with that trigger because I had emphasized it strongly.
✔️ Currently, the price has reached the 99337 zone and is stabilizing above it. If this holds, the next resistance level is 101965.
💥 The RSI oscillator is also in the Overbuy zone, which is helping the price maintain its bullish momentum. There’s a resistance at 75.77 on the RSI, and if that breaks as well, we could see a very sharp move in the chart.
📊 Buy volume has been strong in this leg and aligns with the trend. If volume starts decreasing, divergence will appear, and we’ll get the first sign of trend weakness. Just remember—weakness doesn’t mean trend reversal.
📉 As for short positions, I think by now you know my trading style. In a market like this, where momentum is strongly bullish and price is breaking resistance one after another, I don’t think opening a short position makes sense. We should wait for proper structure to form before considering a short.
👑 BTC.D Analysis
Moving on to Bitcoin dominance—yesterday the 65.28 zone was broken and price moved up near the top of the channel, but then reversed and has now dropped to the midline of the channel.
🔑 Currently, the dominant trend is still bullish, but short-term momentum is bearish, and there’s a good chance it drops further to 64.91.
⚡️ Since the higher timeframes are still bullish, we could see bullish momentum return at any time. Technically, the 64.91 zone is the next major support.
📅 Total2 Analysis
Let’s look at Total2—finally, the 1.05 trigger was activated, and Total2 started moving upward. I had strongly emphasized this trigger as well, and I hope you took advantage of it.
🧩 Price has now reached the 1.07 level, and if that breaks, it could move up to 1.1.
🔼 If this bullish move turns out to be a fakeout, the next valid triggers for short positions are a break of 1.03 and then 1.01.
📅 USDT.D Analysis
Now to Tether dominance—this index also broke the 4.99 level and is now trending downward.
🔍 If this move continues, we could see a drop to around 4.82. That would allow the market to continue its upward movement even further.
❌ Disclaimer ❌
Trading futures is highly risky and dangerous. If you're not an expert, these triggers may not be suitable for you. You should first learn risk and capital management. You can also use the educational content from this channel.
Finally, these triggers reflect my personal opinions on price action, and the market may move completely against this analysis. So, do your own research before opening any position.

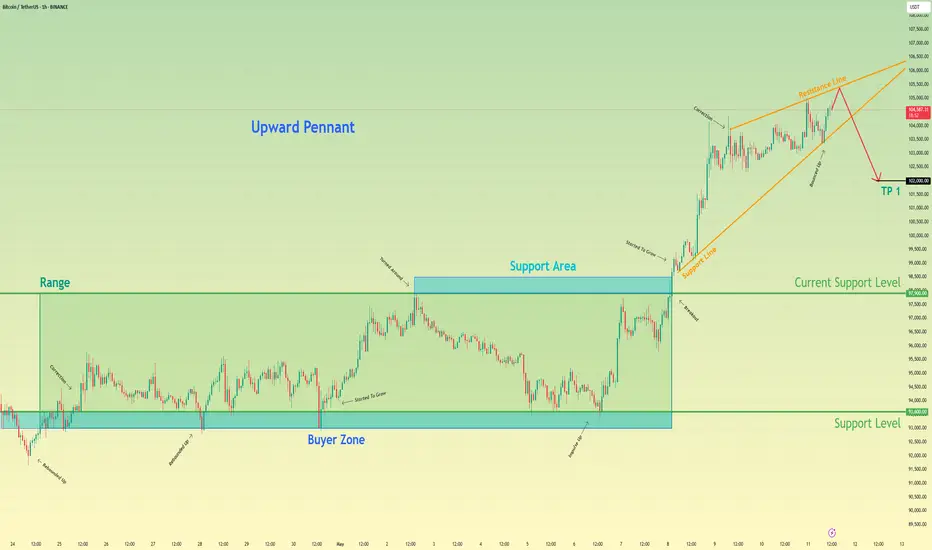
Bitcoin may drop to 102K points, exiting from pennantHello traders, I want share with you my opinion about Bitcoin. After breaking out of a multi-day range and launching a strong impulse from the buyer zone, the price has formed a clear upward pennant pattern. This technical formation often signals a potential slowdown in the bullish momentum, especially when it follows an aggressive move to the upside. The current price action shows that BTC has approached the resistance line of the pennant, but failed to generate further breakout strength. Each new impulse within the structure has weakened, and the market is starting to compress inside narrowing boundaries. The support area has been holding the structure temporarily, but the inability to push through the top of the pennant suggests growing exhaustion among buyers. This setup indicates that BTC may soon break downward from the pennant. So, I expect that it will make a correction that could drive the price down to the 102000 points, thereby exiting from pennant pattern. Please share this idea with your friends and click Boost 🚀
BTCUSDTHello Traders! 👋
What are your thoughts on Bitcoin?
Bitcoin has successfully broken above the $100,000 resistance zone and is now holding above this key level.
The price is expected to challenge the previous high, which represents a major resistance area.
A short-term pullback may occur after testing this heavy resistance.
Once the correction is complete, Bitcoin could resume its upward move toward higher targets.
Will Bitcoin continue its rally after a healthy pullback? Share your thoughts below!
Don’t forget to like and share your thoughts in the comments! ❤️

BTC - Golden Pocket & Strong FVG Resistance for a Short SetupThe current 15-minute chart of BTCUSDT reveals a textbook bearish setup forming as price retraces into a well-defined supply zone. This analysis focuses on structural breakdowns, liquidity engineering, and key Fibonacci confluences that may lead to a short-term reversal within intraday price action.
Overview of Market Structure:
BTCUSDT has been in a clear intraday downtrend with consistent lower highs and lower lows being formed. The recent price action reflects a temporary consolidation phase following the creation of a new swing low. This minor pullback appears to be corrective in nature, moving upward toward a previously established zone of inefficiency.
At the center of this setup is a well-marked bearish fair value gap (FVG), highlighted with a blue shaded rectangle, where institutional selling is expected to have previously occurred. This FVG formed after a strong displacement candle, suggesting unmitigated sell-side imbalance left in the market.
Retracement Zone and Fibonacci Confluence:
As price retraces upward, it enters the equilibrium region of the recent bearish impulse, with notable confluences around the 0.618 and 0.65 Fibonacci retracement levels. These retracement levels are critical markers where smart money algorithms often execute continuation plays during trending phases.
Both the 0.618 and 0.65 levels fall within the center of the FVG zone, further strengthening the case for this being a valid supply area. These levels are plotted with horizontal lines on the chart and serve as ideal zones to monitor for signs of rejection or bearish order flow resumption.
The 0.786 retracement, marked just above the upper boundary of the FVG, acts as a final extremity level. This level often coincides with liquidity pools where stop hunts are engineered before the actual move begins. Its proximity to a recent swing high makes it an area of interest for potential liquidity grabs prior to a deeper move down.
Projected Price Path and Liquidity Targets:
The projected blue path illustrates an expected liquidity sweep into the FVG zone, followed by a sharp rejection. This aligns with the idea of engineered liquidity collection before continuation in the original trend direction. The move anticipates price reaching back into the area of prior support, targeting unmitigated demand near recent lows.
Of particular interest is the area around the 0.28 Fibonacci extension level, which acts as a probable magnet for price in the event of a successful rejection. The chart structure suggests that once the short-term retracement completes, there is room for a new impulse leg lower.
Internal Structure Observation:
The current lower timeframe structure shows rising momentum toward the FVG. However, this upward push lacks aggressive bullish volume and appears corrective rather than impulsive. This suggests that buyers are likely exhausting themselves as price nears the supply zone.
Additionally, the structure within this move is developing lower-timeframe liquidity pools (equal highs and tight consolidation), which could act as inducement for a sweep before the potential reversal occurs.
Conclusion:
This chart offers a well-structured short setup based on supply zone rejection, Fibonacci confluence, and a bearish market structure. The fair value gap zone between the 0.618 and 0.65 retracement levels is key, and price action within this area will be crucial in determining the next directional leg. If bearish confirmation such as an engulfing pattern or break of market structure occurs within or after tapping this zone, it would validate the bearish outlook for a short-term continuation to the downside.
This setup is ideal for intraday traders focused on precision-based entries rooted in institutional order flow principles.

BITCOIN → Correction to the risk zone. Rise or fall?BINANCE:BTCUSDT has updated its local maximum to 97,900, the market structure is quite positive, but still depends on the fundamental background and the behavior of the S&P 500.
The fundamental reasons that influenced the growth are the improvement in the tariff situation in the US and relations with China. Bitcoin's growth strengthened as the SP500 index rose, with which it has a fairly high correlation. In the second half of this week, the price broke out of the two-week consolidation, breaking through the resistance level of 95,500 and updating the local maximum. A correction is forming within the local upward channel.
95,000 is the liquidity and risk zone. That is, if the bulls hold their defense above 95K during the retest, Bitcoin will continue to grow in the short and medium term. Otherwise, a break of 95K could trigger a drop to 92K-88K.
Resistance levels: 97,425, 99,475
Support levels: 95,500, 92,000
All eyes are on the 95.5K support level, below which a huge liquidity pool has formed. Growth may be influenced by a retest (false breakout of support) and an imbalance of forces in the market. But we need to be careful, as the market will react to economic data. BUT! A return of prices to the selling zone (below 95000 - 95500) and the inability to continue growth could trigger a correction and liquidation.
Best regards, R. Linda!

TradeCityPro | Bitcoin Daily Analysis #83👋 Welcome to TradeCity Pro!
Let’s dive into the Bitcoin analysis and key crypto indices. As usual, I want to review the triggers for the New York futures session.
🔍 Today, I’ll provide the analysis in the 4-hour timeframe, since not much has changed on the 1-hour chart compared to yesterday, and it's better to take a slightly longer-term look at the chart.
⏳ 4-Hour Timeframe
As you can see in the 4-hour chart, we have an upward leg that started from the 84,000 zone and extended to 97,108. Currently, it's ranging between 93,626 and 95,370.
✔️ The main market top lies at 97,108, but the price has formed a range slightly lower, with 93,626 acting as support.
⚡️ There's a strong divergence visible in the RSI — while Bitcoin has formed three consecutive higher highs, RSI has printed lower highs. This divergence was activated when RSI broke below 50, and the price corrected to 93,626.
📊 In my opinion, the market has now digested the divergence, but the impact it had was a correction down to this level. If 93,626 breaks, deeper corrections could follow.
✨ The 93,626 zone overlaps with the 0.236 Fibonacci retracement and forms a PRZ. If this level breaks, we can open a short position. I open this kind of trade in lower timeframes as a scalp and take quick profits, since it’s counter-trend.
🔽 The maximum short-term target I expect for this trade is the 91,945 area. It's possible that the price corrects further or even reverses trend, but it's not logical in my strategy to hold these kinds of trades longer.
🔑 The key supports ahead are 91,945 (which overlaps with 0.382 Fibonacci), and further down are the 0.5 and 0.618 Fibonacci levels.
📈 For a long position, breaking 95,370 is currently the best trigger. You can also enter on a break of 97,139, but there's strong resistance at 98,828 that could halt the upward move.
🔼 If the price corrects and reaches 91,945, you can consider a long entry based on the price’s reaction to the supports I mentioned.
👑 BTC.D Analysis
Let’s move on to Bitcoin dominance. On the 4-hour chart, there’s an ascending channel where price is moving, with multiple touches. Right now, it’s testing resistance at 64.91.
☘️ If this level breaks, dominance could move up to the top of the channel. There’s also a very important static resistance at 65.59. If price reaches this area, we need to watch its reaction.
📅 Total2 Analysis
Now onto Total2. Similar to Bitcoin, it had a bullish leg, but corrected more deeply — down to the 0.382 Fibonacci retracement, and now it’s at the 1.01T support.
⭐ If this zone breaks, the next supports are at the 0.5 and 0.618 Fibonacci levels. There’s also a strong support at 980B, and the major bottom is at 932B.
📉 For a short position, breaking 1.01T is suitable. For a long position, a bullish reaction from this same area is a good trigger. The main long trigger is the break of 1.05T.
📅 USDT.D Analysis
Let’s move to Tether dominance. This indicator has reached a major top at 5.19. If this level breaks, it can move upward.
👀 If it breaks, the next resistance is 5.37. This move would coincide with a market correction or drop.
📊 To confirm a bearish Tether dominance (bullish market), rejection from 5.19 is a good trigger. The main trigger is still the break of 4.99.
❌ Disclaimer ❌
Trading futures is highly risky and dangerous. If you're not an expert, these triggers may not be suitable for you. You should first learn risk and capital management. You can also use the educational content from this channel.
Finally, these triggers reflect my personal opinions on price action, and the market may move completely against this analysis. So, do your own research before opening any position.

TradeCityPro | Bitcoin Daily Analysis #88👋 Welcome to TradeCity Pro!
Let’s dive into the analysis of Bitcoin and key crypto indexes. As usual, in this analysis I want to review the futures triggers for the New York session.
⏳ 1-Hour Timeframe
In the 1-hour timeframe, as you can see, Bitcoin has formed a slightly better structure and it seems to be undergoing a trend-aligned correction.
✔️ A trend-aligned correction happens when the market enters a corrective phase, but the sellers are so weak that they can’t even stop the price from rising during the correction, and the price gradually moves upward.
🔑 In this case, since the market is in a corrective phase, if we enter with a tight stop loss, we are likely to get stopped out due to the nature of corrections. So it's better to open positions with a wider stop loss so it doesn't get triggered easily.
📊 One thing to note on the current Bitcoin chart is that we are very close to its most important resistance at 106247. This zone is a very strong supply area, and I think breaking through it won’t be easy.
⚡️ So for now, I suggest not opening any new positions on Bitcoin and instead using dominance charts to open positions on altcoins.
📈 If you already have an open position, I recommend keeping your Bitcoin position open, because if 106247 breaks, your position could become highly profitable.
👑 BTC.D Analysis
Let’s move on to Bitcoin dominance. Yesterday, after breaking the 63.61 level, there was another downward leg down to the 62.65 area, and altcoins made another upward move.
⭐ Currently, the dominance is correcting and has risen to the 63.29 area. I think it’s going through a slight correction since its drop was sharp and needs a bit of a breather.
💥 However, if the 62.65 low gets broken, we can take it as confirmation of the next bearish leg, and if that happens, we can again open positions on altcoins.
📅 Total2 Analysis
Now to the Total2 analysis. Yesterday, this index got rejected from the 1.24 top and slightly corrected, but it hasn’t reached the 1.17 area which overlaps with the 0.236 Fibonacci level, so we still haven’t confirmed the start of a correction.
✨ In my opinion, as long as we stay above the 0.382 level, the uptrend remains strong. Only after breaking below this area will we confirm the start of a deeper correction.
🔼 For continuation of the trend, breaking above 1.24 would allow us to open positions on altcoins.
📅 USDT.D Analysis
Now to Tether dominance. This index also broke below 4.63 yesterday and dropped to 4.51, and is currently correcting.
🧩 To get confirmation from Tether dominance, a break below 4.51 would signal that we can open long positions on altcoins.
🎲 The simultaneous break of 4.51 and 1.24 could be a strong confirmation if dominance continues to decline.
❌ Disclaimer ❌
Trading futures is highly risky and dangerous. If you're not an expert, these triggers may not be suitable for you. You should first learn risk and capital management. You can also use the educational content from this channel.
Finally, these triggers reflect my personal opinions on price action, and the market may move completely against this analysis. So, do your own research before opening any position.

BTCUSDT - Potential Long Setup Developing from FVG and Fib levelOverview:
Bitcoin (BTCUSDT) on the 1H timeframe is currently exhibiting a controlled retracement following a local top. This structure presents a potential opportunity for a long setup based on confluence between an FVG (Fair Value Gap) and key Fibonacci retracement levels. The chart highlights a likely scenario where price may continue to correct lower into a defined area of interest before resuming bullish momentum.
Market Context:
After a strong impulsive move upward, BTC appears to be in a corrective phase. The recent price action has formed a series of lower highs and lower lows, which is characteristic of a short-term downtrend within a broader uptrend context. This kind of pullback behavior is often necessary for healthy continuation to the upside and can offer high-probability entries for trend continuation traders.
Fair Value Gap (FVG):
A notable fair value gap has been identified in the 94,250–94,700 zone. This zone represents an inefficiency in the market where price rapidly moved without significant opposition, leaving behind a gap between wicks of adjacent candles. Price often returns to such areas to rebalance order flow before making its next decisive move.
Fibonacci Confluence:
The chart includes key Fibonacci retracement levels drawn from the recent swing low to swing high.
* The 0.618 Fibonacci retracement level lies just above the FVG, providing strong technical confluence.
* The 0.65 level is marked as the ideal entry zone and sits within the FVG, further validating it as a high-probability support region.
* The 0.786 level is also marked, and although deeper, it represents the final line of defense for this bullish scenario.
Anticipated Price Action:
A bullish projection is illustrated on the chart where price is expected to:
1. Continue declining toward the 0.65–0.618 Fibonacci confluence zone.
2. Wick into the FVG and reject from that level.
3. Form a short-term higher low structure and push back to reclaim prior structure highs.
4. Confirm bullish structure continuation with an impulsive breakout from the descending channel.
Market Structure and Liquidity Outlook:
The broader structure remains bullish on higher timeframes. The retracement into the FVG would serve the dual purpose of:
* Grabbing liquidity below recent lows.
* Mitigating unfilled buy-side inefficiency.
Such a development would suggest that institutional participants are filling long orders in the discounted price region, setting the stage for a potential continuation of the broader bullish trend.
Key Technical Zones:
* FVG Zone: 94,250 – 94,700
* Fibonacci Confluence: 0.618–0.65 retracement levels
* Liquidity Pool: Below current swing lows leading into the FVG
Conclusion:
BTCUSDT is approaching a critical decision zone. A move into the FVG combined with Fibonacci retracement confluence presents an attractive area for potential long entries. Confirmation of bullish reversal structure within this zone could offer a strong trade opportunity in alignment with the broader trend. Patience and precision will be key in waiting for the price to tap into this area and show intent to reverse.
