EYES ON THESE TWO HYSTORICAL TRENDLINESWe are at a crucial point, the price is touching a cross between two trend lines that have lasted for YEARS.
Decisive moment for BTC.
If it breaks to the upside we will fly.
For the moment I value a short position with SL just above the trend lines.
Good Luck
BTCUST trade ideas

BTC IT'S TIME TO ...Hello friends
Due to the entry of buyers and the breakdown of the trading range, we can open a buy position in the direction of the trend and with capital and risk management.
*Trade safely with us*

Bitcoin Repeating 2022 Structure? Same Setup, Same Outcome?Bitcoin’s current market structure is starting to mirror its 2022 setup—right before the big drop.
This chart shows a familiar pattern: a rally, a peak, first drop from the ATH, a bull trap… then the major second leg down.
If history repeats, CRYPTOCAP:BTC could be on the verge of another significant move.
Will it break the cycle this time—or follow the same path again?
📉 What do you think?
Share your take in the comments below.
Please support this idea with a LIKE👍 if you find it useful🥳
Happy Trading💰🥳🤗

BTC - “Bull Market” OR Bearish Retest on HTF? Bitcoins excessive rise for the previous two years brings concern for the mechanics of this market. Moving only up for so long leaves much liquidity in the form of long position stop losses below the current price.
These stop loss orders, or leveraged sell orders, are an explosive chain reaction ready to set off.
Observe these two trendlines and copy them to your charts. These two bearish trendlines (in my view) are why bitcoin has truly been rising so freely.
Moves up in the form of bearish retests are fast and fluid, only after the rejection does price fall aggressively.
I anticipate two scenarios here in the realm of bearish ideas:
Possibility 1 - 30% Probability
96,700 to 34,500
34,500 retrace to 68,500
68,500 to 7,000
Possibility 2 - 70% Probability
96,700 to 43,000
43,000 retrace to 60,000
60,000 to 7,000
Note that both of these possibilities end with 7,000. I’m mapping out two routes that take us there, using confluences with trendlines, volume profiles, liquidity mapping, and common sense.
Be mindful of this possibility. And protect yourself accordingly.

btc. SHORT to LONGwe saw a nice price rotation downwards, following the idea of NY giving up the SFP on tuesday and started looking for lower prices themselves.
SHORT entry running ASIA high at 2pm
entry . 95146
tp1 . 93453 . +1.78%
the 1h SUPPORT LEVEL of ASIA . 92902
held SUPPORT during that down price rotation.
LONG IDEA
see a rotation to dOpen / cw0.5 / value area Low / micro SFP / 2pm
entry . 94000
tp1 . 96.972
at 1 step extension of cw


BTC Shortwe in 4h sibi + week -breaker
we are have 4h - braker
Price need rebalance zone its
-week bisi
-day bisi
-4h bisi
Below we are have month bisi
Lets see week bisi can be true support and move price to new Higher High or this make inversion
Now I look short for 91060

BTCUSDT Wishing everyone a great weekend! I'm considering opening a BTCUSDT trade. Although BTC tends to act “blind” over the weekend, I still plan to take advantage of the opportunity.**
🔍 Criteria:
✔️ Timeframe: 15M
✔️ Risk-to-Reward Ratio: 1:2
✔️ Trade Direction: Sell
✔️ Entry Price: 96061.32
✔️ Take Profit: 95810.45
✔️ Stop Loss: 96187.06
🔔 Disclaimer: This is not financial advice. It's a trade I’m taking based on my own system, shared purely for educational purposes.
📌 If you're also interested in systematic and data-driven trading strategies:
💡 Don’t forget to follow the page and subscribe to stay updated on future analyses.

BTC short to 89k before heading to new ATH'sBTC heading to external liquidity at 99k, once that's taken I'm planning on a move down to the 89k daily FVG before a move up to new ATH's
Targets
- short 99k to 90k
- Long from 90k to 120k


BTC - Wreckdown to 90.7k?Okay so as mentioned bTC tested its nPoC 95.1k and soon would come off to 90,740 as the median point where major liquidity stays, the plays are to played on the falls!

BTCUSDTHere the an other idea regarding btc so we are in weekly mitigation we are taking rejection from this area but power of bearish mitigation getting weak day by day. My expectation as it is just we should a candlestick which is greean and big which have big volume would be great. Continue waiting. Let see!!

$BTC - Weekend OutlookCRYPTOCAP:BTC | 1d
We'll see how the 92–90k zone reacts this weekend, but I think the deepest this pullback might go is around 89–87k. We don't really wanna see price breaking the 86k level for a potential higher low
I’m not really expecting a push to 200k–300k in the coming weeks. We already frontran the 70k-68k area (htf demand), and I think we’re just forming a broader distribution range here. It’s possible we take out the highs and deviate up to 114–118k
Let’s see. Enjoy your weekend everyone!

BTCUSDT 4H – Correction Before Breakout | Targeting $98KI'm seeing a potential bullish continuation pattern forming on the BTC/USDT 4H chart. After a strong upward trend, price is currently in a consolidation zone with a likely correction toward the $95,600–$96,000 area, which aligns with both pivot support and the rising trendline.
Key points from my analysis:
Support zone: $95,600–$96,000 (confluence of pivot point and ascending trendline)
Resistance targets:
R1: $97,272
R2: $98,050
R3: $99,308
Momentum: Stochastic RSI near overbought → suggests short-term pullback, then potential continuation.
Volume: No major distribution, bullish momentum remains intact.
📈 I expect a minor dip followed by continuation to R2 or R3, provided the $95,600 support holds.
Stop-loss idea: Below $94,756 (S1)
Take-profit zones: Partial at GETTEX:98K , rest near $99.3K
------------ManOf87_Pro Indicator--------------------
A powerful trading tool combining ATR-based trend detection, Fibonacci pivots, Fair Value Gaps (FVG), engulfing patterns, and multi-factor confirmations (MA, RSI, Bollinger Bands, volume, Z-Score, ROC).
*Buy Signal: Triggers when the trend shifts bullish (price exceeds ATR-based short stop), with strong buy signals requiring additional trend, momentum, and volume confirmation.
*Sell Signal: Triggers when the trend turns bearish (price falls below ATR-based long stop), with strong sell signals needing similar confirmations.
-Ideal for trend-following and breakout strategies, customizable for various markets and timeframes.

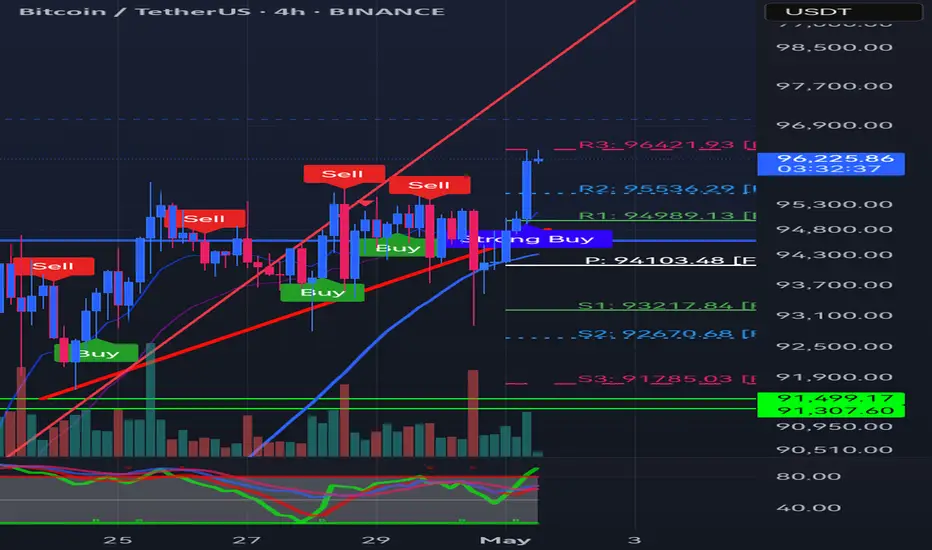
BTCUSD 4H – Strong Buy Signal After Pivot Bounce | Targeting 96KBitcoin (BTC) is showing a strong bullish setup on the 4H chart, following a clean bounce from the pivot level around $94,103. This bounce was accompanied by a strong buy signal, increased volume, and an upward trend in RSI, confirming buyer momentum.
Key levels I'm watching:
Support: $94,100 (Pivot), $93,217
Resistance Targets: $94,989 (R1), $95,536 (R2), and $96,421 (R3)
The price action suggests a breakout toward R2 and possibly R3 in the coming sessions. A sustained close above R1 would confirm this move.
Strategy:
Ideal for a short-term swing trade setup — entry near $94,800, take profits near R2 & R3, and a stop-loss just below $93,200 for safety.
Indicators used:
Trendlines
Pivot Points
RSI (bullish crossover)
Volume Confirmation
Buy/Strong Buy Labels
Bitcoin Bullish movementAccording this analysis Bitcoin seems Bullish Pattern Guys Forecast from Mr Martin Date 28 April 2025.
Bitcoin candles as Buy side use trading clearly in Buy side showing Bullish instant after Long moment the higher formed continue to Bullish Guys just sits strong Support 93,200 which previous should Price will Bullish
Key Levels
Support Level 93,200 / 90,200
Resistance Level 95,500 / 96,500
you may see more details in the chart. Ps Support with like and comments Thanks.

Btcusdt scalpers perspective.On the 15-minute timeframe, BTCUSDT formed a bullish inverse Head and Shoulders (iH&S) pattern. The initial target of $95,000 has already been reached. Further targets are $96,000 and $97,000. The invalidation level for this pattern is below $92,800.

Why aren't we growing now?Bitcoin will not be allowed to rise at the moment. First of all, there are two unfilled liquidity zones. Secondly, there is no catalyst for growth — such as positive news. We will definitely move toward the first liquidity zone. The second one might be reached after some time. Even if there is growth now, it will be a false, artificial rise created by whales. This is crypto — welcome.

[SHORT] BTCUSDT - Binance | Will BTC Correction Happen Now?Welcome,
- Status: 📉 Short
- BTC wait break the green line first
- TP & SL On chart
Keep wait..
Lets see..

Bitcoin 30m chart.In my opinion, this is the most likely short-term scenario.
* The purpose of my graphic drawings is purely educational.
* What i write here is not an investment advice. Please do your own research before investing in any asset.
* Never take my personal opinions as investment advice, you may lose your money.

[SHORT] BTCUSDT - Binance | Will BTC Correction Happen Now?Welcome,
- Status: 📉 Short
- BTC wait 15m Close bellow the Orange Line then Entry
- TP & SL On chart
Keep wait..
Lets see..

BTC middle term Structural analysis, as I see it, we may have a brief pull back to the 86-79K area before resuming the bullish trend. I see very small risks to go back to the 73K area, of course, it is always a possibility. Everything depends on the FED's monetary policy.
DISCLAIMER.
Trade with caution. Make your own research and plan. I own several cryptocurrencies, including bitcoin. This is not a financial advice, it represents merely an opinion only.
Good luck!

Strategic Short on Bitcoin — Textbook Pattern Broadening wedge structure identified. On 1HR timeframe. Price tapped the upper trendline and showed rejection.
Expecting a breakdown towards major support near 91,650 -$91250
Clean invalidation above wedge highs $96200
#BTC #Bitcoin #CryptoTrading #DayTrading #TechnicalAnalysis #BTCUSDT #PriceAction #TradingSetup #CryptoTrader #RiskReward
