#Bitcoin update , 100K or 88k?#Bitcoin has moved exactly as we anticipated over the past 36 hours.
The real test comes: BTC must break above $95,700 to target the $100K milestone.
This level also marks a major distribution zone on the lower timeframes, making it a tough but not impossible barrier to overcome.
⚡ If BTC gets rejected here, expect a potential revisit to sub-$90K levels.
I’ll keep updating this chart as the price action unfolds.
If you found this helpful, bookmark this post and smash the like button to stay in the loop!
Thank you
#PEACE
BTCUST trade ideas

BTC CAN RISE AFTER FALLING TO 91500Hi , Elliott's wave telling us btc should touch 91k to complete wave 4. Be careful btc will dump to 91k !!!!

Bitcoin "Crash" 2025Bitcoin started a more significant correction recently, which is scaring many people, and there is already a lot of talk about the beginning of the Bear market.
In my view, the upward trend is still intact, and this could very well be a healthy correction to prepare for a more significant rise in the coming months.
We have an important support level at $75K which has confluence with the 3D SMMA which has already proven to be strong in the past, I think there will be some reaction and that could very well be the end of this correction, but as long as the price manages to stay above $70K I will remain bullish and looking for Longs.
It is important to note that the Fear and Greed indicator is at 21, with Bitcoin at $84K.

$btc Bitcoin's falling channel....CRYPTOCAP:BTC Bitcoin has seen an all time high of approximately 110k
Current price: $77700
Bitcoin price action is currently respecting the falling channel as seen. With price currently being supported by the 200EMA in the 75k region
Expecting price action to continue to respect this channel and test resistance levels at 88k and then around 92k (bullish divergence also spotted on 2D timeframe). Reactions which will determine higher prices or further rejection.
if #btc price action breaks down from this falling channel then expects supports at 66k and then 56k to be tested for support!

BITCOINBitcoin’s market cap and price action in April 2025 confirm a robust upswing, supported by technical breakouts, improving sentiment, and favorable macroeconomic conditions. Sustained trading above $88,000–$91,000 and a convincing breach of $94,000 are key confirmations of the current bullish phase, with $100,000-103000 as the next major target

Possible BUY on BTCUSDTThere is a Possible Support Area (sky Blue) that price is respecting and there is a counter trendline as well. If broken, I expect a BUY. If not broken, there is a stronger Support Level below which should fuel the BUY.

BTC ANALYSIS (update)📊 #BTC Analysis : Update
✅As we said earlier, #BTC performed same. Around 22% bullish move done after the analysis. Now we can see that #BTC is trading around a mmajor resistance. We could expect around 10% bullish move if it sustain above its major resistance area
👀Current Price: $94,590
🚀 Target Price: $1,04,476
⚡️What to do ?
👀Keep an eye on #BTC price action and volume. We can trade according to the chart and make some profits⚡️⚡️
#BTC #Cryptocurrency #TechnicalAnalysis #DYOR

BTC continuing bullish momentum on 4HRCurrent breakout of BTC shows target price of 107K.
It seems that the price will test the levels of 106-107K

Here for a Funtime short sellCurrently analyzing Bitcoin on the 15-minute chart.
I spotted a symmetrical triangle forming after a strong upward move, showing signs of market indecision.
I mapped out the weekly highs (blue line) and potential support zone (yellow line) based on the daily/weekly structure.
My anticipation:
If price breaks down from this triangle, I expect a short move toward the 92,155 support zone.
If price breaks up, the next target would be around 95,670.
I'm staying flexible and will let the breakout direction guide my next move.
Trade safe, manage risk!
#Bitcoin #BTC #CryptoTrading #ChartAnalysis #Forex #TechnicalAnalysis

Take a step back to leap forwardMost altcoins REALLY NEED another correction before they can aim for higher levels.
There’s a high chance we’re about to see a major shakeout, and after that, the market will gradually rotate capital into altcoins.
It’s coming very soon — probably early May, though it’s hard to pinpoint exactly when. Just be prepared for a big liquidation move to wipe out all the FOMO long positions flying around 😂😂😂😂
This game has never been easy.
Wait for the market shakeout, fam. 😎😎😎😎😎
This upcoming move is going to be a big one 😎😎😎😎

BTC - Next to 100k?Bitcoin (BTC/USDT) is currently showing strong price acceptance above the $94,500 region, with the latest POC (Point of Control) holding firm at $94,880, suggesting this is the price where most trading volume has occurred recently. The VAH (Value Area High) sits just above at $95,100, and price is hovering slightly above that range at $95,043, which is an early sign of potential bullish continuation. Each previous breakout leg—such as the one from $91,000 to $94,000—was supported by rising value areas and shifted POCs, showing steady demand and controlled price discovery upward.
As long as BTC stays above $94,500, dips may continue to be bought, and bulls are likely targeting $96,200–$97,000 liquidity pockets next. However, any failure to hold above $94,400–$94,500 with a 4H close back below VAL could lead to a rotation back toward the older value area around $93,000, which would shift the bias to short-term range-bound or even corrective.
So, more buys can be expected on retests of $94.5K, but profit booking or initial short setups can be planned if BTC prints a rejection wick + closes below the developing POC and VAL — especially below $94,300, which would invalidate current acceptance💥

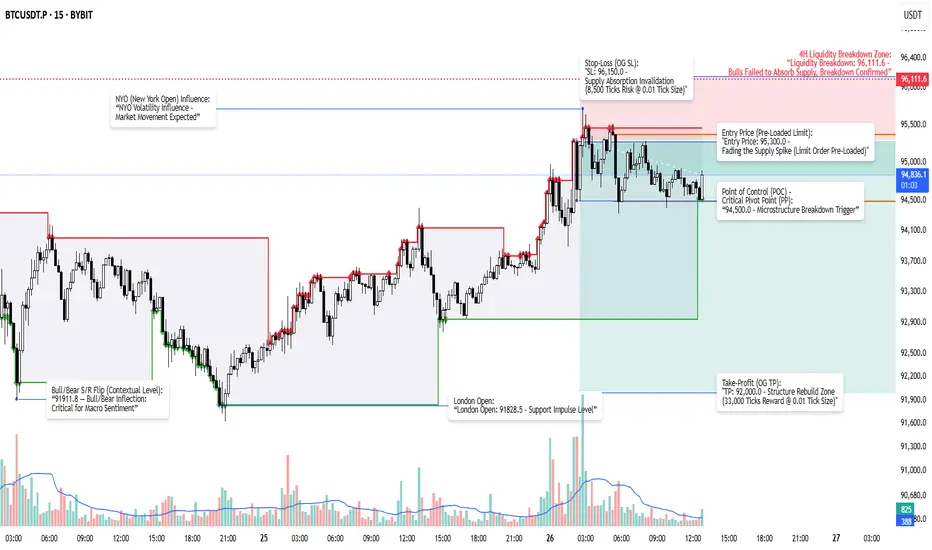
BTCUSD Swing Short | Fading Supply Spike- 4H Liquidity BreakdownBTC retraced into the 4H liquidity breakdown zone at 96,111.6. Bulls failed to absorb supply here, confirming structural weakness. Price spiked into this zone but rejected, setting up a swing short opportunity. This rejection lacked conviction, driven by late longs chasing into thin liquidity. The setup isn’t about momentum—it’s about exploiting the structural fragility where stretched positions collapse.
"Entry Price: 95,300.0 – Fading the Supply Spike (Limit Order Pre-Loaded)"
"SL: 96,150.0 – Supply Absorption Invalidation (8,500 Ticks Risk @ 0.01 Tick Size)"
"TP: 92,000.0 – Structure Rebuild Zone (33,000 Ticks Reward @ 0.01 Tick Size)"
"RRR: 3.88R Skewed Outcome (Pre-Fee)"
"Net RRR After Fees: 3.56R"
Expected stop loss is 850.0 USD range on price, translating to 1.70 USDT risk on my 0.002 BTC size. Expected take profit is 3,300.0 USD range on price, yielding 6.60 USDT reward. Total fees estimated at 0.07492 USDT if TP hits, 0.13427 USDT if SL hits. Net reward after fees is 6.52508 USDT, net loss after fees is 1.83427 USDT, yielding a final net reward-to-risk ratio of 3.56R.
Contextual layers:
"Liquidity Breakdown: 96,111.6 – Bulls Failed to Absorb Supply, Breakdown Confirmed"
"POC: 94,500.0 – Microstructure Breakdown Trigger"
"Bull/Bear Inflection: 91,911.8 – Critical for Macro Sentiment"
"London Open: 91,828.5 – Support Impulse Level"
Conviction weighting:
ADX rising above 22 confirms trend strength weakening into resistance. RSI divergence highlights momentum exhaustion with price making higher highs, but RSI printing lower highs. Open interest rising into supply suggests late long positioning, primed for failure as structure collapses.
This is a structural exploitation setup. Monitoring price behavior for confirmation or invalidation as liquidity thins.
BTC long HVF and Klos BTC long following recent mss and bullish trend break of falling wedge. HVF target around 97k but previous key level of significance at 100k brings target up to 98250 for a 12.5 RRR trade.

Bitcoin Bearish Or Bullish 100K Comment —Scientific StudyDo you see bearish or bullish write a comment... Just do it!
How long is it going to take you? 1 minute.
Ok, what do you see?
The chart as it is now, do you see it bearish or bullish?
Leave a comment tell me what you see... Go ahead. If 100 people leave a comment we can make an independent study. A scientific study, will you participate yes?
Will Bitcoin move above $100,000 this same week?
Go ahead, write a comment what do you think? Bullish or bearish; will Bitcoin move above 100K?
I will not reveal my bias until the end.
The levels are mapped on the chart. Weak support, main support, strong support and untouched support.
» The 0.618 is the strong support level that remains untouched.
» The 0.5 is the main support.
» The 0.382 is weak support, it was pierced.
— The weak support was pierced but Bitcoin recovered above this level so it is no longer weak.
— The main support was challenged twice and it holds.
— The strong support is far away and it remains untouched.
Bottom, Bitcoin's price is trading high in relation to all-time history; Bitcoin's technicals are really strong. Bitcoin's fundamentals are also strong.
Bitcoin will continue growing but will it move above $100,000 this week leave a comment what do you think?
It is an experiment so you have to participate.
If this one time, one time only how long have you been reading forever do it now if it is ok, one minute won't do harm it can be great scientific experiment will you participate?
Are you willing yes?
I think Bitcoin can move above 100K but this is not certain nothing is. It is 100% certain that 2025 will be a strong year and the entire Cryptocurrency market will turn green.
So, there is nothing certain? How are you certain that everything will grow?
Leave a comment-thanks a lot for your continued support.
Namaste.

BTC | Bitcoin CURRENT CANDLE | NEW ATH or 70kThe previous weekly candle seemed unable to make a higher high after retesting the support at 76K.
However, today's bullish impulse has suddenly shocked right through two resistance zones, with the price now trading just above 90k.
If we can successfully CLOSE the weekly candle above 91K, it's likely that BTC is in for a new ATH which would mean ETH will also reach a new ATH, and then altseason will commence 🥳
Watch the following and make sure you are prepared for ALTSEAON:
___________________
BINANCE:BTCUSDT

BTCUSDT-4HBTC after formed 3 LLs,it has divergence and i think it has a bullish guard to grab specified liquidities($$$),
seems to be a bullish trap to get back to bear trend...

Ghost Town Vibes Explained —Bitcoin & The Altcoins Will GrowIt is a very well-known fact that people only join the market and decide to participate when prices are high and rising. Retail is not interested in bottom prices because there is no excitement.
No people around can be taken as a clear signal that the market is trading at bottom prices. This is good, normal and natural, think about it.
When the market is trading at high prices, All-Time High, you will see a massive amount of people engaging and participating. There is excitement, entertainment and fun and that's what people want.
The market being overbought and trading at high prices, lots of activity and many people ready to buy is a clear signal that the top is in a crash comes next. Remember, most of the people are not here to make money, grow or learn, most of the people engage in "trading" to lose money, and that's why there is no interest when prices are lower. Only smart investors, smart traders and whales tend to be looking at the market when prices are great.
Just watch! Just wait!
30 days from now the Altcoins market will be high up. All the trading pairs will be anywhere between 100% and 300% higher compared to current prices, this will not be the top but only a start. At this point, watch the rush and experience all the action around Cryptocurrency, it is just how it works.
Imagine an amusement park but with no entertainment involved. Nobody will pay to visit this park. When they add the games and the rides, loud music, dance and shows, people will go there to play and have fun.
People don't care about the price, they just want to exchange with others and be part of this world.
Humans like to be in groups, community; when Crypto grows, everybody will join.
The ghost town vibes is the best signal that confirms bottom prices and a bull market about to develop. It is the best signal pointing to a strategy of buy and hold. Focus on the long-term.
Whatever happens, think long-term. You can't go wrong when buying at the bottom. This is your chance.
Thank you for reading.
Namaste.

BTC short
95k as a possible trap for bulls
Takes out the Daily swing high (yellow)... Comes back and retests the weekly swing high (green) confluent with Monday's high

BTC Cycle Top - Confluence w/ Previous CycleBased on confluence with the previous cycle, I’m projecting the BTC cycle top around $115K.
Looking at the 2021 cycle, we saw:
A news-driven dump after the initial ATH.
A strong recovery to retest the previous highs.
Followed by the true cycle top exactly 26 weeks (182 days) later.
We're now seeing a similar pattern play out in 2025:
Post-ATH retrace and consolidation.
Recovery underway.
If history rhymes, we could be looking at the final leg up, topping out within the same 26-week window.
Target range is aligned with prior structure and psychological resistance.
Let’s see how it plays out…
#Bitcoin #Crypto #BTCUSD #CycleTop #CryptoTrading #TechnicalAnalysis #BTC115K

BTC/USDT – Waiting for the Retest?Bitcoin has broken through a key resistance level (red line) and is now approaching a critical decision zone. While the momentum looks strong, in the absence of any major bullish news or catalyst, a pullback is more likely in the short term.
🔹 Scenario in Focus:
Price could first pull back to the previous resistance zone around $85K (now potential support – marked by the lower white box).
A successful retest of this zone would strengthen the bullish case and offer a higher probability long entry, with a potential target around $102K (upper white box supply zone).
🔹 If bulls defend the $85K level, we could see a continuation toward new highs.
If not, more downside could open up, so watching this area closely is key.
#btc#bitcoin #btcusdt #crypto #cryptocurrency

BTC H4 Analysis | Key Support Zone: | Watch for ReactionBitcoin is approaching a significant support area between 88,277 and 86,850 on the H4 timeframe. This zone has historically acted as a demand region, and price action within this range will be critical to monitor.
Technical structure shows a potential for volatility, and traders should keep an eye on how BTC behaves around this level. A clear reaction here could offer insight into the next directional move.
No trade setup provided — this is a technical observation for analysis purposes only.

Bitcoin Forming Head & Shoulders – Watch for a Fake-OutPattern Formation: A complex Head and Shoulders structure is forming:
Left Shoulder ✅
Double Head ✅
Right Shoulder forming 🔄
Resistance Zone: The price is currently near a strong resistance area (around $87,000–$88,000).
This zone is likely to act as a ceiling and reject the price.
Expected Move (Blue Arrows):
shows a possible fake breakout above the resistance.
Then, a strong drop is expected, targeting:
First support near $78,000

BTC big profit taking in the horizon....popBTC seems to be full of hot air lately, which lead me to think that most of it is purely speculative. There's a very decent chance of a 5-10k drop soon, at which point, BTCZ / MSTZ (inverse ETFs) will spike up very nicely. History repeats itself and a trend is developing! Let's see where this lands over the next few days, but I'm seeing a thick long red candle coming in the middle of the night as investors look to take their profits.
Best of luck and always do your own due diligence!
