$BTC Correction DOES NOT = Bear MarketPeople are rushing to call it a 🐻 market for CRYPTOCAP:BTC while the correction is 27.8%
Fun Facts:
There were 2x 32%+ corrections between 2024-25
On average, there are at least 3x 30%+ every bull cycle
🐻are in control since summer no doubt
But it's not a 🐻market yet...
Trade ideas

30k bottom 2026My Theory on This Cycle (Bitcoin-Only + Liquidity Expansion)
This was a real bull run — but only for Bitcoin. Institutions drove the entire thing: ETFs, corporate treasuries, and funds wanting non-correlated assets. BTC had clarity and inflows. Everything else didn’t. High rates and no stimulus meant retail had zero excess cash, so the altcoin army never arrived — and without them, there’s no alt season. Simple as that.
Now the rate cuts have started, and like every major cycle in history, aggressive cuts mean the market is breaking, not accelerating. Markets top before cuts, then crash after them — 2000, 2008, 2020. It’s repeating.
The real recovery — the one that brings back alt seasons and full-market mania — only begins when governments panic. That’s when you get actual liquidity, not this shallow “soft landing” narrative. Real liquidity means:
QE (central banks buying assets again)
fiscal stimulus (governments flooding the economy with money)
credit expansion (banks lending aggressively again)
lower rates + liquidity injections happening at the same time
consumer spending returning
retail finally having cash to gamble with
None of that has happened yet.
We’re at the start of the unwind, not the recovery.
So yeah — this was a real bull run, but a Bitcoin-only one. As institutional flows slow and macro weakens, the BTC-only run is ending. A 30k bottom in 2026 lines up perfectly with historical liquidity cycles.
The next true full-market cycle — the one where alts finally get their blow-off top — only begins after the crash, when QE, stimulus, and real liquidity come roaring back.

BTC CURRENT DECODED ANALYSIS DECODED CURRENT ANALYSIS
Below $93,576 it has entered the danger zone ⚠️
An uptrend is only possible above $112,000 for the current year.
It is too early to test its quarterly support.
Quarterly support is noted to be tested in Q4 2026 at $62,772.02. If it tests this quarterly support before time, it will return to test it again in Q4 2026. If it declines further, then $48,000.
All above supports at 85K and 78K are weekly supports.
This message is for educational purposes only.
Always DYOR.

Breaking News: Bitcoin RSI Drops Below 40 — First Time Since EarBitcoin’s weekly RSI has just fallen under 40, a level we haven’t seen since the beginning of 2023 — right before one of the strongest recoveries of the past cycle.
📉 Why it matters
• RSI < 40 on the weekly chart typically signals structural oversold conditions.
• Historically, these readings have aligned with accumulation zones, not distribution.
• Similar setups occurred in 2015, 2019, and 2023, all followed by strong multi-month rallies.
📊 What to watch next
• Weekly reversal signals
• Bullish RSI divergences
• Price reaction around the 85k–92k area
🧩 Key takeaway
A weekly RSI this depressed has often been a buying opportunity, not a sign of long-term weakness.

Bitcoin may continue to fall!
Bitcoin may fall further, and buying and selling during this process will be crucial! Buying high and selling low is what we always do, especially with cryptocurrencies like Bitcoin! We're not aiming to hold Bitcoin indefinitely, but rather to increase our personal assets through buying and selling!
Many people have misconceptions about BTC because their gold-centric and traditionally centralized perspectives fail to recognize Bitcoin's superiority as a digital currency network, its verifiable scarcity, and its censorship-resistant utility. They believe its value stems not from its tangible uses like commodities, but from its decentralized nature, making it an unparalleled non-sovereign store of value and medium of exchange in the digital age. They view its volatility as a temporary phase of price discovery, ultimately leading to greater returns than traditional assets like gold.

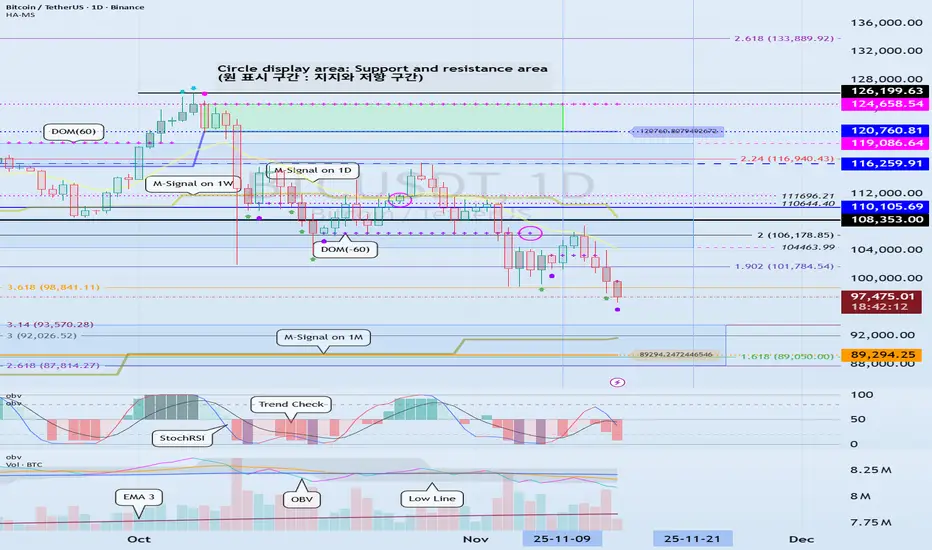
Check for support near the M-Signal indicator on the 1M chart
Hello, fellow traders!
Follow me to get the latest information quickly.
Have a great day.
-------------------------------------
(USDT 1D Chart)
(USDC 1D Chart)
USDT is the major currency that influences the coin market.
The USDT and USDC charts are moving in opposite directions.
This decline appears to be driven by funds flowing out of USDC.
Once the USDC gap decline stops, funds flowing in through USDT are expected to drive the coin market higher.
-
(USDT.D 1M Chart)
For the coin market to show an upward trend, USDT dominance must remain below 4.91 or show a downward trend.
We need to see if the price can face resistance around the Fibonacci level of 0.618 and turn downward.
If not, we should consider a response plan, as a rally toward 7.13 is expected.
-
(BTC.D 1M chart)
For an altcoin bull market to begin, it must either remain below 55.01 or show a downward trend.
Therefore, for the bull market we're waiting for to occur, both USDT dominance and BTC dominance must decline.
If USDT dominance declines while BTC dominance rises, a bull market will emerge, with only BTC rising.
--------------------------------------------------
(BTCUSDT 1D Chart)
The key is whether the price can touch the M-Signal indicator on the 1M chart and turn bullish.
At this point, it's crucial to maintain the price above 89294.25.
If not, a step-down trend is likely.
To turn bullish, the price must remain above the M-Signal indicator on the 1W chart.
At this point, it's crucial to maintain the price above the newly created HA-High indicator point of 110105.69 on the 1M chart.
If not, the price may pretend to rise but then fall again, so you need to consider countermeasures.
This is a basic trading strategy within the box range: buy between DOM(-60) and HA-Low and sell between HA-High and DOM(60).
If the price rises in the HA-High ~ DOM(60) range or falls in the DOM(-60) ~ HA-Low range, you should switch to trend trading.
To do this, we should consider the movements of the StochRSI, TC (Trend Check), and OBV indicators.
To sustain the uptrend after breaking above a key point or range, the StochRSI, TC, and OBV indicators must show upward trends.
At this point,
1. The StochRSI indicator should not have entered an overbought zone.
2. The TC indicator should remain above zero.
3. The OBV indicator should remain above the High Line.
Therefore, check the movements of the StochRSI, TC, and OBV indicators at the support and resistance levels depicted on the 1M, 1W, and 1D charts and consider whether you can trade accordingly.
Based on the current price range, the key points or ranges are:
- 87814.27-93570.28
- 110105.69
- 120760.81-124658.54
I believe the three ranges above are important points or ranges.
Therefore, when the price is near these ranges, you should check the movements of the StochRSI, TC, and OBV indicators to determine a response plan.
-
Thank you for reading to the end.
I wish you successful trading.
--------------------------------------------------
- This is an explanation of the big picture.
(3-year bull market, 1-year bear market pattern)
I will explain in more detail when the bear market begins.
------------------------------------------------------
BTCUSDT.P - November 6, 2025BTCUSDT is currently consolidating above a rising trendline, with potential breakout zones at $104,496 for a bullish move targeting $106,659, or below $102,684 for a bearish continuation toward $101,164. The setup suggests a breakout-driven trade depending on which level is breached first.

Btc big short , will it print again ?Price just took the low, exactly as anticipated. My bearish bias remains firm. Hope everyone stayed safe out there.
Still looking for more downside. Now, I'm just waiting patiently for a retest of my marked zone to find another short setup.

BTC: 82 804.29 — The Price the Market Remembers.🏷 BTC
🏷 17.11.2025
🏷 Capital Sector. Price Slice. System of Intelligent Anticipation.
🏷 82,804.29 — As of publication, this price has not been reached.
You must understand: the market has prices — and each has its own timeframe of execution. Such is the mechanics of the market. One price may execute on the 1D timeframe; another, on the 1M. The retail sector must trade from levels with risk discipline — or comprehend the market, its mechanics, and move toward the price. You must understand that a price is being fulfilled — and allow the instrument to deviate from your target, creating momentum and distance toward its realization — then capture the move on significant, higher timeframes. ATH, bear market, or bull market — these are emotions. Timeframes, patience, and strategy — these are your allies.
Some paint decor and cling to indicators — but you must understand: the institution knows. Large capital paints the data behind your indicators. With one hand, it aids others; with the other, it drives you into losses. The liquidation machine understands technical analysis and the behavioral factors of the masses. Anticipatory markings — dynamic prices — outpace algorithms. By applying observation and statistical rigor, you can avoid being deceived by the theater of market makers — and take your move.
The trend for this week, as of publication, is defined by the price of 98,200. Over the coming days, we will advance above this level in the long zone, and decline below it in the short zone. Upper targets: the instrument is directed toward the price sector of 112K–118K. Beyond this range, the probability of executing unfulfilled prices within this period is minimal. Afterward, the instrument will continue its decline to collect liquidity and execute the prices that remain pending.
Instrument volatility averages 15–18%, distributed equally in both directions. In the prior publication, 88,194.49 was established as the decisive zone — confirmed by statistical behavior of institutional capital.
Our advantage lies not only in analysis — but in the price sector we define in advance. Until these prices are executed, the dynamic marking remains active.
We do not predict the market.
We record its reality.
Please excuse any stylistic imperfections—English is not my native language. I write not to perfect form, but to reveal substance. My authority lies in the structure of the market, not in syntax.

BTC Slips Below 50 EMA: Caution RequiredThings could get uglier as CRYPTOCAP:BTC has now broken below the 50 EMA, a key long-term dynamic support level.
This breakdown signals growing weakness and may open the door for deeper downside if buyers don’t step in soon.
DYOR, NFA

Bitcoin run is over BTC chart shortly . The season probably has been over
This pattern is not accepted yet , but looks promising
Just personal opinion
Not financial advice

Target aquired! Another beautiful win over hereIn this setup, we identified a strong entry signal, executed perfectly, and captured profit as the predicted move played out. The 30-min interval revealed a high-probability trade. Key levels were respected, and our targets were met with discipline. Stop loss and risk management kept us safe through volatility. Great momentum in BTCUSDT—watch for further setups in upcoming sessions!

Bitcoin | 3 Hrs | Long | Target: 107kThis technical analysis is for informational and educational purposes only. It does not constitute financial advice. Remember to always research and consult with a professional before making investment decisions. Good luck! 📈💼🚀

40 consecutive days of accurate BTC forecastingSome people get lucky once or twice, but 40 consecutive days of accurate BTC forecasting is what happens when artificial intelligence meets MTOPS intelligence .
Started documenting these calls just to prove it to myself—40 days later and still undefeated on Bitcoin price action.

BTCChannel Setup
BTC appears to be trading (or has recently traded) inside a parallel channel. Channels are formed by two roughly parallel trendlines — an upper resistance line, and a lower support line.
The News Minute
+1
In some recent analyses, the support of this channel is being defended, highlighting a “revised” lower trendline that’s critical for continued bullish momentum.
Blockchain News
However, there is evidence that BTC has broken down from some earlier descending parallel channels.
BeInCrypto
There’s also ambiguity in momentum — depending on the time frame, some indicators are bearish, others slightly bullish

Bitcoin Poised for Recovery After Support Rebound Eyes on $105kBitcoin (BTC/USDT) on the 1H chart has bounced from the $99,500 support zone after breaking a short-term ascending trendline. The Ichimoku Cloud signals possible resistance near $102,400, with a bullish target set around $105,000–$107,500 if momentum continues. A clear breakout above $102K could confirm a short-term trend reversal toward higher highs.
🔍 BTC/USDT (1H) Technical Analysis — Key Points
1. Trend Structure:
Bitcoin broke below its ascending trendline from Nov 7–12, signaling short-term weakness.
The current move is a retest of the broken trendline, acting as new resistance.
2. Ichimoku Cloud:
Price is trading below the cloud, indicating a bearish short-term sentiment.
Kijun (baseline) near $102,400 is the immediate resistance level.
Future Cloud (Senkou Span A/B) shows potential flattening — early sign of possible reversal if price re-enters.
3. Support & Resistance Levels:
Major Support: $99,500 – $97,500 zone (buyers stepped in here).
Immediate Resistance: $101,700 – $102,400 zone.
Next Target Zone: $105,000 – $107,500 if breakout confirms.
4. Volume & Momentum:
Weak bearish momentum after the sell-off — potential for a relief rally.
A bullish confirmation needs strong candle close above $102,500 with volume.
5. Short-Term Outlook:
If Bitcoin stays above $99,500, bulls may push to reclaim $102K.
Failure to break above could lead to further downside toward $97,500.

#BTC/USDT Broke the support. Levels to watch...💬 Bitcoin Update:
Unfortunately, the previous BTC setup has been invalidated — BTC broke the support.
The next major support levels are $90.3K and $86.5K.
If BTC breaks $90.3K, there’s a strong chance of a sharp bounce from the lower support zone.
The best move right now is to observe how the price reacts; no need to take unnecessary risks when things look uncertain.
You can look for short opportunities on relief bounces, but personally, I’d rather wait for a clearer setup.
As always, do your own research and make your own decisions.
If you found this helpful, please hit the like button ❤️
Thank you.
#PEACE ✌️

Hey Btc What Do You Want ?Hello TradingView community, Bitcoin continues to move within a well-structured rising parallel channel a pattern that has beautifully guided its trend since early 2024. Each touch on the rising support has offered meaningful rebounds, while the upper boundary has acted as a clear zone of supply and exhaustion.
However the current weekly setup suggests a shift in momentum that deserves attention. Price is now hovering near the rising support line, and although this zone has previously triggered strong bullish responses, the internal structure looks notably weaker this time.
1. Structure and Price Behavior-:
The recent rejection from the $114,700 resistance — which aligns with the mid-channel zone — shows how sellers continue to dominate near this region.
While the overall trend remains upward, each successive swing high has shown diminishing bullish strength, hinting that buyers are gradually losing control of the short-term momentum.
If Bitcoin fails to hold this rising support, it could shift the medium-term tone from accumulation to correction.
2. Resistance Dynamics-:
The $114,700 area holds strong confluence:
It coincides with multiple past swing highs.
It aligns with the median of the rising channel.
It represents a psychological round figure where institutional activity tends to appear.
This zone acts as a decisive line between continuation and reversal — reclaiming it could reinstate bullish dominance, but repeated failure would open the path toward lower supports.
3. RSI and Internal Momentum-:
The RSI (14) presents a clear bearish divergence, forming lower highs even as price carved new peaks. This ongoing divergence since early 2024 highlights a loss of internal strength — a common precursor to larger consolidations or trend reversals.
Recently, RSI also broke below its local support trendline, reinforcing the idea that bearish momentum is gaining traction beneath the surface.
4. Probable Scenarios-:
Scenario A -:Technical Rebound:
Bitcoin could attempt a short-term rebound from the current rising support toward the $110K–$114K zone. Such a move, however, might remain corrective unless accompanied by a visible increase in volume and RSI recovery.
Scenario B -:Deeper Correction:
A clean breakdown below the rising support would likely expose Bitcoin to the weekly demand zone between $75,000 and $70,000 — a region that historically attracted strong buying interest.
This area aligns with the 38.2% Fibonacci retracement of the larger advance, making it a technically sound demand pocket.
5. Broader Context-:
Despite near-term weakness, the macro structure of Bitcoin remains constructive. Corrections within rising channels are normal and often healthy — they reset sentiment, absorb excess leverage, and allow new institutional positions to build.
As long as Bitcoin respects the lower boundary of this channel, the broader bullish narrative remains intact. But a confirmed weekly breakdown could temporarily shift the trend bias toward medium-term consolidation before the next major impulsive leg.
Technical Summary-:
Pattern: Rising Parallel Channel
Resistance: $114,700
Support: Rising Trendline (~$97,000)
Demand Zone: $75,000 – $70,000
RSI: Bearish Divergence + Breakdown
Bias: Cautiously Bearish / Corrective Phase
Regards---Amit

btc is ready to reloadAfter the recent increase, Bitcoin should activate more stop losses and eventually reach the $85,000-$87,000 range after a period of range fluctuations. After that, we expect the price to grow.

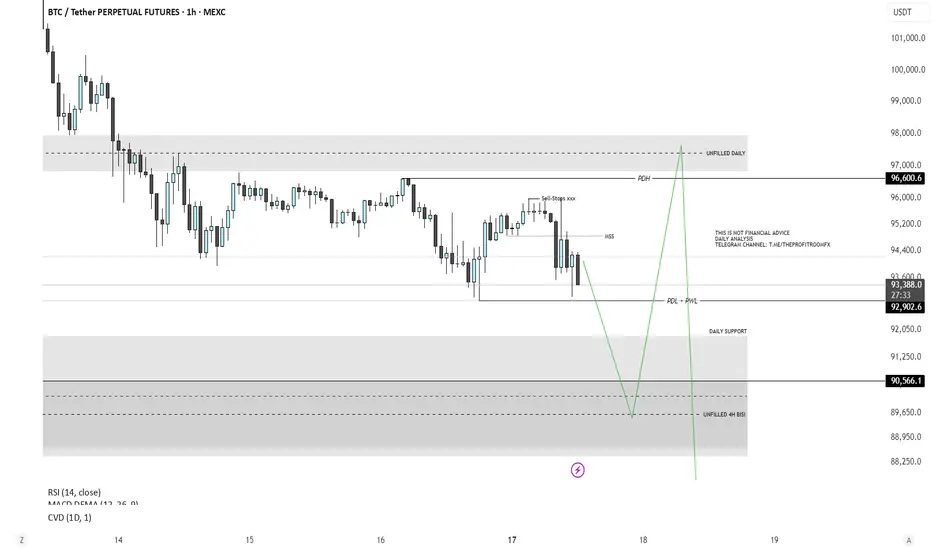
Bitcoin Analysis - Short & LongPrice is anticipated to sweep the previous day’s low (PDL) and previous week’s low (PWL), while also mitigating the unfilled H4 imbalance.
This aligns with a potential retest of the daily FVG support zone before initiating a move to the upside.
There is a clear draw on liquidity toward the buy-side, with both the previous day’s high (PDH) and an unfilled daily FVG serving as objective targets.
After filling this daily FVG imbalance, price is expected to continue delivering lower to address remaining inefficiencies on the sell-side, specifically around the 87,000 level, where another unfilled daily FVG is present.
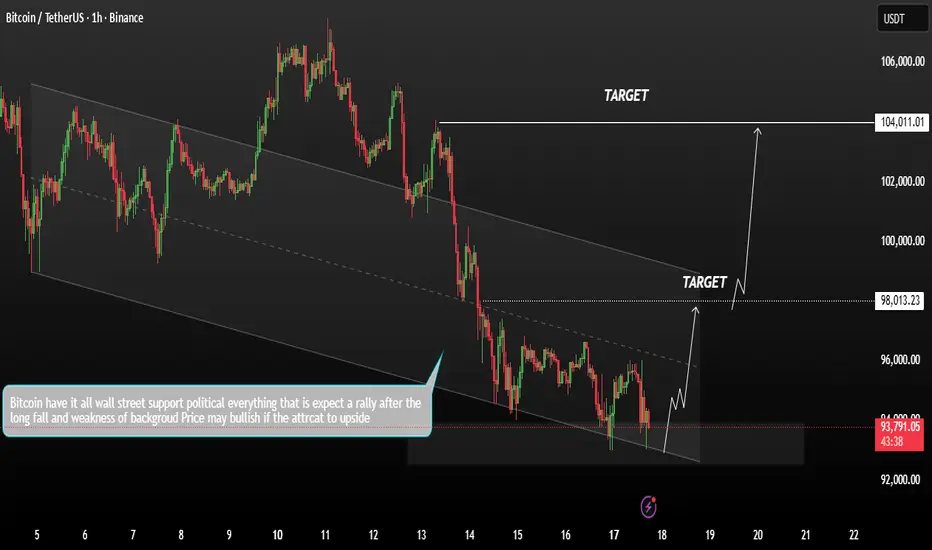
Bitcoin Potential short-term bullish reversalBitcoin is showing early signs of a potential short-term bullish reversal as price continues to respect the descending channel. The latest bounce from the upper boundary suggests increasing buy interest.
If the bulls manage to break above the key resistance level and price holds above the channel, the short-term bullish scenario remains valid. In that case, price could continue its upward movement toward the 98K – 104K upper resistance zone.
You may find more details in the chart,
Trade wisely best of Luck buddies.
Ps; Support with like and comments for better analysis Thanks for Supporting.
BTCUSDTBTCUSDT going to fall more in future. I think 88k coming in this running week. Lets see. Happy Trading ☺️ DYR

BTCUSDTP. - November 18, 2025Price is pulling back toward a clear support zone around 93,000, with a deeper support level near 92,000, while the nearest resistance sits around 96,200 along a descending trendline. The chart suggests a possible bounce from support toward resistance, but a break below 93,000 could open the way toward 92,000.
If trading this setup, the long scenario is higher-risk, as price is currently trending downward into support and could continue lower before reversing.
