Will Bitcoin Break This Resistance ?BITCOIN is once again at a critical resistance level, and the crypto world is split.
Some believe we’re gearing up for a new all-time high (ATH), while others argue the top is already in—and this could be a classic bull trap in disguise.
The key lies in how price reacts to this zone.
• A breakout above $109K would confirm a new ATH and likely spark another leg up.
• But a strong rejection here might signal that the rally was a trap, echoing patterns we’ve seen in past cycles.
My Take: We’re at a make-or-break moment. Confirmation from this level will decide the next big move.
What’s your take—breakout or bull trap?
BTCUST trade ideas

BTC NEW UPDATE (4H)This analysis is an update of the analysis you see in the "Related publications" section
Bitcoin has not yet reached our zone, but it has formed a correction of the same degree as the previous ones and has also created a support area. The diametric pattern could potentially shift into a symmetrical one, and Bitcoin may even reach the 100K–105K zone.
We should keep a close eye on the 100K level for now, as it also serves as a psychological resistance.
For risk management, please don't forget stop loss and capital management
Comment if you have any questions
Thank You

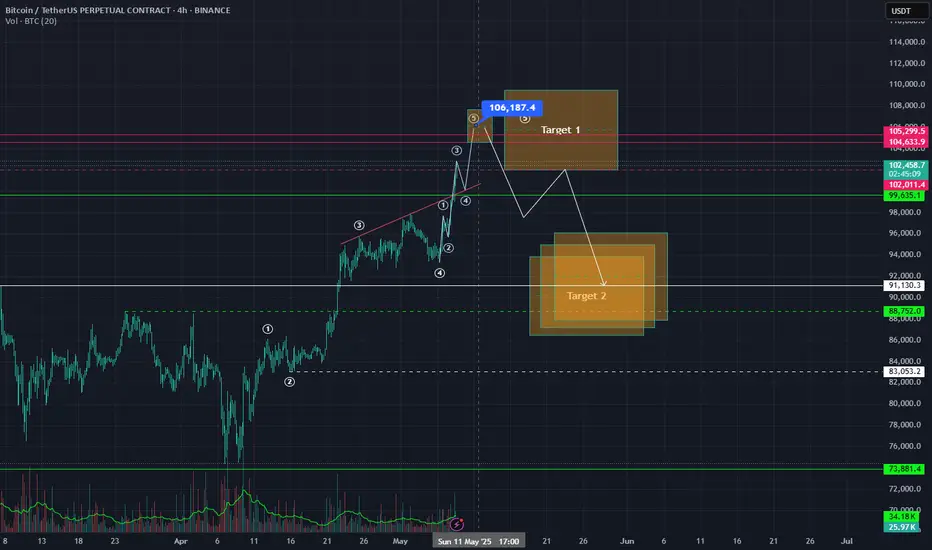
Bitcoin on the road to $105k and beyond...So Bitcoin has finally flipped from bearish in April to bullish in May 25.
As per Elliott Wave theory, it has been printing a clear Wave 1 from the bottom below (aprox. @$74.500).
At the time of this post, btc is @ the impressive price of $102.289.
I has clearly made a subwave 1, 2, 3, 4 and its on its way of finishing up subwave 5.
Thing is... this looks as a non stop movement for the time being.
That´s how BULLISH everyone hast turned.
My projection is that the whole swing should finally end somewhere between $104.600 - $105.300 (even if it could push a bit higher, such as $106.200 or so). Yes, it could go even further and then $107k, 109 and 110 would be open. But it seems fare reaching.
I rather stick to the former:
Wave 1 would end at around $104.600 - $105.300, and Wave 2 correction could take us somewhere between $93.500 and $88.750 (give or take).
It´s game! Let´s see how this finally plays out...
Bias: BULLISH
BTC - The Perfect Retest!Hello TradingView Family / Fellow Traders! This is Richard, also known as theSignalyst.
The picture says it all!
🔄Is history about to repeat itself?
If so, we are currently in Phase 2. 📈
What’s next? A dip toward the $87,000 - $88,000 zone would be the perfect retest to look for trend-following longs and expect the start of Phase 3.
📚 Reminder:
Always stick to your trading plan — entry, risk management, and trade management are key.
Good luck, and happy trading!
All Strategies Are Good, If Managed Properly!
~Rich

Here's a simply analysis on BTC.BTC Update:
BTC faced rejection after reaching $97.8k, and with the current price at $94.4k, it is now in Retest Range 1 between $92.5k and $94.5k. This range has previously shown multiple rebounds, but when compared with the RSI, the chances of further rejection appear higher.
In another scenario, if BTC fails to hold Retest Range 1, we may see it pulling back or retesting levels around $87k.
Be cautious with multiple long positions for now and always trade with a proper stop-loss.
Regards,
Dexter

TradeCityPro | Bitcoin Daily Analysis #80👋 Welcome to TradeCity Pro!
Let’s dive into the Bitcoin analysis and key crypto market indicators. As usual, I’ll review the triggers for the New York futures session.
⏳ 1-Hour Timeframe
Yesterday, price made a bullish move and broke the 97139 zone, but later it turned out to be a fake breakout, and now it’s moving downward.
🔍 It’s likely that this downward move is just a pullback toward the SMA99 zone, and price may bounce back up afterward. If SMA99 breaks, deeper corrections down to 95370 are possible.
✔️ In my view, as long as price stays above the 95370 zone, Bitcoin remains in an uptrend. Only once price drops below this level can we start identifying potential bearish triggers.
📈 For now, we need to wait for more structure to develop before entering any positions. The 97139 level still remains a strong bullish trigger, but it’s best to wait for a reaction to it first so we can pinpoint the exact line, and then enter upon its breakout.
⚡️ Nothing more to add about Bitcoin for now — it’s Saturday, a weekend, and the chances of ranging price action are high.
👑 BTC.D Analysis
Looking at BTC dominance, yesterday it made a slight corrective move and pulled back to 64.77, where it seems to have found support.
📊 The next bullish trigger is the breakout of 64.91. Overall, the trend is still bullish, so if you're considering multi-day or swing positions, Bitcoin remains a better choice than altcoins.
📅 Total2 Analysis
Turning to the Total2 chart, this index was rejected from the 1.05 resistance once again yesterday and failed to hold above it. Until that changes, altcoins likely won’t see any significant upward momentum.
🔑 For downside movement in Total2, the trigger remains a break below 1.03.
📅 USDT.D Analysis
Now to Tether dominance — yesterday, this index finally closed a candle below the 4.99 level, but it was a fakeout, and it moved back above, once again preventing the broader market from turning bullish. This fakeout could inject bearish momentum into the market, potentially leading to deeper corrections.
⭐ For now, the 4.99 level still serves as a strong trigger for a bearish USDT dominance and thus a bullish signal for the market. A break above 5.10, however, would be a solid trigger for USDT dominance to trend higher.
❌ Disclaimer ❌
Trading futures is highly risky and dangerous. If you're not an expert, these triggers may not be suitable for you. You should first learn risk and capital management. You can also use the educational content from this channel.
Finally, these triggers reflect my personal opinions on price action, and the market may move completely against this analysis. So, do your own research before opening any position.

BITCOIN - A real bullish sign!3D chart shows a Bullush exaggerated Divergence on RSI indicator.
Bullish Exaggerated Divergence happen when:
1- Price: Forms a double bottom (two equal lows).
2- RSI: The second low is higher than the first.
- Implication: Momentum is picking up despite flat price, hinting at a possible upward reversal.
It's called exaggerated because price looks stable (same lows), but RSI reveals a hidden shift in momentum.
There’s also a breakout from a falling wedge pattern and a perfect break above the 50 EMA with a massive green candle.
We are now at the beginning of Bitcoin’s true bullish rally.
Best regards Ceciliones🎯

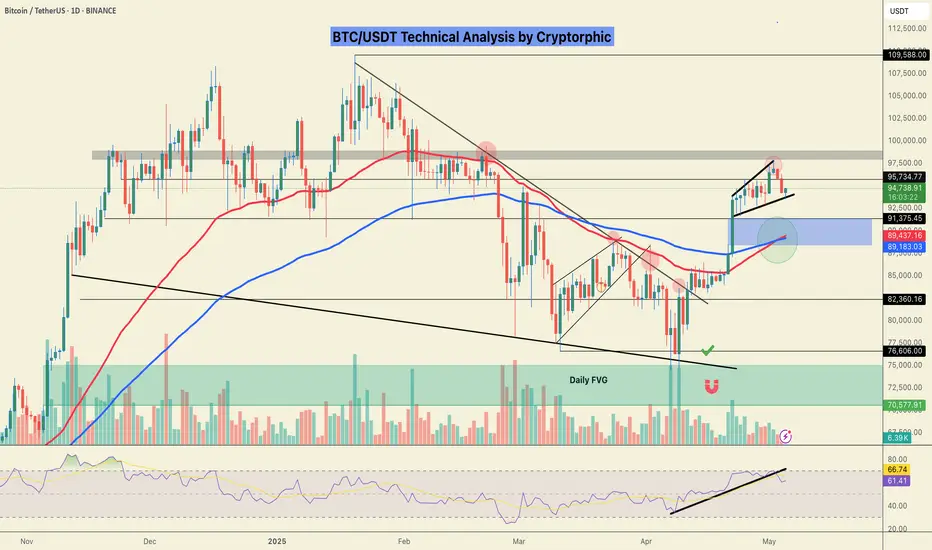
BTC | WHY Bitcoin is BULLISH | 2021 Fractal5 reasons why I say BTC is on it's way to a new ATH (All Time High) :
✅1️⃣ Support zone reclaimed
BTC has successfully reclaimed the support zone ABOVE the neckline resistance, a topic that I've been discussing over the past two weeks. If you'll recall, I pointed out either 70k or 90k. We have our answer:
✅2️⃣ Trendlines
Trendlines are BULLISH as BTC continues to make highger lows, a key indication of bullish sentiment even when a pullback is present:
✅3️⃣ Moving Averages
BTC has reclaimed ALL moving averages in the daily, a bullish indication:
✅4️⃣ Trend Based Indicators
A bullish flash in the weekly is a strong sign:
✅5️⃣ Fractal
It's possible that BTC plays out similarly to the previous ATH fractal from 2021:
________________________
BINANCE:BTCUSDT

Bitcoin Price Action Analysis – Bearish Correction Toward DemandHello Guys!
Let's analyze btc!
Rising Trendline Break: The bullish structure has broken down as the price failed to hold above the key support region around $96,000–$96,200.
Targeted Demand Zone: The highlighted purple box between $94,200 and $94,700 represents a demand zone that has previously shown strong buyer interest. The current structure suggests Bitcoin may revisit this zone for a potential bounce.
Bearish Momentum: A large arrow indicates the directional bias toward the downside, aligning with the correction and market sentiment.
Fake RSI Divergence: The RSI panel indicates a “Fake Divergence” pattern, which may have misled early bulls. RSI has since dropped and currently hovers in the neutral zone, with no strong bullish signals yet.
_____________________________
Conclusion:
Unless a strong bounce occurs around current levels, Bitcoin looks poised to correct further toward the $94,200–$94,700 demand zone. Traders should watch for reactionary price action and bullish reversal patterns before considering long entries.

BTC Local Top in? $92000 in the next few days....After retracing more than 78.6% from the 74k low, a BTC local top appears to be in. Expecting prices to fall to the local support of GETTEX:92K initially...

Bitcoin and its RALLYBTC lately has gain 37% back of this value after the crash to 74k, what a great swing coming back to 102k, no one beleiving.
Im starting a short position around this level into 90k

#BTC reaches the red target zone📊#BTC reaches the red target zone✔️
🧠From a structural perspective, the goals of the long structure we built in the blue resistance zone have been fully achieved, so we need to be vigilant against the occurrence of a pullback, and do not chase the rise in the sell zone! We should look for short opportunities in the sell zone.
➡️The concerns in the previous post still exist, because this week is not over yet, we need to observe whether the closing price of the weekly candlestick chart can stabilize above the blue resistance zone. Only when it stabilizes above the resistance zone, the blue resistance zone will turn into a support zone. Then look for long trading opportunities in the support zone.
⚠️Note that if we set a new record high, we also need to wait patiently for a pullback to appear before participating in a new long trade.
🤜If you like my analysis, please like 💖 and share 💬 BITGET:BTCUSDT.P

Bitcoin short Waiting for a retest at around 97k and then getting ready for a short position.
I think we get that 90k region even a litte bit sub 90k .

BTC Breaks 100K: Trend Analysis & Trading AdviceFrom the 4-hour K-line chart of BTC, the bullish power in the market has been overwhelming. There have been six consecutive bullish candles. Not only has it successfully broken through the important defense line of the 100,000 mark, but it has also continued to rise with increasing trading volume after the breakthrough, indicating a strong bullish momentum.
The MACD indicator has been diverging above the zero axis, and the fast and slow lines are extending upward at an angle of 45 degrees. The RSI indicator remains in the overbought area above 70 without showing any obvious signs of turning down, which validates the strong characteristics of the current market trend.
When observed from the 1-hour time frame, the market is also dominated by bulls. The price has been steadily moving above the middle band of the Bollinger Bands. Although there have been pullbacks, each pullback has found effective support at the previous high, forming a standard bullish arrangement of higher highs and higher lows, and continuing to maintain an upward trend.
BTCUSD
buy@100300-100800
tp:101500-102500
Investment itself is not risky; it is only when investment is out of control that risks occur. When trading, always remember not to act on impulse. I will share trading signals every day. All the signals have been accurate without any mistakes for a whole month. No matter what gains or losses you've had in the past, with my help, you have the hope of achieving a breakthrough in your investment.


Downside for bitcoin around the cornerLooking for a retrace to between 96-97.5k
-Hourly closure above red horizontal line = idea invalidated
-Drop will increase in volatility below red box zone marked on chart
Happy trading!

BTC at Key Breakout Zone – Next Move Critical!
Bitcoin has entered a major resistance zone near $103,400. A confirmed breakout above this area could open the path toward $120,000. However, if bulls fail to hold, a retest of the $96,000 support is likely. Price action in the next few candles will be crucial – stay alert for either a breakout continuation or a rejection setup.

BTCUSDT - RSI Bearish Divergence at 4H shows 15500 Fall SetupBearish Divergence at 4h timeframe seen in BTCUSDT. atleast 15500 points fall is expected as price is going up but rsi is bearish

Bitcoin is Showing a New Trend!!!Hey Traders, in today's trading session we are monitoring BTC/USDT for a selling opportunity around 95k, Bitcoin is trading in a downtrend and currently is in a correction phase in which it is approaching the trend at 95k support and resistance area.
Trade safe, Joe.

#BTC/USDT Bullish Crossover in Play!CRYPTOCAP:BTC Update: Bitcoin is currently holding support and showing signs of strength with a bullish EMA crossover — the 50 EMA crossing above the 100 EMA, which historically signals upward momentum based on past fractals.
The lower support zone is marked in blue, in case the price dips further.
Immediate resistance remains at the GETTEX:98K level — a confirmed close above this could trigger a move toward $103K.
Stay tuned for more real-time updates.
Do hit the like button if you like it, and share your views in the comments section.
Thank you
Bitcoin | Short | Target: 96k - 97k | 3HrsThis technical analysis is for informational and educational purposes only. It does not constitute financial advice. Remember to always research and consult with a professional before making investment decisions. Good luck! 📈💼🚀

Unlock Trading Success with Multi-Timeframe MasteryIn trading, particularly in the Forex market, a well-defined strategy is crucial for consistent profitability. One of the most effective techniques used by successful traders is multi-timeframe (MTF) analysis. By examining price action across different timeframes (e.g., daily, 4-hour, 1-hour), traders gain a clearer understanding of market structure, trend direction, and optimal entry/exit points. This article explores how MTF analysis works, its benefits, and practical steps to implement it in your trading.
🔍1. Analyzing a Pair Across Multiple Timeframes for Clearer Trend Direction
The foundation of MTF analysis lies in identifying the major and minor trends. By analyzing at least two timeframes, traders can align their strategies with the broader market direction while fine-tuning entries on shorter timeframes.
⚡The High Wave Cycle (HWC) Approach
To begin, determine your High Wave Cycle (HWC), which depends on your trading strategy and timeframe. For instance:
If you trade on the daily timeframe, your HWC might be the monthly chart.
If you trade on the 1-hour timeframe, your HWC could be the weekly chart.
The HWC helps you identify the major trend. For example, on the daily chart, you might analyze the trend using Dow Theory, pinpoint key support and resistance levels, and identify trendlines or patterns. This gives you a clear picture of the market’s broader direction.
Once the HWC is defined, give it significant weight when analyzing lower timeframes for trade setups. For instance, if the daily chart (HWC) shows a downtrend, you’d prioritize bearish setups on the 1-hour chart, even if a minor uptrend appears.
Example: SOLUSDT Trade Setup
Consider a scenario where the 1-hour chart shows a strong uptrend. The price breaks a key resistance level and a descending trendline, suggesting a potential long position.
However, checking the daily chart..
(HWC) reveals a clear downtrend. According to Dow Theory, a major trend reversal requires a confirmed break above the previous high (e.g., $150). Since this hasn’t occurred, the market remains bearish.
In this case, MTF analysis guides your strategy:
Reduce position size to lower risk, as you’re trading against the major trend.
Take profits early, as the price could reverse at any moment.
Avoid overtrading by limiting the number of positions until the trend change is confirmed.
This approach ensures your trades are aligned with the bigger picture, minimizing losses from false signals.
🎯2. Spotting Entries and Exits by Confirming Trends Across Timeframes
MTF analysis not only enhances risk management but also improves the precision of your entries and exits. By confirming signals across timeframes, you can filter out noise and focus on high-probability trades.
Example: Bitcoin (May 15, 2021)
Let’s rewind to May 15, 2021, during Bitcoin’s post-bull run correction. On the daily chart (HWC), the price formed lower highs and lows, breaking a key support level, signaling a bearish trend and a potential exit for long positions. This indicates that spot traders should sell, and swing traders on lower timeframes should focus exclusively on short positions.
On the 1-hour chart, you might spot a minor pullback, tempting a long trade. However, MTF analysis reminds you to align with the daily downtrend, so you’d only consider short setups. This disciplined approach prevents you from trading against the major trend, improving your win rate.
📊The Medium Wave Cycle (MWC) for Added Clarity
Between the HWC and lower timeframes lies the Medium Wave Cycle (MWC), which provides an intermediate perspective. For example, if your HWC is the daily chart, the MWC might be the 4-hour chart. The MWC helps confirm the major trend’s strength or detect early signs of reversals before zooming into lower timeframes for entries. By checking the MWC, you can filter out noise and ensure your trades align with both the major and intermediate trends.
💡Conclusion
Multi-timeframe analysis is a game-changer for traders seeking consistency and precision. By combining the major trend from your HWC, the intermediate perspective from your MWC, and minor trends on lower timeframes, you can make informed decisions, manage risk effectively, and time your trades with confidence.
Start by defining your HWC and MWC, analyzing the major trend, and aligning your entries and exits with multiple timeframes. Pick a pair, test this strategy on a demo account, and share your results in the comments below! With practice, MTF analysis will give you a tactical edge in navigating the markets.
🤍 btw im Skeptic :) & If you found this article helpful, don’t forget to like, share, and follow for more insights and trading strategies! <3

2 options but both are bullish!CRYPTOCAP:BTC is consolidating but wants to make a next leg next week. Or we break out out of the falling wedge or after some more consolidation in the ascending wedge.
either way bullish!!!
