AUDCAD at BreakoutAUDCAD is at breakout point, can go both side. If we look at the daily trend then its showing some reversal setup and if we see at 1 HTF then its showing divergence at RSI. We can put both side order and can wait for either side breakout.
CADAUD trade ideas

AUDCAD AUD/CAD WAIT FOR OPEN MARKET AND WITTING NEWS
*** CAD ***
1- Canada Housing Starts
2- Canada Foreign Securities Purchases
3- Canada Foreign Securities Purchases by Canadians

AUDCAD Wave CWe have a lower low with bullish RSI divergence, which I'm labeling as green c / blue B.
In my primary count, we have already finished green I-II, and are currently on green III.
My target is gray resistance at .916.

AUDCAD 166 pips to bag next weekwe going long true resistance broken and market structure shit has happened today, this the only trade you need next week

Bullish Outlook on 4H Chart: Key Fibonacci Levels in Focus
AUDCAD appears bullish on the 4-hour chart, with the first resistance level (Level 1) at 0.90550. A breakout above this level could drive the pair toward the next key resistance (Level 2) at 0.91257, aligning with Fibonacci retracement levels.

Idea for FridayThe Canadian dollar strengthened against the greenback on Friday, and the yield on benchmark government debt slipped.
The loonie was trading 0.2% higher at C$1.4163 to the greenback, or 70.61 U.S. cents, after trading in a range of 1.4156 to 1.4201.
Canadian government 10-year bond yields fell 3 basis points to 3.087%. The yield on similar U.S. government benchmark debt fell to 4.4724%.
U.S. March crude futures rose 20 cents to $71.49 a barrel on Friday.
Canadian factory sales fell 0.3% in December from the previous month, Statistics Canada said. Analysts polled by Reuters had expected factory sales growth of 0.7%.

Possible bearish breakout and whyMy analysis show that bears have the upper hand as the changed the trend a bit by breaking below the CHoC and currently the price is now in a range between support and resistance
Since bears had a potential market control we can assume that the range is likely to be broken below(support) all the way to the Demand level and this will confirm bears are in control of the price and we should look for selling opportunities
so all in all wait for a break below before entering, market confirmation is important

AUDCAD: Growth & Bullish Forecast
The recent price action on the AUDCAD pair was keeping me on the fence, however, my bias is slowly but surely changing into the bullish one and I think we will see the price go up.
❤️ Please, support our work with like & comment! ❤️

audcad idea if breakout *** We note that the price touched 0.8849 twice since August 8, 2024, once on the same date and once between January 10 and 13 of this year, forming a resistance area that the chart could not cross.
*** In the event of a breakout from the top of the chart, we wait for the price to return from the BEARISH OB area, and in the event of a breakout, it will reach the highest area in this bearish chart HH POINT
*** The price will reach the LL POINTS area to take its liquidity from it to reach HH POINTS
****Give me your opinion in the comments****

AUDCAD Buy Idea share your opinion in comment
price enter in support zone we look a buy idya from this area

#004 Feb 2024 Obvious Range AUDCAD ShortPrice in a range.
Shorting for 1R SL to 0.65R TP or so.
Will come back at 9pm SGT later.
What will be will be.
I went to work just now and the CBF190R feels so much more responsive than the previous FZ16.
I lane split alittle today and felt safe, I also filtered in between vehicles on the highway because I felt that this bike could handle potential situations that might occur.
1733SGT 10022025

AUD/CAD SELL SETUPA Possible down movement can happen so i am waiting for a good opportunity to execute short orders.
Happy trading.

AUDCAD SYMBIOSE PATTERNW on a i.c.i. = SYMBIOSE pattern
I see some potential up side I will prob. not hold until my final TP we will see
4.5rr final
1% risk

AUDCADI am looking for a short because price has met resistance and I expect liquidity to take out the zone made from the HL.


AUDCADAUDCAD is in Accumulation phase.
Indicator shown that price will go up from here.
No such sign of reversal here.
we buy at CMP.

AUDCADhello trader, the price is consolidating downward after price reached the resistance, this is possible bull flag... but again with upcoming news of RBA cash rate on 02/18... the price could retest the support to make double bottom... or the price can breakout of consolidation and become bullish... no confirmation yet as price is in between main support and resistance so best to wait it out... overall I'm looking for buy position here.. just an idea for now to prepare you for your trade... good luck

AUDCAD Bullish Pennant Formation and Expected Breakout AnalysisAUDCAD BUY Entry Point= 0.90000
Stop loss = 0.89500
AUDCAD is currently trading at 0.90000, with a target price of 0.91500. This setup suggests an expected upward movement of 150+ pips. The market is forming a bullish pennant, a continuation pattern indicating potential for further gains. A breakout from this pattern is anticipated, which could drive prices higher. The breakout confirmation will strengthen the bullish sentiment, increasing the likelihood of reaching the target. Traders should monitor volume and momentum indicators for confirmation. Stop-loss placement is crucial to manage risk effectively. If the breakout is strong, the price could move swiftly towards the target. Patience and proper risk management are key to capitalizing on this setup. Overall, a bullish outlook is expected upon a successful breakout.

AUDCAD for sellPrice broke out of a weekly support and retested it, formed a double top And wait for retest, a bearish candlestick pattern for confirmation.

AUDCAD Breakout And Potential RetraceHey Traders, in today's trading session we are monitoring AUDCAD for a selling opportunity around 0.90000 zone, AUDCAD was trading in an uptrend and successfully managed to break it out. Currently is in a correction phase in which it is approaching the retrace area at 0.90000 support and resistance area.
Trade safe, Joe.

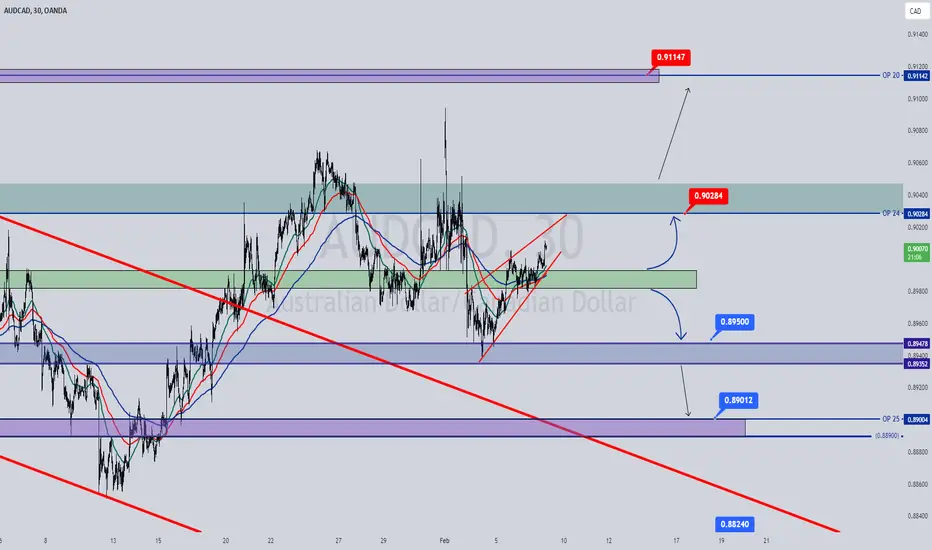
AUDCADAUDCAD will test Opening Price 2024
Sell Plan
N3 = 0.90270 (Open 2024 = 0.90284)
SL = 0.90610
TP = 0.89090 (Open 2025 = 0.89004)
AUDCAD for Buys ?!On the 1-hour timeframe, we can easily identify an uptrend on AUDCAD with a break above the recent high confirming entries for buys. But if the market fails to do that, it will mean it is not yet ready for buys, and then sellers will take over the market. KEEP AN EYE ON THIS PAIR.
