AUDCAD Discretionary Analysis: Taking the Elevator DownIt’s more of a sixth sense(like when you just know the milk is bad before you smell it). I think it’s headed down, like an elevator with a broken cable . If I’m right, I’ll make some money. If I’m wrong, well… guess I’ll take the stairs next time.
Just my opinion, not financial advice.
CADAUD trade ideas

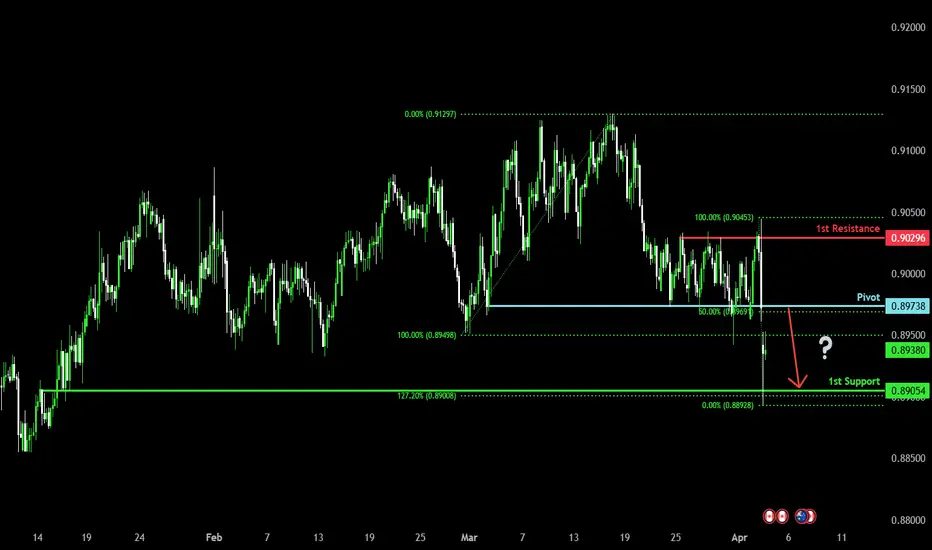
Bearish reversalAUD/CAD is rising towards the pivot which is a pullback resistance and could reverse to the 1st support which line sup with the 127.2% Fibonacci extension.
Pivot: 0.89738
1st Support: 0.89054
1st Resistance: 0.90296
Risk Warning:
Trading Forex and CFDs carries a high level of risk to your capital and you should only trade with money you can afford to lose. Trading Forex and CFDs may not be suitable for all investors, so please ensure that you fully understand the risks involved and seek independent advice if necessary.
Disclaimer:
The above opinions given constitute general market commentary, and do not constitute the opinion or advice of IC Markets or any form of personal or investment advice.
Any opinions, news, research, analyses, prices, other information, or links to third-party sites contained on this website are provided on an "as-is" basis, are intended only to be informative, is not an advice nor a recommendation, nor research, or a record of our trading prices, or an offer of, or solicitation for a transaction in any financial instrument and thus should not be treated as such. The information provided does not involve any specific investment objectives, financial situation and needs of any specific person who may receive it. Please be aware, that past performance is not a reliable indicator of future performance and/or results. Past Performance or Forward-looking scenarios based upon the reasonable beliefs of the third-party provider are not a guarantee of future performance. Actual results may differ materially from those anticipated in forward-looking or past performance statements. IC Markets makes no representation or warranty and assumes no liability as to the accuracy or completeness of the information provided, nor any loss arising from any investment based on a recommendation, forecast or any information supplied by any third-party.
AUDCAD ; BULLISH REVERSAL CONFIRMEDAUDCAD; may continue to sell this is after it breaks through the trendline
There a strong support zone around 1.89400
The price may pull back to the previous highs
Daily/H1/M15 , They all show buy confirmation

AUDCAD LONG/BUYBy utilizing Fibonacci retracement levels, historical patterns, , we can formulate a hypothesis that the market might follow a similar trajectory if bearish sentiment prevails.

AUD-CAD Will Go Down! Sell!
Hello,Traders!
AUD-CAD shot up sharply
But then horizontal resistance
Of 0.9035 and we are already
Seeing a bearish reaction so
We will be expecting a
Further move down
Sell!
Comment and subscribe to help us grow!
Check out other forecasts below too!
Disclosure: I am part of Trade Nation's Influencer program and receive a monthly fee for using their TradingView charts in my analysis.

AUD/CAD For Bullishyou can go long now
or
wait for pull-back near by entry point and then go long
general trend is up trend
have fun :)

AUDCAD FORECASTToday guys we have AUDCAD on watch and it is looking good as we are waiting for the lower timeframe confirmation to see if we can take that trade as an insurance entry. However we haven't to rush this, let's wait the market to come to our side before we capitalize on it!

AUDCAD SHORT Q2 W14 Y25 WED 2ND APRIL 2025AUDCAD SHORT Q2 W14 Y25 WED 2ND APRIL 2025
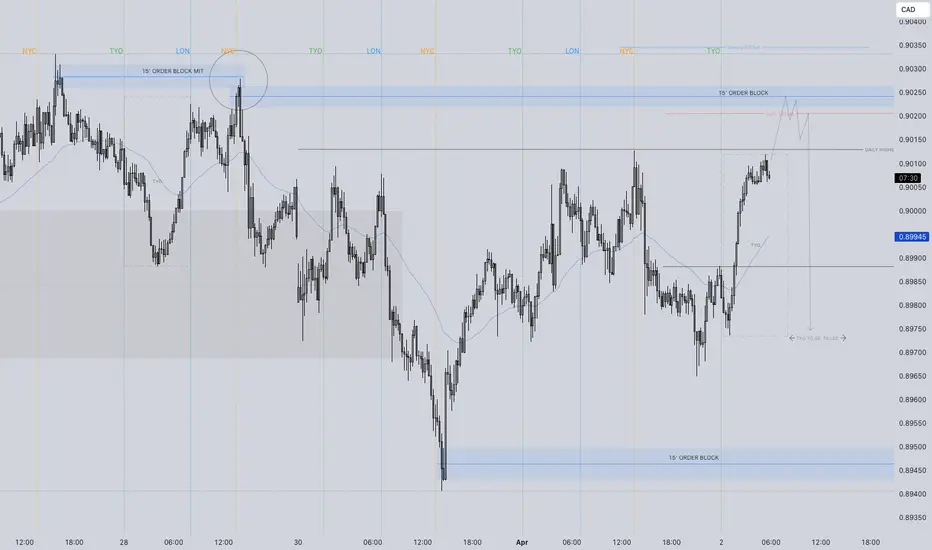
All the ingredients for a high probability short position. Weekly & daily 50 Exponential moving averages coming to join the short party. Higher time frame, namely the weekly time frame currently range with EMA beautifully in the middle of price action. That leaves from a deeper look into the lower time frames to see where the higher time frame EMA's line up.
I'll keep it snappy, what I require is price NOT to touch the Tokyo lows. This is added into the bag of FRGNT confluences. Price needs to trickle into the 15' just above the current Tokyo session. I need lower time frame breaks of structure to form post London open. A lower time frame order block to be created to short from. 5' Break of structure is what is I'd like to see.
Short and snappy short synopsis. I hope the photo paints the narrative better than I can explain it.
FRGNT X
AUDCAD Technical AnalysisOur analysis is based on multi-timeframe top-down analysis & fundamental analysis.
Based on our view the price will fall to the monthly level.
DISCLAIMER: This analysis can change anytime without notice and is only for assisting traders in making independent investment decisions. Please note that this is a prediction, and I have no reason to act on it, and neither should you.
Please support our analysis with a like or comment!
Let’s master the market together. Please share your thoughts and encourage us to do more by liking this idea.

buy position on AudCadkey levels are depicted on the chart and pair was bounced from its support level and trying to reach to its previous top
long position proposed here
stop and tp are specified on the chart and RRR >2
let see the result

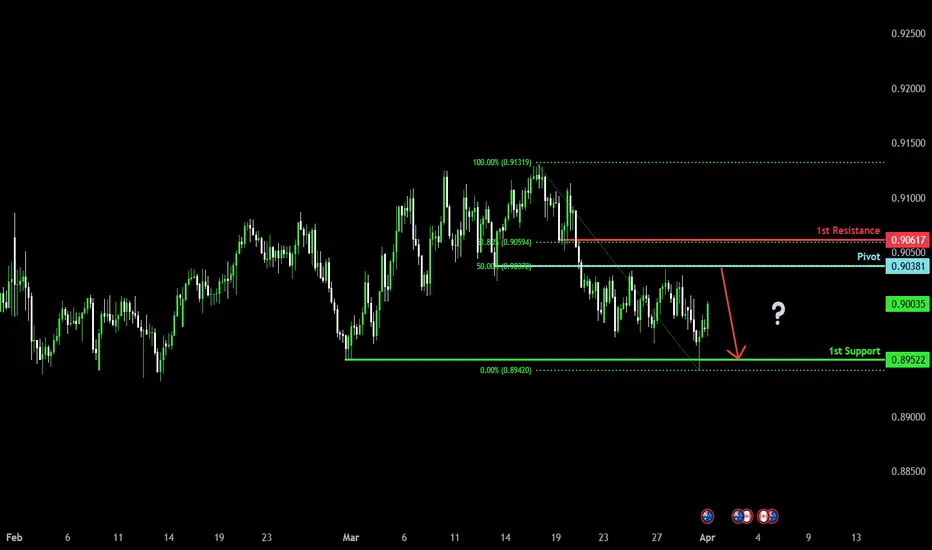
Bearish reversal?AUD/CAD is rising towards pivot and could reverse to the 1st support.
Pivot: 0.90381
1st Support: 0.89522
1st Resistance: 0.90617
Risk Warning:
Trading Forex and CFDs carries a high level of risk to your capital and you should only trade with money you can afford to lose. Trading Forex and CFDs may not be suitable for all investors, so please ensure that you fully understand the risks involved and seek independent advice if necessary.
Disclaimer:
The above opinions given constitute general market commentary, and do not constitute the opinion or advice of IC Markets or any form of personal or investment advice.
Any opinions, news, research, analyses, prices, other information, or links to third-party sites contained on this website are provided on an "as-is" basis, are intended only to be informative, is not an advice nor a recommendation, nor research, or a record of our trading prices, or an offer of, or solicitation for a transaction in any financial instrument and thus should not be treated as such. The information provided does not involve any specific investment objectives, financial situation and needs of any specific person who may receive it. Please be aware, that past performance is not a reliable indicator of future performance and/or results. Past Performance or Forward-looking scenarios based upon the reasonable beliefs of the third-party provider are not a guarantee of future performance. Actual results may differ materially from those anticipated in forward-looking or past performance statements. IC Markets makes no representation or warranty and assumes no liability as to the accuracy or completeness of the information provided, nor any loss arising from any investment based on a recommendation, forecast or any information supplied by any third-party.
AUD/CAD Trendline Break – Short Opportunity!AUD/CAD breaks below the ascending trendline! A bearish move may be in play. 🚨
📊 Entry: 0.90433 | SL: 0.90918 | TP: 0.89758 🎯
🔥 The uptrend support is broken! If the price confirms below, further downside is likely. Are you shorting this setup? 👇

#AUDCAD: 548+ Pips Selling Opportunity! Comment Your Views? OANDA:AUDCAD
We have a good selling opportunity coming up and this can worth up to 548 pips. We estimate trade to get activated within next week or so since we have NFP next week. We recommend all of you to use proper risk management. Good luck and have great weekend.

AUDCAD KEY LEVELS TO WATCH 121 BULLISH Hello traders, I hope you’ve had a fantastic trading week!
This week we’ve been closely monitoring AUDCAD, and the market continues to offer a high-probability bullish setup, especially when we zoom out and line up our multi-timeframe structure.
🟩 Daily Chart – 1:1 Symmetry & Bullish Pattern
As we can see on the daily timeframe, price respected the prior harmonic rhythm and completed a perfect 1:1 AB=CD structure at 0.89665.
This symmetry lands exactly on a rising trendline from earlier this year and has already sparked a minor bullish reaction.
XA = CD symmetry confirms harmonic balance.
The entry level is 0.90085, with a stop below 0.89647.
The price is now testing the structure from above — a sign of healthy re-accumulation.
🌀 4H Chart – Cypher Completion Holding
On the 4H chart, the potential Cypher pattern has completed and so far held well. The CD leg dropped into the ideal PRZ and bounced, giving us a confluence with the 1D symmetry pattern.
We’re monitoring a potential long trigger above 0.89916.
This is a spot where bulls have to prove themselves — above the entry we may see momentum pick up again.
📊 1H Chart – Rectangle Channel Still Intact
Dropping to the 1H view, AUDCAD continues to trade within a well-defined rectangle channel.
We're yet to see a strong breakout from the 0.90292 upper level, but the tight consolidation just beneath it tells us accumulation might be in play.
✅ Conclusion
Bullish structure remains valid from the daily down to the hourly view.
We're now watching for volume and confirmation above 0.90085 and 0.90292 to open the gate for upside targets:
38%: 0.90716
62%: 0.91355
78%: 0.91835
Until then — we stay patient, protect risk, and let the structure mature.

AUDCAD Trading Opportunity! BUY!
My dear subscribers,
My technical analysis for AUDCAD is below:
The price is coiling around a solid key level - 0.9004
Bias - Bullish
Technical Indicators: Pivot Points Low anticipates a potential price reversal.
Super trend shows a clear buy, giving a perfect indicators' convergence.
Goal - 0.9043
My Stop Loss - 0.8981
About Used Indicators:
By the very nature of the supertrend indicator, it offers firm support and resistance levels for traders to enter and exit trades. Additionally, it also provides signals for setting stop losses
Disclosure: I am part of Trade Nation's Influencer program and receive a monthly fee for using their TradingView charts in my analysis.
———————————
WISH YOU ALL LUCK

AUD/CAD Short🔍 Technical Context:
Market Structure:
Price is in a long-term sideways range with lower highs. AUD/CAD is struggling to break above the 0.90–0.91 region, showing signs of exhaustion.
Zone of Interest (Supply):
Purple box: 0.9000 – 0.9100
A clean historical rejection zone that has acted as both support and resistance multiple times since 2022.
Entry Type:
Sell Limit @ 0.9070 placed slightly below the top of the resistance zone to increase likelihood of getting triggered on a spike.
Stop Loss:
0.9175 – above multiple wick rejections and key structure highs. Allows breathing room for volatility without compromising the structure.
Take Profit Targets:
TP1: 0.8650 (conservative target at strong support)
TP2 (optional extension): 0.8500 (major long-term range low)
Risk-Reward Ratio:
~1:3 minimum to TP1, potentially 1:4+ if extended to 0.8500.
🧠 Strategic Notes:
Trigger Conditions:
Wait for a retrace to the 0.9070 zone rather than enter at market open. This is based on the idea that a final upward effort could grab liquidity and fill your limit.
Monthly Candle Watch:
Monday is month-end. Monitor the monthly close to determine if the structure still supports the trade idea. If the close is strongly bullish and you’re triggered early, be open to closing the trade early to avoid deeper drawdown.
Why It’s High Probability:
Multi-year horizontal structure
Repeated failure to hold above 0.90
Candlestick wicks rejecting the same zone
Fundamentals slightly favor CAD over AUD (higher real yields, oil correlation)
Defined invalidation point and asymmetric reward

AUDCAD RE. CHANNEL AND KEY LEVELS Hello awesome traders i hope you have had a great trading week, let's have a look at the AUDCAD presenting a great trading opportunity.
Price is breaking above the trendline breakout at 0.90931, signaling a potential bullish continuation.
📈 Trade Setup:
✅ Breakout Level: 0.90931 (Key resistance turned support)
🎯 First Target: 0.91732 (Mid-range resistance)
🎯 Second Target: 0.92816 (Upper resistance)
❌ Stop Loss: Below mid-support at 0.90122
🧐 Key Observations:
🔹 The breakout needs sustained momentum for confirmation.
🔹 A pullback to retest 0.90931 could provide a better entry.
🔹 If price fails to hold above 0.90931, a dip back to 0.90122 is possible.
📊 Market Sentiment:
📌 Monitor volume and momentum at the breakout zone.
📌 If buyers hold above 0.90931, it strengthens the bullish outlook.
🔥 Keep an eye on price action for confirmation before scaling in! 🔥
Have an amazing weekend, trade safe and may the pip be with you !!

AUD/CAD – Potential Bullish Reversal from Key Support📊 Chart Analysis
1️⃣ Accumulation Zone : The price previously traded within a rectangular consolidation range before breaking down.
2️⃣ Bullish Reversal Pattern : A falling wedge has formed, indicating a possible breakout to the upside.
3️⃣ Key Support : The price has tested the 0.8980 - 0.8970 zone multiple times and is showing signs of rejection.
4️⃣ Potential Upside : A breakout above 0.9030 - 0.9050 could confirm further bullish momentum.
🚀 Trading Plan:
📌 Entry : On a breakout above 0.9025
🎯 Targets :
First target : 0.9100
Extended target : 0.9130
🛑 Stop Loss : Below 0.8965 to minimize risk.
🔔 Confirmation Needed: Wait for strong bullish price action before entering long trades. 🚀🔥

AUDCAD LONG Rebound AUDCAD Rebound towards the 61.8% fibbonacci level, moreover we have Bullish divergence on MACD and RSI.

AUD/CAD NEXT MOVESell after bearish candle stick pattern, buy after bullish candle stick pattern....
Best bullish pattern , engulfing candle or green hammer
Best bearish pattern , engulfing candle or red shooting star
NOTE: IF YOU CAN'T SEE ANY OF TOP PATTERN IN THE ZONE DO NOT ENTER
Stop lost before pattern
R/R %1/%3
Trade in 5 Min Timeframe, use signals for scalping

DCF: AUD-3 vs CAD+7Today, I’ve spotted a shorting opportunity on AUDCAD!
DCF: Capital flow favors the Canadian dollar (+7) over the Australian dollar (-3).
On the daily chart, the new downward move (Leg 1) signals the start of a fresh trend.
Currently, the price is making its third reaction from the low, aligning with lower TF supply zones and the cyclical resistance line. The fourth time unit must form a red bar; otherwise, it suggests that the downward momentum is weakening, as reactions typically last only 1–3 time units before continuing.
Ideally, identifying a Bull Trap—a bearish liquidity pattern—would serve as strong confirmation to add extra short positions.

AUDCAD PRINTING REVERSALTechnically:
AUDCAD printing bullish divergence
AUDCAD reverse from strong support zone

