Amd Break Above $104 Long To The MoonI Know A lot of people Dont Like AMD lol But it Might Just Be there< Ready To Breakout!!!
Earnings And If Spy Holds and runs This Forcast Is Very Well in The Books for it
📈 AlphaPulse Multi-Timeframe Forecast: NASDAQ:AMD
📍 Current Price: $100.59
🔍 Active Patterns: True S/R Zone, Channel Upside Breakout, Overbought Channel Position
🔀 Recent Crosses: Bullish 8/21 EMA Cross
🌐 Market Structure:
• Primary Trend: Mixed/Slightly Bearish
• Trading Bias: Bullish (49.2% confidence)
• Ideal Timeframe: weekly (Strength: 8)
🎯 Bullish Price Targets:
• Conservative: $113.15 (+12.48%)
• Primary Target: $125.70 (+24.97%)
• Aggressive: $138.26 (+37.45%)
• Expected Duration: 2-4 weeks
📊 Technical Position:
• Weekly: Consolidation
• Daily: Bearish Consolidation
• Intraday: Range Bound
🔑 Key Levels:
• Strong Support: $98.80
• Strong Resistance: $101.72
• Risk/Reward Ratio: 1:0.6
📈 Current Market Action:
• Weekly: Strong Downward Movement (-19.3%)
• Daily: Strong Upward Movement (+20.3%)
• 5min: Strong Upward Movement (+20.3%)
⚠️ Signal strength: 49.2% - 1 historical patterns analyzed
Safe Trades As Always
AMD trade ideas

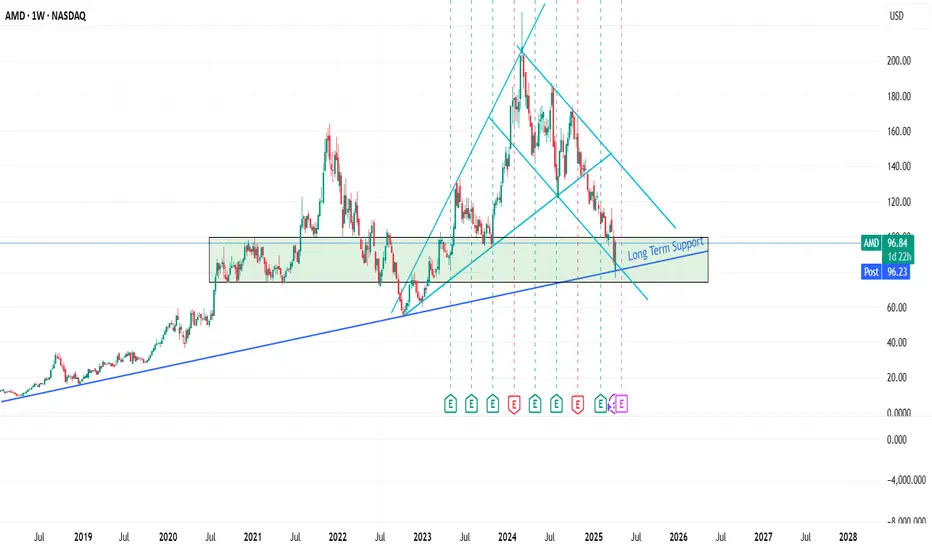
AMD Key Long-term LevelsThese are key Long-term Levels for AMD.
Currently it is reacting positively at the key support zone of 80 to 90.
Considering the earnings release date is on 6th May 2025, monitoring the price action post earnings need to be observed. Any positive impact could possibly push the price higher.
The next key Target in the medium-term is around 120 to 130 Level.
Disclaimer:
This chart is for educational purposes only and does not constitute financial advice.

Leap for AMD to the upside?OptionsMastery:
🔉Sound on!🔉
📣Make sure to watch fullscreen!📣
Thank you as always for watching my videos. I hope that you learned something very educational! Please feel free to like, share, and comment on this post. Remember only risk what you are willing to lose. Trading is very risky but it can change your life!

Analysis and Implications of AMD Fluctuations & Crab PatternIn the previous idea, we moved along with the buyers and progressed up to a price of $227.
Then, with the crab pattern, the decline in Micro stock began, and this drop is expected to continue down to $52. Afterward, we will once again align with the buyers through the crab pattern.

AMD Longadvanced money destroyer? Long idea.
Good luck to all in these market conditions. Hopefully this is a very good idea like the ones we published previously that have been removed

AMD Earnings About To PrintTechnical Analysis NASDAQ:AMD
RSI: 🟡 Near overbought but showing strength
MACD: 🟢 Bullish crossover in progress
Support: $96.84 → $93.64 → $90.00
Resistance: $100.75 → $101.72 → $103.96
Key Level to Watch: $100.75 (immediate resistance)
💰 Earnings Play
🎯 Trade Signal: BUY
✅ Justification
Recent uptrend confirmed by bullish MACD crossover with price action above key short-term MAs. Strong momentum heading into earnings with positive sentiment from analysts.
⚠️ Risk Management
Stop Loss: $93.64 (-5.2%)
Expected Range: $93.64 to $103.96
Best AI Generated Signals.
Stay Alpha

AMD BULLISH MAY6TH 2025AMD has its earnings today & I am bullish as per the price action. I have managed my risk, and I am long irrespective of any news. I have discussed in depth analysis of AMD. If you have any questions, feel free to leave a comment below.
NOTE: I AM LONG ONLY WITH STOCKS

$AMD - Back above support, Daily & Weekly MACD Pressing HigherWe have 1Day and Weekly MACD's applying upward pressure now. Monthly timeframe is also fully reset. AMD is now back in above key support. Accumulate quickly.

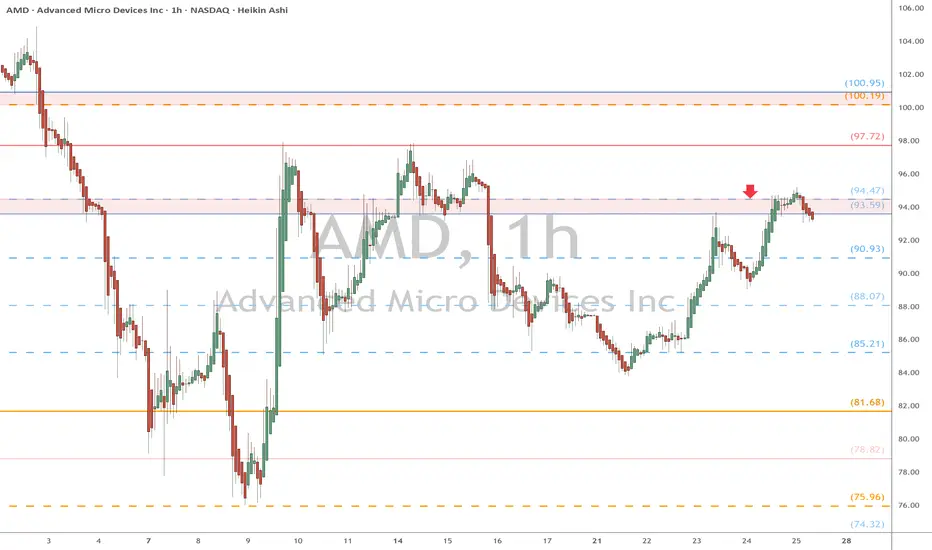
AMD watch $93.59-94.47: Key resistance to Tariff Recovery wave AMD trying to recover along with the general chip sector.
Currently testing a key resistance zone at $93.59-94.47
Pullback from here expectable, Break would show strength.
AMD: Potential Mid-Term Reversal from Macro SupportPrice has reached ideal macro support zone: 90-70 within proper proportion and structure for at least a first wave correction to be finished.
Weekly
As long as price is holding above this week lows, odds to me are moving towards continuation of the uptrend in coming weeks (and even years).
1h timeframe:
Thank you for attention and best of luck to your trading!

AMD HUGE LONG AMD has a huge level around $180 that is begging to be tested. We are at major support on the yearly. I expect a huge move in AMD in the coming weeks to the upside.
AMD to Retest SupportAMD has been in a descending price channel since November of 2024 with clear support and resistance established. On Monday we saw an attempt to breakout however it was rejected at the establish resistance line. Given the rejection and the significant drop that followed I think we will likely see AMD drop to slightly below $80 in the short term and retest the established support line.

AMD Weekly Options Trade Plan 2025-05-06AMD Weekly Analysis Summary (2025-05-06)
Summary of Each Model’s Key Points
Grok/xAI Report
Technicals (5-min & daily): Bullish momentum (price above EMAs, positive MACD, RSI not yet overbought) Sentiment: VIX moderate, upcoming earnings adds uncertainty, max pain at $98 Directional Bias: Moderately bullish Trade: Buy $100 call expiring 2025-05-09 at $3.80 Profit Target: +25%; Stop-Loss: −50% Confidence: 65%
Claude/Anthropic Report
Technicals: Intraday slightly bearish, daily bullish Sentiment: Earnings risk, mixed signals, max pain at $98 Directional Bias: Neutral/unclear Trade: No trade (90% confidence)
DeepSeek Report
Technicals: Short-term bullish but near resistance, daily MACD bullish Sentiment: Elevated IV, earnings event risk, max pain at $98 Directional Bias: Neutral/unclear (55% confidence) Trade: No trade
Llama/Meta Report
Technicals: Moderately bullish across timeframes (price above key EMAs, positive MACD) Sentiment: Earnings caution, max pain at $98 may cap downside, premium high Directional Bias: Moderately bullish Trade: Buy $109 call expiring 2025-05-09 at $1.00 Confidence: 70%
Gemini/Google Report
Technicals: Strong daily bullish, 5-min approaching resistance Sentiment: Muted post-earnings move, max pain at $98, high IV Directional Bias: Neutral/unclear Trade: No trade (confidence <60%) Areas of Agreement and Disagreement
Agreement
Mixed signals between intraday and daily timeframes Elevated implied volatility around earnings Max pain at $98 may exert gravitational pull High open interest in both deep OTM puts ($90) and calls ($105–$110) Majority of models favor waiting until after earnings or see no clear edge
Disagreement
Grok and Llama see a moderately bullish setup and recommend buying calls ($100 and $109 strikes) Claude, DeepSeek, and Gemini advise no trade because of earnings event risk, mixed technicals, and expensive premiums Conclusion
Overall Market Direction Consensus: Neutral/Unclear Recommended Trade: None – conflicting signals, earnings overhang, and rich weekly premiums make a high-confidence single-leg trade unlikely before post-earnings clarity.
Entry Timing: N/A (no trade) Confidence Level: 90% in the decision to sit out this week’s expiration Key Risks and Considerations:
Earnings announcement can cause large gap moves Weekly options premiums remain elevated, requiring outsized moves to break even Max pain at $98 may pressure price if post-earnings reaction is muted or negative
TRADE_DETAILS (JSON Format)
{ "instrument": null, "direction": null, "strike": null, "expiry": null, "confidence": null, "profit_target": null, "stop_loss": null, "size": null, "entry_price": null, "entry_timing": null, "signal_publish_time": "2025-05-06 15:09:34 UTC-04:00" }
Disclaimer: This newsletter is not trading or investment advice but for general informational purposes only. This newsletter represents my personal opinions based on proprietary research which I am sharing publicly as my personal blog. Futures, stocks, and options trading of any kind involves a lot of risk. No guarantee of any profit whatsoever is made. In fact, you may lose everything you have. So be very careful. I guarantee no profit whatsoever, You assume the entire cost and risk of any trading or investing activities you choose to undertake. You are solely responsible for making your own investment decisions. Owners/authors of this newsletter, its representatives, its principals, its moderators, and its members, are NOT registered as securities broker-dealers or investment advisors either with the U.S. Securities and Exchange Commission, CFTC, or with any other securities/regulatory authority. Consult with a registered investment advisor, broker-dealer, and/or financial advisor. By reading and using this newsletter or any of my publications, you are agreeing to these terms. Any screenshots used here are courtesy of TradingView. I am just an end user with no affiliations with them. Information and quotes shared in this blog can be 100% wrong. Markets are risky and can go to 0 at any time. Furthermore, you will not share or copy any content in this blog as it is the authors' IP. By reading this blog, you accept these terms of conditions and acknowledge I am sharing this blog as my personal trading journal, nothing more.

$AMD - A Larger Correction Has Begun...NASDAQ:AMD - Breaking the trend channel's lower boundary is additional confirmation the five-wave advance has peaked and a larger correction is underway. Upcoming rallies will probably be B-wave phonies.
Looking for more pain this year before secular bull trend resumes.


AMD Weekly Options Trade Plan 2025-04-16NASDAQ:AMD AMD Weekly Analysis Summary (2025-04-16)
Below is a synthesis of all the reports and our analysis:
─────────────────────────────
COMPREHENSIVE SUMMARY OF EACH MODEL’S KEY POINTS
─────────────────────────────
• Grok/xAI Report
– Technical indicators show AMD trading below its short‐term moving average and near the lower Bollinger Band.
– Negative MACD histogram and bearish news (export restrictions, potential $800M charge) support a downward bias.
– Recommends a bearish options trade using a near–ATM put – the $89 put at a premium around $1.78 (a higher premium but with a clear bearish thesis).
• Llama/Meta and DeepSeek Reports
– Confirm the bearish bias: price action below key moving averages, negative MACD and extreme moves below support.
– Note that the option chain (and high open interest on lower strikes) points to a greater probability for further decline.
– Both suggest a trade on put options that have a lower premium than the Grok suggestion (with DeepSeek favoring the $85 put at roughly $0.62) for improved risk/reward.
• Gemini/Google Report
– Emphasizes the strong negative catalyst from news and a rapid breakdown below support levels (with current price near $89).
– Technical indicators and volatility (VIX above 30) signal that the underlying is likely to fall further.
– Offers several put strike ideas and finds that the $84 put (premium ca. $0.49) fits the ideal price range; however, liquidity and open interest are better for the $85 strike.
─────────────────────────────
AREAS OF AGREEMENT AND DISAGREEMENT
─────────────────────────────
Agreements:
– All models (except for the one reporting an error) agree that the market sentiment is bearish.
– The negative news catalyst (export controls and potential charges) and the technical breakdown clearly drive the consensus.
– There is broad recognition that options data (with high OI on puts and max pain around $95)
is supportive of a downside move.
Disagreements:
– The primary difference is in the strike selection. Grok favors a put close to the current price (the $89 put) despite its higher premium, while Gemini, Llama/Meta, and DeepSeek lean toward lower strikes ($84–$85) that offer a lower premium (falling in or near our ideal range) and better liquidity for a weekly trade.
─────────────────────────────
CLEAR CONCLUSION & RECOMMENDED TRADE
─────────────────────────────
Overall Market Direction Consensus:
– The overall view is bearish. All models (apart from the one error) indicate that AMD is under significant downside pressure fueled by both technical breakdown and negative news sentiment.
Recommended Trade:
• Trade Type: BUY single‐leg, naked PUT (weekly option only)
• Chosen Strike: $85
– Rationale: The $85 put (ask at $0.64) offers good liquidity (high open interest of 10,218 contracts) and although its premium is slightly above the preferred $0.30–$0.60 range, its risk/reward profile is attractive given the bearish momentum.
• Expiration: April 17, 2025 (weekly options)
• Entry Timing: At market open
• Proposed Parameters:
– Entry Premium: Approximately $0.64
– Profit Target: Around $1.00 (this represents an attractive move if the bearish trend continues)
– Stop Loss: Approximately $0.45 to limit risk if price recovers unexpectedly
• Confidence Level: ~70%
• Key Risks and Considerations:
– Short‐term volatility may create intraday bounces despite the overall bearish trend.
– An oversold reaction or a temporary return toward the max pain level ($95) could adversely affect the trade.
– As this is a news–driven and highly volatile environment, trade size must be limited relative to account size.
─────────────────────────────
TRADE_DETAILS
─────────────────────────────
The final trade parameters in JSON format are shown below.
TRADE_DETAILS (JSON Format)
{
"instrument": "AMD",
"direction": "
put",
"strike": 85.0,
"expiry": "2025-04-17",
"confidence": 0.70,
"profit_target": 1.00,
"stop_loss": 0.45,
"size": 1,
"entry_price": 0.64,
"entry_timing": "open"
}

3rd time trying to make some of my LOSS AMDSpotted an inside bar accompanied by high volume—promising setup. Hopefully, the recent tariff chaos doesn’t derail this trade. Based on the current technicals, it looks like there's a solid probability of success. Let’s see how it plays out. (Not financial advice)
Why AMD Might Be a Good Buy:
Advanced Micro Devices (AMD) continues to strengthen its position in the semiconductor industry, especially in high-performance computing, gaming, and AI. With growing demand for AI-driven infrastructure and chips, AMD’s recent product releases and partnerships put it in a competitive position against giants like NVIDIA and Intel. Their strong balance sheet, innovation pipeline, and increasing adoption of EPYC processors in data centers make it a stock worth watching. For traders and investors looking for exposure to the tech and AI boom, AMD could offer both growth potential and strategic value in a diversified portfolio.

sniper dip entry! AMD bears get squeezed.boost and follow for more 🔥 AMD is having a massive bounce from trend support zone, now at its make or break level, if we can break look for continuation back to 100-120 levels short term.
I bought the dip on AMD at 78 yesterday and think we can higher.. see you soon with more charts GLTA!

AMD Wave Analysis – 10 April 2025
- AMD reversed from resistance zone
- Likely to fall to support level 80.00
AMD today recently reversed down from the resistance zone between the resistance level 95.40 (former support from the start of March, as can be seen below) and the 50% Fibonacci correction of the downer impulse wave from iii from last month.
The downward reversal from this resistance zone stopped the earlier short term correction ii.
Given the strong daily downtrend, AMD can be expected to fall to the next round support level 80.00, which stopped the earlier impulse wave (iii).


AMD: Best level to buy since Oct 2022.Advanced Micro Devices are virtually oversold on the 1W technical outlook (RSI = 30.639, MACD = -13.430, ADX = 36.312) having hit the bottom (HL) of the 3 year Channel Up. The 1W RSI is slightly even lower it was on the previous bottom of October 10th 2022. This should be the start of the new long term bullish wave, which based on the previous one should make a HH on the 1.236 Fibonacci extension, approximately a +300% rally (TP = 280.00).
See how our prior idea has worked out:
## If you like our free content follow our profile to get more daily ideas. ##
## Comments and likes are greatly appreciated. ##

AMD - Perfect bounce along the long term supportAMD - Perfect bounce along the long term support. If this support breaks, $55 is next buying point.
Amd - The One And Only Setup For 2025!Amd ( NASDAQ:AMD ) shifts to a very bullish market:
Click chart above to see the detailed analysis👆🏻
Perfectly following previous cycles, Amd corrected about -60% over the past couple of months. However now we are seeing some first bullish signs at a major confluence of support. If we actually also witness bullish confirmation, an incredible rally of about +200% could follow.
Levels to watch: $100, $300
Keep your long term vision,
Philip (BasicTrading)
