AMD is looking spicy here!! boost and follow for more ❤️🔥
I'm loving AMD for a long here at cluster support, a rally higher to 130 trend resistance zone is very likely in my opinion..
if we clear trend resistance its clear skies to 150-175 pivot levels 🎯 the RSI is also showing oversold levels we haven't seen in a long time.
lets see what happens.. I'm personally taking a long on AMD today.. 👀
side note, sorry for not posting in months, I've been going through some stuff in my life. But im trying to get back into my trading again. So no more long breaks from vibe. ill see you all early next week with some more ideas 👻⚡
AMD trade ideas

AMD (NASDAQ: AMD) Key Breakout Levels to WatchAMD is forming a potential ascending triangle pattern on the daily chart, signaling a possible breakout if momentum continues.
🔍 Key Levels to Watch:
✅ Support Zone: The stock needs to hold above the $108-$109 range for the bullish setup to remain intact.
✅ Breakout Level: A push above $114 could confirm upside continuation.
✅ Target Levels: If AMD breaks out, we could see a move toward $117-$120.50 in the near term.
The yellow 20-day WMA and SuperTrend resistance are key hurdles. A strong close above them would confirm a shift in momentum.
💬 What’s your outlook on AMD? Do you think it can break out, or will it face resistance? Drop your thoughts below! 👇

AMD Earning Trade setupAMD Earnings came very positive, volatility pushed the stock down, expected to bounce from that level of 108, TP at the supply zone 119

$AMD Analysis: Profitable Structure! 2/13/2025
Another profitable structure is currently in progress, after completing the last leg of the correction at $106.50 (MY STOPLOSS!)
The targets of the uptrend swing (wave C) are displayed on the chart, and it has the potential to exceed the projected levels.
Start point of wave c= $106.50 (Stoploss)
Targets:
T1=$206
T2=$268
T3=$367
NASDAQ:AMD #AMD
Good Luck

AMD: Long-Term Structure For ResearchSince my line of work focuses on understanding and connecting scalable complexities, I require an interactive representation of the long-term market structure of an idea I published a while ago. These ideas will serve as a foundation for developing a probabilistic framework that accurately captures the underlying patterns and relationships governing price movements over time. And the only way to do that is through looking back how price reacts to those levels on the in the future. I'll use this research to enhance an indicator that would automatically output these levels based on historic price action before publishing it in pinescript.
Source:
Why I keep posting these unconventional analyses?
I have a responsibility to those who follow my work, and I take that seriously. My goal is not just to share insights but to equip you with the knowledge and tools necessary to understand price dynamics at a deeper level — so you are never dependent on traditional technical analysts who share signals without worrying about potential negative impact. Many traders fall into the trap of relying on signals or surface-level analysis, only to find themselves caught in losing in the long-term. The harsh reality is that 90% of market participants fail — not due to bad luck, but because they adopt the same conventional strategies as the herd. You can't beat the market if you use same methods as majority operates on. Institutions using advanced trading algorithms are fully aware of the majority’s thinking patterns. They exploit predictable retail behavior, reacting to conventional technical analysis signals before the crowd does. This gives them a strategic edge, allowing them to absorb liquidity, trigger stop hunts, and manipulate price movements in ways most traders fail to anticipate. Blindly following common strategies ensures playing into their hands, reinforcing the cycle of retail losses.

Strength on AMD stockAfter almost a year of down move, on February 5th 2025 a huge professional buying took place on Advanced Micro Devices Inc. stock (Ticker NASDAQ: AMD). Even though we've seen professional buying on that move before, the volume there was much lower and, as a result, caused small retracements up only. The volume on the February 5th daily bar has much bigger potential. Moreover, a few things are adding to the strength:
- Recent buying appeared on the market opening after the earnings report with an immediate price rise.
- The price returned into the area of big volume (blue rectangle) on relatively low volume, showing no professional interest in the downside (testing).
Therefore, if no supply reappears below or around the $116.37 level, we may see a rally towards $150.37 - $153.03 and even higher to $166.10 - $167.08 zone.
In case supply hits the market in the mentioned area, another professional buying could take place around $95.61.

$AMD - Well?NASDAQ:AMD looks like it is about to do something! 😂 How is that for a great technical analysis? You didn't see that coming did you.
Anyways, I believe we could see a potential rise to $129 area.

$AMD - $115+Hey guys,
My AI model for AMD has been pointing out to buy AMD on around the 28'th of Jan. I did a few purchases for $115 calls as suggested. Its still suggesting to buy AMD even at these levels.
Here's what my model is showing.
imgur.com

AMD 3 week outlookOutlook based entirely on technical analysis.
Ideal bearish entry within yellow projection.


What do you guys think about AMD next week?NASDAQ:AMD
This poor company has been caught in a Daily downtrend for months now! Currently we are approaching some areas I believe may be key. The 125.00 round number acted as a key area of resistance on multiple occasions. Using Fibs from the most recent leg down I was able to project a 2 deviation projection from the balance point at 0.50. This balance area also acted a key area of support in the previous triple bottom. We know levels of support when broken turn to resistance. This area is indicated by the 115.00 level on the chart.
I will keep my eyes put on signs of another leg down at the 0.50 and 0.618 level for a move to test 100.00. This area should act the most critical level because AMD has shown to show this is a very key psychological price target. It will be key to watch the SOX and other Semiconductor stocks next week. What do you guys think?

AMD: Buy ideaOn AMD, on a time unit of 4 hours, we are in a bearish channel situation and, on top of that, we are below the Vwap indicator. This configuration of the chart calls us to a high probability of an upward trend. This will be confirmed by the strong breakage of the resistance line and that of support by the buyers.

AMD more downside before bouncingAMD in moving down along its descending channel towards some old support zones that it can potentially bounce from, if the right context is there. Otherwise will probably go sideways. Fundamentals are strong. Definitely a good buy on a long run.

AMD is a buyHere's a chart of AMD showing a fib (anchors are circled). We are in a descending wedge and on the 61.8 of the retrace. We're also above a volume shelf. Looks poised to make a big move.

Possible more price drop on AMD in short termI don't know anything about AMD's financials...I am not interested...I am only trading...
It is very risky trade..
Not investment or trading advice.

AMD (ADVANCE MICRO DEVICES INC) BULISHAs you can see on the chart and drawing, AMD is showing bullish signals. The upper price levels are our take profit (TP) targets, while the lower levels will serve as correction points.
The danger zone and stop loss levels are crucial for deciding whether to stay in or exit this trade.
Note: My ideas are not intended for any type of scalping or scalpers!
You can find the full list of my ideas here: www.tradingview.com
Here are some of my ideas:

AMD'S TLs and Channel101 Basic trend lines and channels analysis. Red lines are still holding and green channel is holding thus far.

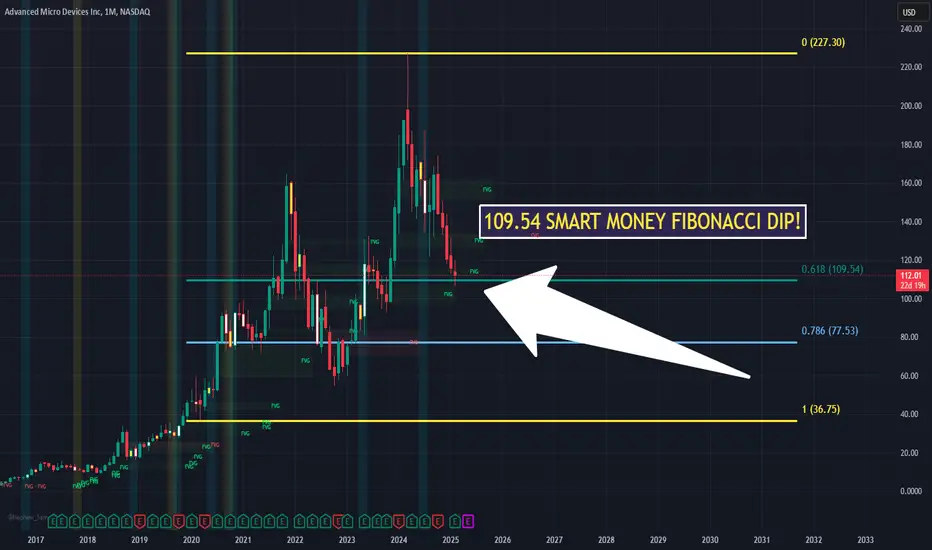
$AMD Fibonacci PyramidExecuted today got SHARES at 109 and SOLD the 100 Puts POPPED BACK TO 112 STARTED LIGHT!
I WAITED so long to get below 110 for this MONTHLY 618 Fibonacci to act like a MAGNET
NEXT I am looking leaps and will alert here just DROP A LIKE! LETS GET IT!

Negative energy in AMD - earningsI read the energy in stocks and the market with my dowsing. Short and sweet, last week I asked what might make a lot of money & to pay attention to & from a short list of stocks, I got AMD and the "crash" option.
I still have negative energy in it as of now & get to sell rallies. It may be down 16-20% over the next couple/few days. Or, I could be completely wrong, of course. We will see.

AMD 7.47RHigh probability trade idea.
I think there is a strong chance AMD is ready / almost ready for another major move up.
Stop loss is fairly wide on this one so the risk to reward ratio isn’t amazing, but I think the probability of the trade being successful makes up for that.
Trade rating 7.5/10
Probability 9/10
Risk to reward 6/10

AMD: A Once-in-a-Lifetime Opportunity!**🔥 AMD: A Once-in-a-Lifetime Opportunity!**
In pre-market, AMD briefly touched **$125** following earnings. You all know how this works—sooner or later, the algos will bring it back to that level. No hesitation, I’m **quadrupling my bet—going in MASSIVELY!** 🚀💰

Brief overview ahead of the $AMD earningsToday's NASDAQ:AMD earnings report, due after market close, promises to be intriguing
Historically, the movement after earnings over the last 10 years has averaged around +/-10.2%
Theoretically, NASDAQ:AMD could significantly benefit from the DeepSeek news, given that AMD has integrated the advanced DeepSeek-V3 model into its Instinct MI300X GPUs. However, this development has not yet been reflected in AMD's stock price
A drop in the stock price post-earnings could set up an interesting scenario. The bullish order block between $93-$102 on Chart 1 might offer a prime entry point for a bounce-back
Over the past five years, NASDAQ:AMD 's fundamental ratios shown in Chart 2 have generally looked solid. However, the current P/S ratio of 7.7 could ideally decrease a bit for better valuation
It's also worth noting that other chip stocks like NASDAQ:ASML and $RLCX saw positive movements post-earnings last week, though this doesn't guarantee a similar outcome for NASDAQ:AMD
