BEAM – 30-Min Long Trade Setup!📈 🟢
🔹 Asset: Beam Therapeutics Inc. (BEAM – NASDAQ)
🔹 Timeframe: 30-Min Chart
🔹 Setup Type: Ascending Triangle Breakout + Retest
📊 Trade Plan – Long Position
✅ Entry Zone: $17.00 (Breakout confirmation at triangle apex)
✅ Stop-Loss (SL): $15.75 (Below trendline + recent support)
🎯 Take Profit Tar
Key facts today

BEAM – 30-Min Short Trade Setup!📉
🔹 Ticker: BEAM (NASDAQ)
🔹 Setup: Rising Wedge Breakdown + Resistance Rejection
🔸 Breakdown Price: ~$18.48
📊 Trade Plan (Short Position)
✅ Entry Zone: $18.40–$18.55 (yellow zone rejection)
✅ Stop Loss (SL): Above $19.83 (white resistance zone)
✅ Take Profit Targets:
📌 TP1: $17.14 (red zone – mino

Long Trade Setup Breakdown for (BEAM) - 30!📊 Chart
🔹 Asset: Beam Therapeutics Inc. (BEAM)
🔹 Timeframe: 30-Min Chart
🔹 Setup Type: Symmetrical Triangle Breakout
🚀 Trade Plan (Long Position):
✅ Entry Zone: $32.40 (Breakout Confirmation)
✅ Stop-Loss (SL): $29.56 (Below Support)
🎯 Take Profit Targets (Long Trade):
📌 TP1: $35.64 (First Resistanc


Beam $BEAM Long In the case of Beam Therapeutics ( NASDAQ:BEAM ), the weekly chart displays a promising pattern characterized by a higher low, indicating a potential bottoming process in the stock's price movement. This higher low suggests a reversal of the previous downtrend and potentially signals a shift towards

Cathie Wood is long BEAM, But I will be Strong Short #CathieWood
Baught this stock...I analyzed it....and …...well....I would do exact the opposite......
But why?
Technical Analysis
Let forget eveything you know about technical analysis, and let together tell this story....logically..
At
76-71 USD AGGRESSIVE SELLERS FORCED THE PICE DOWN
29,72

March Gainers (BEAM, account up 1%)2nd gainer in March is BEAM . Holding period is 0 days (3/13/23-3/13/23). Account is up 1%.
This month till today, my account is up 2%
My trading method is mostly short term and is independent of market swings.
Will keep updating on my trades.

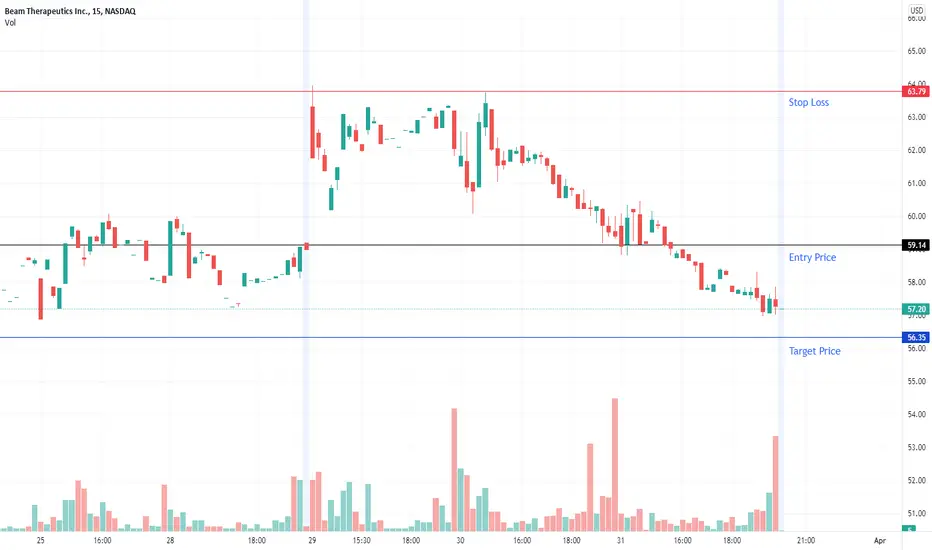
1/4/2022 NASDAQ (BEAM)Short (Entry Price) below the black line and exit (Stop Loss) above the red line. Can take profit at the suggested Target Price.
Entry Price: $59.14
Target Price: $56.35
Stop Loss: $63.79
28/3/2022 NASDAQ (BEAM)Short (Entry Price) below the black line and exit (Stop Loss) above the red line. Can take profit at the suggested Target Price.
Entry Price: $57.83
Target Price: $55.93
Stop Loss: $61.00

24/3/2022 NASDAQ (BEAM)Short (Entry Price) below the black line and exit (Stop Loss) above the red line. Can take profit at the suggested Target Price.
Entry Price: $59.01
Target Price: $57.11
Stop Loss: $62.22

See all ideas
Displays a symbol's price movements over previous years to identify recurring trends.