IBM Long DailyIBM reports on JAN 21. The stock is now
breaking out after being heavily sold
I am waiting to add to the position however until the chickou line
breaks through the cloud. This is a weak buy yet from a Ichimoku
perspective however I have traded Ibm alot and have seen how
it runs up or down going into earnings
IBM trade ideas

IBM - Continuance of Down TrendIBM has continued testing and bouncing off the down trend resistance line. Past two attempts saw drops back down to what's now the bottom Bollinger band at around 172-173. IBM has under performed its sector for several months now, and has seen extended negative correlation with NDXT as it continues making higher highs.


IBM to Go down ! Reverse from an important resistance , down trend top and a doji candle and a barrel to confirm it with high Short volume and high put option volume IBM NovWk5 185 Put 1.85 1.79 1.87 1,193
Good luck !

IBM 186 target, trendy movingIdeal sell limit from 87,58 fibo, but in the event of positive statistics, the breakdown of resist and possible movement towards 194

IBM - Downtrend Channel - Watch Price Bounce - In AccumulationIBM - Downtrend Channel - Watch Price Bounce In Accumulation

IBM...been beatenSorry gents... know it's after the fact but not a stock I normally trade so haven't followed it.
Nice to know and see .....what comes up has to come down:
BM
Music at work: www.youtube.com

IBM fallsIBM just announced that their sales have dropped for the 6th straight quarter. Obviously this does not bode well for the stock in the short term. In fact, they have been in a steady downtrend for the majority of 2013. I don't see any reason that this should change any time soon.


IBM on the verge of a massive breakdown.IBM has shown poor relative strength, and is now close to breaking a long term up-trendline.


IBM - Testing 100 day MA, Bearish candle Target 181.46Despite beating on earnings, IBM missed revenue targets last week
Bearish candle last week showing low demand
Look for a breakout below the 100 week MA for confirmation
Price targets shown on chart . First 181.46, then 168.31
Price far above 200 week SMA. Large potential downside or mean reversion

IBM WEEKLY SHORTIBM on the longer term is bullish
however it is loosing momentum and setting up for a
short. It needs to take out this fractal for the setup.
According to Bill Williams when price is below the Jaw balance line
it is easier for it to fall. This weeks candle looks ominous for the bulls.
Will sell call spreads above for safety rather than buying puts or debit spreads. It will also allow me to Condorize it with an Iron Condor to collect more credit

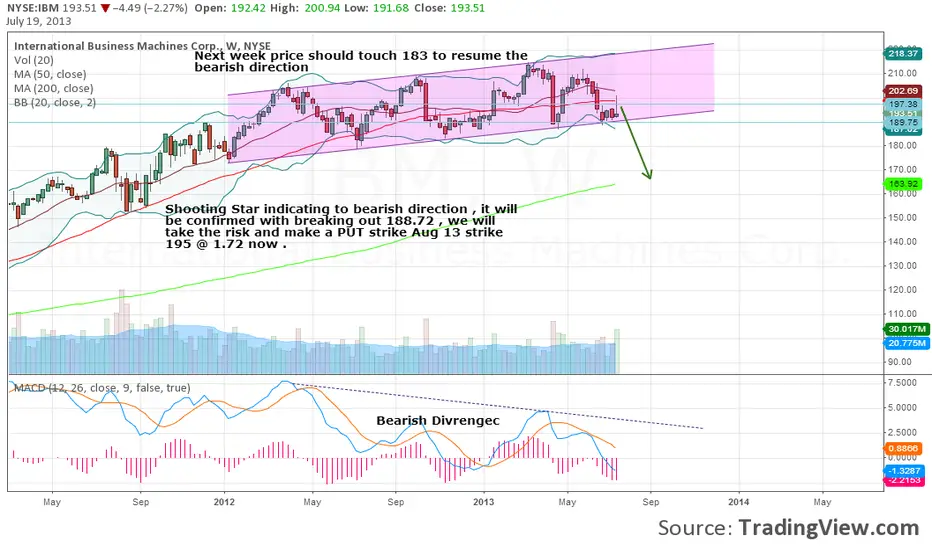
IBM DOWN !!! Shooting Star indicating to bearish direction , it will be confirmed with breaking out 188.72 , we will take the risk and make a PUT spread (Vertical) strike Aug 13 strike 195 @ 2 now .

IBMShowing relative weakness. All ma's are declining and the 21day is near. Something to watch. Could break up, but I'm thinking down.

IBM demand zone with pin barPin bar formation at a strong demand zone that was created by a strong move up. Pin bar at this level. Exit is at supply zone, where we see a strong change in momentum