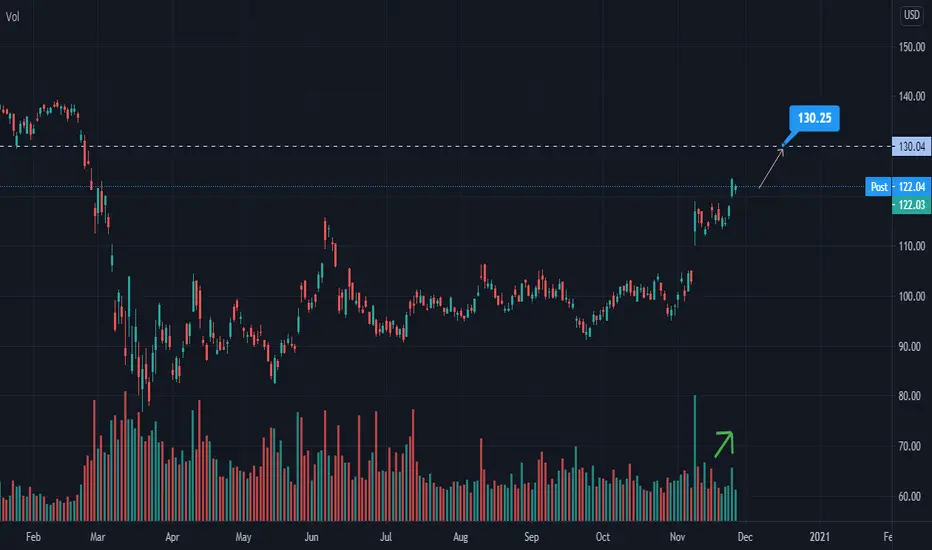
JPMORGAN ready to give a 15% bullish movementToday we will share a bullish analysis of JPM, explaining the major zones and the potential movements we can expect
Relevant items:
-The key area to pay attention to is the Resistance zone. We can see in the past what happened after the price broke it. We had an 18% bullish movement
-It's important to pay attention to the corrective structure formed on the edge of the resistance zone. Now we have the same situation at the same level
-The target we are choosing is a Double top pattern with the All-time high zone.
-We will define the RISK-FREE level at 130.5. This means that if the price reaches that zone, you should have your stop loss moved at the entry-level.
-Based on past behavior, this movement can take around 70 days.
JPM trade ideas

Possible bearish Gartley pattern on BATS:JPMBearish Gartley pattern, price is still bouncing from the last high point. With a tight stop-loss, it might be a good short occasion (I use a 5% error margin from the "ideal formation").
If the price crosses the stop-loss line, the formation is negated.

JPM LongJPM gapped up over the 115.77$ area then retested as support, it held nicely and is now forming a nice wedge pattern back up to 123.50$ resistance area. If it breaks 125$ and holds above 123.5$ as support it has room to run to 140$. I do not expect the government to allow JPM to fail anytime soon and I believe it will get back to pre-pandemic highs.

JPM Sell PossibilityHello Traders!
I see a couple reversal signals for JPM, a stock which has been on a bullish run.
Signs of continued Reversal :
#1 Hidden divergence signaling the recent downtrend may continue.
#2 Price action falling below both the VWAP and 50EMa
#3 Broke a key level moving downwards. I'd like to see it retest the recently broken key level before deciding to enter.
There are a couple of reasons as to why I like this trade. My first target would be 114 with the next one being 110 after a break below another key level. There is a gap to fill which could possibly make this trade have an insane RR. Let me know what you think!
Disclaimer: I am not a financial advisor and am not offering financial advice. All charts posted are for educational purposes only.


JPM BullishTop investment fund "SWIB" sold BAC and WFC to buy JP Morgan. This stock is already bullish with room to run to previous highs or new highs. Technical indicators are showing bullish momentum for this stock.


Chase ideaBanks seem extremely good value right now
Like many Aerospace and bank stocks we seem to be wedging for a breakout on election day.
Obviously depending on the results many Aerospace could go either direction but.....
I see either direction of the the election win being good for banks


==THE FALL OF JP MORGAN CHASE==HERE I PRESENT YOU MY ANALYSIS OF THE JP MORGAN CHASE AND BY THE LOOKS OF THINGS IT DOESNT SEEM TO VOLATILE TO BREAK THROUGH THE MARKET RESISTANCE AND IT IS MORE LIKELY TO BE FACING A MARKET TOP MEANING ITS MORE BEARISH FROM MY EYES


JPM---Back to 104 at a "BEAR" MinimumIt does not matter how you look at it; even if you believe it won't break-out from the neck-line--which also happens to be the breakout point from triangle that has been forming for months--even if you don't buy that, at a bear minimum the right shoulder formation will complete and it's back to 104 in a lick.
In my opinion, this is about as clear cut as it gets for a pullback of this kind....Big money geared up to buy into value. GOOD LUCK!

JPM 11-02-2020JPM is in a gap up after three days balance, eventhough, Friday´s structure is poor, for that reason if we have an opening drive go with the trend above 98,42 and the odds to fill the gap (99,16) are huge , if we get in previous range again at the open i am expecting 96,23 will be repaired

JPmorgan chase path and directionHello everyone
This is my Jpmorgan idea for Weekly time frame
watch key notes for more detail on chart
for any question feel free to ask :) good luck

JPM - Elliottwave analysis - Bear caseJPM - It is in complex WXY correction, where last drop was wave A of Y of (Y) wave down. It started B wave correction up, which might end near 100 level and thenafter expected to reverse down in C of Y wave down, which might go below 91 level.
Give thumbs up if you really like the trade idea.

JPM TAJPM is trading in a channel currently. It’s also broke out from a recent “bull flag” within the channel. It’s currently sitting in a major resistance zone which is also signaled by the pivot points. Due to all of this, I believe we will see a bullish push on the continuation

JPM Intraday trade idea 10-23-20JPM is breaking a 3 days balance to the upside for that reason we are looking the pullback low (102,59) to take longs, the other place to take longs is 101,78

$JPM JP Morgan Long Above 200MA
Clear market rotation is taking place from growth to value.
European banks are surging today so lets see can its American counterparts
continue higher Friday.
JMP sits just below the 200ma, a break above could bring a nice rally.
$105 is a critical pivot level to break, opening up a rally to $115


JPM - SUPPORT / RESISTANCE - BUY OR SELL 10/20 AM?JPM has formed solid support and resistance within the same levels as experienced in late August through mid-September. As the chart states, if the price breaks below the 99.70 support line then it is likely the price will retrace to former, lower support. If the price stays above the line then its possible that it will retest 102.60.
Or nothing could happen...

JPM posting better than expected earnings$JPM 's better than expected earnings failed to push for a positive outlook, with the PEAD cone projecting a neutral outlook with price currently trading closer to the lower boundaries.
