Ultimate Guide to Master ICT KillzonesWhy Timing Matters Just as Much as Price
Smart Money Concepts (SMC) and ICT methodologies are built on the idea that markets are manipulated by large players with precision. While most traders obsess over price levels, entry models, and liquidity zones, many fail to realize that none of those matter if they happen at the wrong time. Time is not an afterthought, it's a core part of the edge.
Price can show you where the move might happen, but time shows you when smart money is most likely to act. That window of action is what ICT calls the killzone.
What Are Killzones?
Killzones are specific time periods in the trading day when smart money typically executes large moves. These sessions have predictable volatility and institutional order flow. They are not just random hours, they coincide with major session opens and overlaps.
The most relevant killzones are:
London Killzone (LKO), 2 AM to 5 AM EST
New York Killzone (NYKO), 7 AM to 10 AM EST
New York Lunch/Dead Zone, 11:30 AM to 1 PM EST (low probability, often reversal traps)
Each killzone offers unique opportunities depending on how liquidity has been engineered prior. ICT-style setups are most reliable when they form within, or directly in anticipation of, these windows.
The Trap Before the Real Move
Smart money loves to trap retail traders. This trap usually happens just before or early in a killzone. For example, if price takes out a key high at 2:30 AM EST (London open), many retail traders see a breakout. But those in tune with SMC see it as a classic liquidity raid, bait before the reversal.
Once that external liquidity is taken, smart money shows its hand with displacement, a sudden, aggressive move in the opposite direction. This typically forms a clean imbalance (Fair Value Gap) or a breaker block. That’s your cue.
If the price returns to that level within the killzone, that’s the optimal entry window.
Confluence is King: Time, Liquidity, and Structure
The most reliable SMC setups happen when:
Liquidity is swept early into a killzone
Displacement confirms the real direction during the killzone
Entry happens via return to an FVG or OB created within that same session
The setup might still look right if it forms outside these windows, but without proper timing, it’s often just noise or engineered liquidity to trap impatient traders.
Real-World Example: NY Killzone Short
NY, At 8:30 AM EST, price runs above the Asian highs, sweeping liquidity
Displacement, Sharp bearish move breaks structure to the downside at 8:45 AM
Entry, Price retraces into the 5M FVG at 9:10 AM
Result, Clean reversal into a nice profit trageting liquidity, all within the NY session
Outside of this killzone structure, the same setup likely would have chopped or failed.
Common Mistakes Traders Make With Time
Chasing price outside of killzones, Setup might look good, but volume is thin and no follow-through comes
Assuming all killzones are equal, London setups are often cleaner in structure, while NY has more manipulation around news
Forcing trades in NY lunch, Midday reversals do happen, but they’re lower probability. If you're not already in a position by 11 AM EST, it's often best to wait for the next day
The Discipline Edge
Most traders overtrade not because they lack setups, but because they don’t filter based on time. By only trading when price interacts with your levels during active killzones, you immediately reduce the number of bad trades and increase your focus on meaningful opportunities.
Good setups are rare. Good setups in the right timing window are even rarer. That’s where consistency comes from.
Final Thoughts
Time is not optional. In SMC and ICT, it’s not enough to have the level, you need the timing. Killzones are your filter, your edge, and your context for every trade.
Once you understand how time and price move together, and stop treating every moment on the chart equally, your trading will start to reflect the true flow of smart money.
Wait for time, wait for price, then strike.
___________________________________
Thanks for your support!
If you found this guide helpful or learned something new, drop a like 👍 and leave a comment, I’d love to hear your thoughts! 🚀
Make sure to follow me for more price action insights, free indicators, and trading strategies. Let’s grow and trade smarter together! 📈
US100 trade ideas

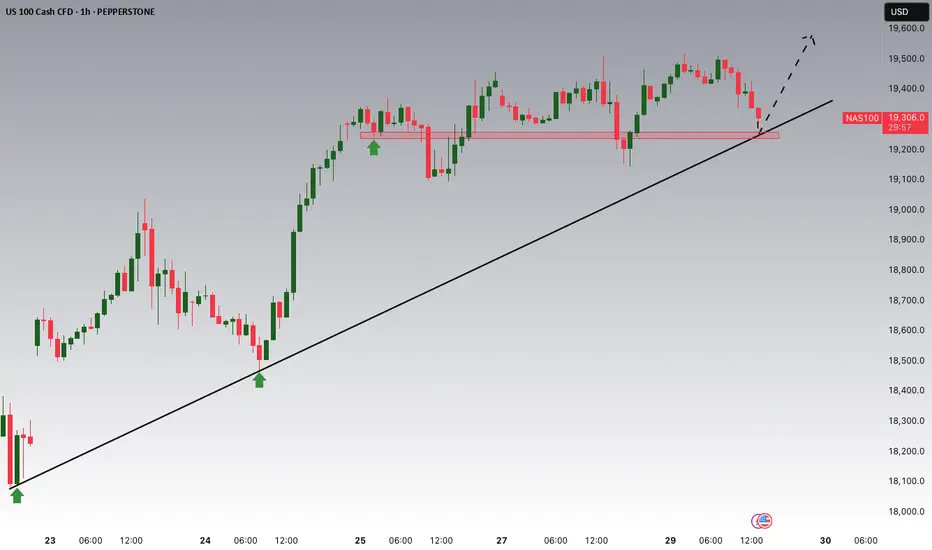
US100 – Bullish Continuation Setting Up Inside the ChannelUS100 remains firmly bullish, showing consistent strength after breaking out from the prior consolidation range in mid-April. Price action has been moving cleanly within a well-defined ascending channel, supported by strong impulsive moves followed by shallow retracements. Each pullback so far has been relatively controlled, and buyers have been stepping in aggressively from clearly defined zones, which aligns with the current risk-on sentiment across tech-heavy indices.
Consolidation Structure
We’ve now had two solid retests of prior fair value gaps (FVGs), both of which acted as demand zones and helped fuel continuation. The first pullback dropped into a previously formed imbalance, consolidated briefly, and then launched a strong bullish leg. The second did the same, creating a layered structure of bullish continuation through efficient retracements. Each of these reactions confirms that price is respecting areas where institutional orders may have been left behind, which adds confluence to the trend’s strength.
Currently, price is working on forming a third FVG within the upper half of the channel. This is developing just below recent highs and has not yet been retested, which makes it a key area of interest. If the market pulls back into that imbalance with proper structure, it could offer the next high-probability opportunity to join the trend.
Bullish Scenario
If price retraces into this newly forming FVG and holds, especially with a wick or lower timeframe rejection candle inside the zone, it could mark the start of the next impulse. The overall trend remains intact as long as we stay within the channel and each FVG continues to serve as valid support. Given the strength of the previous bounces and the orderly nature of this structure, any retest into this new FVG would likely lead to another push into fresh highs and a move toward the upper boundary of the channel.
Bearish Scenario
On the flip side, if price fails to respect this new FVG and breaks below with momentum, especially if the channel support fails at the same time, it would be a sign that buyers are losing control. In that case, we’d want to see how price interacts with the last confirmed FVG below before making any bearish assumptions. A deeper pullback into that area could still provide another long opportunity if structure holds, but any sharp momentum break through both imbalances would put the bullish trend on pause and shift focus to downside levels.
Price Target and Expectations
Assuming the bullish structure continues to play out, the next projected move would be a clean rally toward the top of the channel. There’s enough space left between current levels and the upper trendline to justify an entry on the next pullback, provided it lands inside the newly created FVG. The setup is fairly straightforward, let price come back into the imbalance, confirm with lower timeframe strength, and ride the continuation leg.
Current Stance
There’s no need to chase price here. The best scenario is waiting for a patient retest of the fresh FVG forming now. If it pulls back cleanly, holds the zone, and gives confirmation, that would be the entry. Momentum, structure, and market context are all aligned for continuation, but the trade needs to be built off a level that shows actual commitment from buyers.
Conclusion
US100 is holding its bullish structure well, forming clean legs within an ascending channel, and repeatedly respecting fair value gaps as demand zones. With a new imbalance forming beneath the most recent high, the setup is shaping up for another continuation play if price rotates back and holds. It’s a wait-and-see moment for now, but if the FVG gets tagged and buyers show up, this could be the next leg higher in an already strong trend.
___________________________________
Thanks for your support!
If you found this idea helpful or learned something new, drop a like 👍 and leave a comment, I’d love to hear your thoughts! 🚀
Make sure to follow me for more price action insights, free indicators, and trading strategies. Let’s grow and trade smarter together! 📈

US100 - Perfect Long Opportunities Unfolding?This chart illustrates a high-probability bullish setup based on a combination of market structure shifts, fair value gaps (FVGs), Fibonacci retracement confluence, and order block interaction. We are analyzing the US Tech 100 on the 1-hour timeframe, focusing on recent price action development and a potential reversal scenario forming after a corrective move.
Context and Market Structure:
Price action has been in a corrective downtrend after printing a local high near the 19,950–20,000 range. This move led to a break in short-term bullish structure as sell-side liquidity was swept. A series of bearish candles followed, confirming a shift in momentum to the downside.
However, the retracement stalled upon entering a prior area of imbalance—highlighted here as a larger fair value gap (FVG) zone. This FVG zone acted as a significant demand area, with price reacting strongly upon entry. The zone is marked with a light blue shaded rectangle and aligns with a 1-hour bullish order block.
Price created a swing low in this FVG area before forming higher lows, suggesting the possibility of a short-term reversal.
Golden Pocket & Liquidity Sweep:
A key zone of interest is the "Golden Pocket downtrend" area, which is derived from the 0.618–0.65 Fibonacci retracement levels of the last impulse down. Price previously respected this zone, leading to a rejection and continuation lower. This makes it a notable supply area. Price may revisit this zone as a target or potential reaction point on the next bullish leg.
Note how the initial reaction from the FVG brought the market back into a smaller 1H FVG, situated just beneath the 0.5 retracement level. The internal structure within this zone supports a bullish outlook due to the formation of a higher low followed by a bullish engulfing candle.
Fibonacci Confluence & Execution Levels:
The 0.618 Fibonacci retracement level of the recent move aligns closely with the midpoint of the bullish FVG, providing confluence for a potential re-entry or continuation point. This level is annotated on the chart and highlighted with a horizontal line labeled "0.618 - Entry." This suggests it may act as a magnet for price before further continuation to the upside.
The 0.786 retracement level, also plotted on the chart, indicates the deeper end of the retracement spectrum and lies just above a major structural low. This region, though aggressive, would represent a final line of defense for bullish continuation.
Projection and Price Path:
Based on the current structure and bullish reaction from the FVG zone, a potential price path is drawn on the chart. It suggests one more liquidity grab into the FVG area followed by an impulsive move to the upside.
The blue projection line outlines a potential retracement to fill the nearby FVG (which remains partially unmitigated), followed by a resumption of bullish momentum that targets a revisit to the previous high area around 19,875.
Additional Notes:
* Multiple FVGs are actively interacting in this region, giving layered confluence for demand zones.
* The reaction from the FVG zone is coupled with a bullish engulfing pattern on the 1-hour timeframe, signaling aggressive buying.
* Price remains above the internal bullish structure despite the earlier rejection from the Golden Pocket area.
Conclusion:
The chart setup represents a textbook example of FVG demand zone reaction, supported by Fibonacci confluence and market structure shifts. As price consolidates above this key FVG, a continuation to the upside becomes a strong probability if the internal structure remains intact. Traders should monitor price behavior on lower timeframes as it interacts with the 0.618 and FVG zones for confirmation of bullish continuation.

NASDAQ Potential UpsidesHey Traders, in today's trading session we are monitoring NAS100 for a buying opportunity around 19250 zone, NASDAQ is trading in an uptrend and currently is in a correction phase in which it is approaching the trend at 19250 support and resistance area.
Trade safe, Joe.
NASDAQ Bullish Breakout Above Channel;📈 Technical Analysis Overview
1. Breakout from Downtrend Channel
The price has clearly broken out of a descending channel, confirmed by a clean breakout above the upper trendline.
This is a bullish signal, indicating the end of the prior downtrend and the start of a possible uptrend or reversal.
2. Moving Averages (EMA 50 & EMA 200)
EMA 50 (Red): 18,965
EMA 200 (Blue): 19,409
Price is currently trading above both EMAs, which is another strong bullish indicator.
A bullish crossover (where EMA 50 crosses above EMA 200) is likely imminent if upward momentum continues—this would form a Golden Cross, further confirming bullish sentiment.
3. Structure and Market Behavior
After the breakout, price retested the breakout zone and showed a bounce, forming a higher low, which is characteristic of a bullish structure.
The chart includes projected price action with higher highs and higher lows—suggesting a bullish continuation pattern.
4. Volume & Momentum (Not shown but implied)
Breakouts are typically validated by volume. Although volume is not shown, the sharp upward movement and breakout above resistance suggest strong buying pressure.
🔍 Key Levels to Watch
Resistance: 20,000 psychological level; above that, 20,500–21,000 may act as resistance.
Support: 19,400 (near EMA 200), and 18,965 (EMA 50); a break below may invalidate the bullish setup.
📊 Conclusion
The chart shows a clear breakout from a descending channel, supported by the price moving above both key EMAs. The structure favors bullish continuation, especially if price holds above the 19,400–19,500 support zone. Upside targets lie around 20,500 to 21,000.

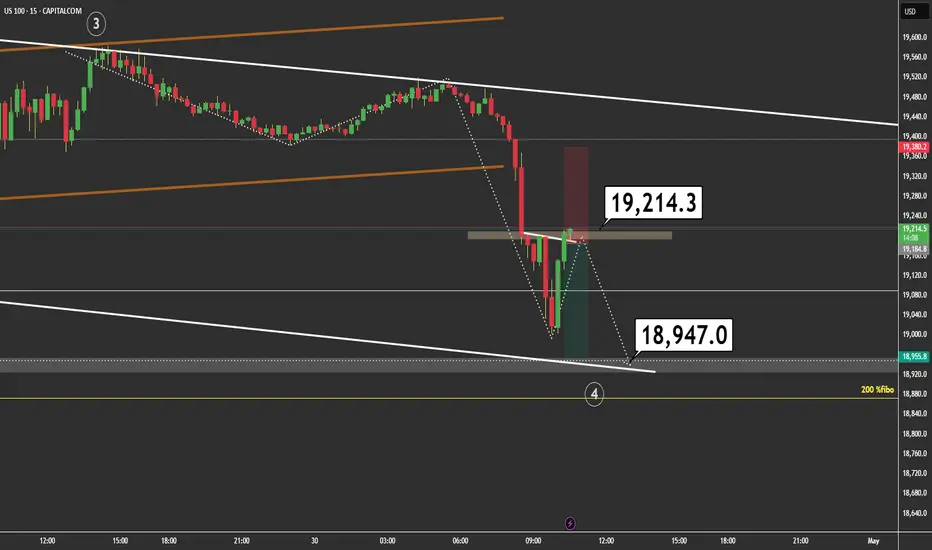
Hits Supply ZoneAfter a sharp drop, price is retracing and reacting to the 19,214.3 resistance zone.
Still inside a descending channel, targeting 18,947.0, where dynamic support and the 200% Fibonacci extension align.
🎯 Entry: Clear rejection from resistance
🛑 Stop: 19,380
✅ Target: 18,947
⚠️ Active management recommended – possible reaction at mid-channel
Structure still confirms bearish momentum (wave 4 in progress). Watch out for fake breakouts!
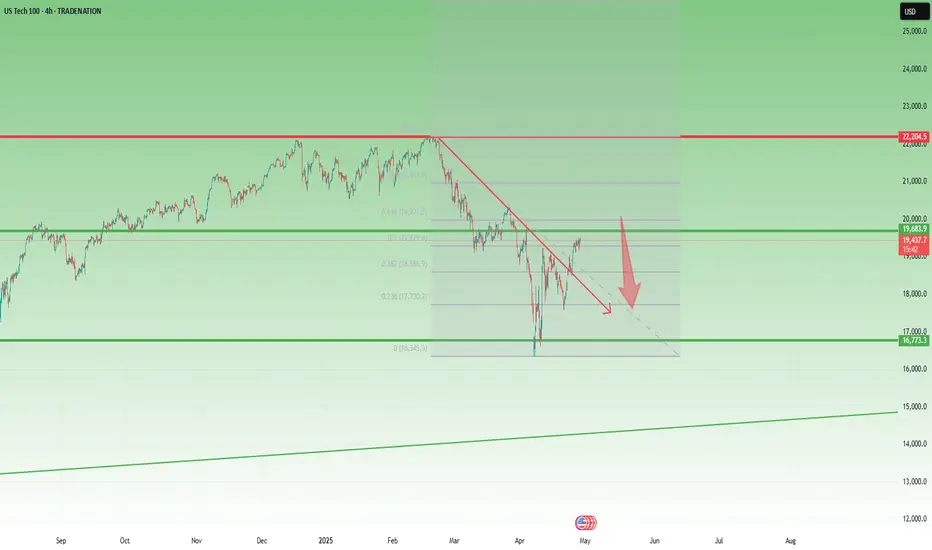
NASDAQ Recovery Looks Fragile Below 20,500After the steep drop to 16,300, NAS100 started to recover, forming a higher low and managing to break back above the falling trendline drawn from the all-time high (ATH).
While these are positive developments, in my opinion, the trend is likely to reverse to the downside soon.
Technically, the index is now entering a heavy resistance zone, marked by:
• The golden sell zone between the 50% and 61.8% Fibonacci retracement,
• Psychological resistance at 20,000,
• Major horizontal resistance around 20,500.
As long as the price remains below 20,500, I favor short trades, targeting a potential drop to at least 18,000
Disclosure: I am part of Trade Nation's Influencer program and receive a monthly fee for using their TradingView charts in my analyses and educational articles.
Bearish reversal off overlap resistance?USTEC is rising towards the pivot and could reverse to the 1st support.
Pivot: 20,418.65
1st Support: 19,265.30
1st Resistance: 21,137.24
Risk Warning:
Trading Forex and CFDs carries a high level of risk to your capital and you should only trade with money you can afford to lose. Trading Forex and CFDs may not be suitable for all investors, so please ensure that you fully understand the risks involved and seek independent advice if necessary.
Disclaimer:
The above opinions given constitute general market commentary, and do not constitute the opinion or advice of IC Markets or any form of personal or investment advice.
Any opinions, news, research, analyses, prices, other information, or links to third-party sites contained on this website are provided on an "as-is" basis, are intended only to be informative, is not an advice nor a recommendation, nor research, or a record of our trading prices, or an offer of, or solicitation for a transaction in any financial instrument and thus should not be treated as such. The information provided does not involve any specific investment objectives, financial situation and needs of any specific person who may receive it. Please be aware, that past performance is not a reliable indicator of future performance and/or results. Past Performance or Forward-looking scenarios based upon the reasonable beliefs of the third-party provider are not a guarantee of future performance. Actual results may differ materially from those anticipated in forward-looking or past performance statements. IC Markets makes no representation or warranty and assumes no liability as to the accuracy or completeness of the information provided, nor any loss arising from any investment based on a recommendation, forecast or any information supplied by any third-party.

Nasdaq 100 - Bull trap print begins circa April 30thThe Nasdaq 100 index is seriously oversold as market participants are gripped by fear. Understandable… however, markets do not crash in fear. Instead the opposite happens, counterintuitive as that sounds.
The Index shall continue display volatility until sellers are exhausted, which is around April 30th when the bottom shall print. So yeah, this week is probably going to suck what life remains of your account. However selling now is not in your best interest, I would argue the opposite. Let me explain why.
On the above daily chart the Nasdaq 100 death cross approaches, forecast to print on April 30th (the dotted lines). The death cross (On the Nasdaq 100 only) is defined as the 65 day Simple Moving average (blue line) crossing down the 240-day SMA with price action under the 240-day SMA.
Now the date has been changing a lot with recent volatility, to counter that behaviour the forecast for the cross uses the "Box Jenkins" forecast method (Ww is a data scientist and engineer specialising in probability theory and stochastic processes, will be adding the tool to my collection of scripts shortly!). Read more about Box Jenkins method here:
www.investopedia.com
Now I’m not normally a fan of moving averages, but on "looking left"… you’ll find me on the front row seat. I tell you all that to tell you this, look left. Look left at past death crosses using this method:
17% rally from death cross on March 15th, 2022
22% rally from death cross on December 18th, 2018
17% rally from death cross on February 16th, 2016
You get the picture. This behaviour continues to repeat with the previous ten death crosses until the print on October 12th, 2000, where the bull trap was followed by a market crash of 80%.
In terms of probability there is a 90% chance the death cross shall result in a positive rally. However, it is my guess many readers will place more weight on the 10% chance of a crash. That’s emotion, not reason! In fact if you scan over many of the published ideas on tradingview you'll notice the bearish slant is strong.
Is this time is different?
=====================
There are no certainties, only probabilities. Price action could continue selling off following the cross to reach new lows. That said, this idea is to forecast a bull trap, not a continuation in the market uptrend. The probability favouring a rally is incredibly high. After that, not so good. Not good at all.
Price action forecast on rally
=======================
Approximately 19.2 to 19.5k
Conclusions
=====================
The market is oversold as emotions run high. History tells us It is unlikely the correction ramps up in momentum after the cross prints. However the cross can indicate the index may be about to enter a bear market should price action reject the 50-day SMA, which it is very likely. That’s for the next post!
Ww

NAS100USD: Institutional Selling Initiated at Premium LevelsGreetings Traders,
Today on NAS100USD, the market is currently operating within a clear bearish institutional order flow. In alignment with this directional bias, we are seeking selling opportunities supported by several key confluences.
Key Observations:
1. Liquidity Sweep at Premium Pricing:
Price has retraced deeply into a premium zone, sweeping the buy stops above a recent swing high. This suggests smart money is executing sell-side order pairing at extreme premium levels, utilizing retail liquidity for institutional distribution. When this occurs, price typically seeks rebalancing at fair value zones and continues toward discount levels.
2. Resistance at Fair Value Gap:
Following the liquidity sweep, price encountered resistance at a previously identified fair value gap (FVG). This FVG has held effectively, reinforcing the bearish outlook and acting as a high-probability rejection zone.
3. Market Structure Shift (MSS):
The market has now confirmed a bearish market structure shift, further validating the downside bias. This shift positions us to anticipate a continuation move.
4. Mitigation Block as Entry Zone:
We are currently watching a mitigation block for potential re-entries. These blocks represent zones where smart money mitigates previous long positions and introduces new short positions in alignment with the prevailing trend. If confirmed, they offer a strategic point to enter short trades.
Trading Plan:
Monitor the mitigation block for confirmation and look to enter with the broader institutional trend. Targets will include fair value regions and deeper liquidity pools at discount prices.
Remain patient and disciplined, and always ensure your analysis aligns with your trading plan.
Kind Regards,
The Architect

nas100 next move? 📈 NAS100 Market Update
NAS100 is currently trading around 19,500 and is forming a running flat wave pattern.
This structure is setting up for a potential move towards the 20,000 target.
Stay alert — the breakout could be strong!

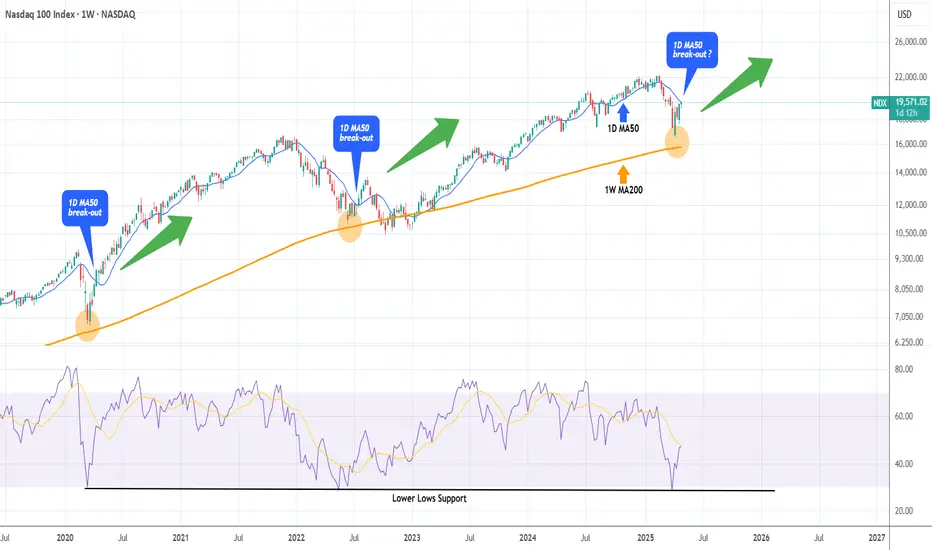
NASDAQ testing its 1D MA50. Break-out or Fake-out?Nasdaq (NDX) has reached its 1D MA50 (blue trend-line) for the first time since February 24. Following the (near) rebound on the 1W MA200 (orange trend-line), this looks like a textbook recovery from a correction to a new long-term Bullish Leg.
Chronologically the last such correction was the March 2020 COVID flash crash, which after it almost touched the 1W MA200, it recovered as fast as the current rebound and when it broke above its 1D MA50, it turned it into the Support of the new long-term Bullish Leg.
What wasn't a break-out but a fake-out was the rebound after the June 13 2022 (near) 1W MA200 rebound, when the break above the 1D MA50 was false as it produced a new rejection and sell-off later on. The difference is that 2022 was a technical Bear Cycle both in terms of length and strength.
Whatever the case, Nasdaq has seen the lowest 1W RSI (oversold) reading among those 3 bottoms. So do you think today's 1D MA50 test is a break-out or fake-out?
-------------------------------------------------------------------------------
** Please LIKE 👍, FOLLOW ✅, SHARE 🙌 and COMMENT ✍ if you enjoy this idea! Also share your ideas and charts in the comments section below! This is best way to keep it relevant, support us, keep the content here free and allow the idea to reach as many people as possible. **
-------------------------------------------------------------------------------
💸💸💸💸💸💸
👇 👇 👇 👇 👇 👇
Nasdaq Bullish Reversal in Play !!📈 NASDAQ Outlook: Bullish Momentum Builds Up
✅ Breakout Confirmed: Price action has broken above the descending channel, signaling a reversal from the previous downtrend.
📊 EMA Crossover: The 50 EMA is crossing above the 200 EMA (a golden cross), historically a bullish indicator.
🔼 Momentum Strong: Price is accelerating above EMAs with a steep upward trajectory, suggesting buyers are in control.
🔮 Potential Target: With sustained momentum, price could aim for the 21,000+ region in the short term.
If the price sustains above the 19,500 zone, dips could be considered buying opportunities in the current bullish structure.

nas falling out the sky??price is at a 4hr bearish order block. have a ton of money to the downside i think its gonna get swept before trump pushes the markets up

A daily bias for 2025 Find the range of the day which has the protected high's and protected low's looks for contuniation or liquidity grab and small time trame determine if a CSID or continuation form Is taking place

NASDAQ's Inverse H&S that targets $25000Nasdaq (NDX) is forming the Right Shoulder of a potential Inverse Head and Shoulders (IH&S) pattern. The price action is 'stuck' within the 1D MA200 (orange trend-line), which got tested on Friday for the first time since March, and the 1D MA50 (blue trend-line).
Since the 1D MA200 was the level that initiated the March 26 rejection, it is possible to see a short-term pull-back now, all in the process of forming the Right Shoulder and after the market digests the new Fed Rate Decision, starts the next Leg Up. Note that the 1D RSI is already on its February highs.
As a result, our long-term Target is at 25000, just below the 2.0 Fibonacci extension level, which is a standard technical target for IH&S patterns.
-------------------------------------------------------------------------------
** Please LIKE 👍, FOLLOW ✅, SHARE 🙌 and COMMENT ✍ if you enjoy this idea! Also share your ideas and charts in the comments section below! This is best way to keep it relevant, support us, keep the content here free and allow the idea to reach as many people as possible. **
-------------------------------------------------------------------------------
Disclosure: I am part of Trade Nation's Influencer program and receive a monthly fee for using their TradingView charts in my analysis.
💸💸💸💸💸💸
👇 👇 👇 👇 👇 👇

Long-term bearish to 14kJust adding to the idea previously posted:
A black upward trendline shows a strong bullish trend from mid-2022 through early 2025. Recently, there’s been a significant breakdown below this trendline, which signals a substantial change in trend from bullish to bearish. On Friday, we tested and rejected this trendline, which at the same time tested a 65% (golden pocket) retracement of the recent move, indicating a possible resistance area after a strong rebound.
I expect the price not to break this level any further.
The target remains 14k and below.

NASDAQ INDEX (US100): Move Up Ahead
I think that US100 is going to bounce.
The price is currently retesting a recently broken
key daily horizontal resistance.
We see a strong positive bullish reaction to that.
Next resistance - 19779
❤️Please, support my work with like, thank you!❤️

NASDAQ: Rejected on the 1D MA50. Can it break it?Nasdaq is neutral on its 1D technical outlook (RSI = 52.608, MACD = -100.810, ADX = 23.609) as it got rejected today on the 1D MA50. That is the first serious Resistance test of the April 7th rebound and until it breaks, we can see a technical pullback to the 4H MA100 in order to establish the new Support. With the 1D RSI confirmed the new long term bottom with a DB, buying the dips on every such pullback is the most effective strategy on such occasions. Our short term target is the R1 level (TP = 20,300).
## If you like our free content follow our profile to get more daily ideas. ##
## Comments and likes are greatly appreciated. ##

NQ: NFP day!Good day!
Yesterday candle was bearish, Is it the end of the upper move?
All will depend on today's data and rumors from WH.
1- Undershoot data: Very bad for equities and NQ starts its Wave 3. But keep in mind, an undershoot also means FED will cut and free money will be on the table which is positive equities.
2- Inline: Bad for equities as FED rate cut and free money chances will decrease. In this case, price might continue its consolidation.
3- Overshoot: Good for equities and NQ might reach 21000. In this scenario, Fed rate cut will be out from June meeting.
Regarding WH rumors, it seems tariffs deals are imminent or underway. I already mentioned here few times that the 90-day pause will become an eternity pause. This seems a major change. But in my view it won't be a sustainable or durable change as all countries lost confidence in US.
Until the rumor becomes a fact, I maintain the same plan for ST/MT/LT: Sell.
GL!

Nasdaq Pending Short: previous wave 4 as resistance This idea is complementary to the S&P500 pending short idea. I've labelled the waves slightly differently but it doesn't impact the forecast for it's still the same expectation of a last wave. I purposely left it as a different count as comparison.
I would start building a short position around 20300. Stop above purple Fibonacci extension level.

NAS100USD: Bearish Setup Builds as Price Retests Key Supply ZoneGreetings Traders,
In today’s analysis on NAS100USD, we continue to observe bearish institutional order flow, and as such, our objective is to align our trading opportunities with this directional bias.
Key Observations:
1. Bearish Break of Structure and Retracement:
Following a clear bearish break of structure, price has retraced into a mitigation block. This zone represents an area where institutional buying previously occurred. As price trades back into it, institutions often mitigate those earlier positions and reintroduce sell-side interest—offering us an opportunity to follow their lead.
2. Confluence at the Mitigation Block:
The mitigation block is further reinforced by the presence of a bearish order block, adding strength to the resistance zone. This alignment suggests the area may serve as a high-probability reversal point for bearish continuation.
Liquidity Sweep Scenario:
There remains a possibility that price may take out nearby buy-side liquidity (buy stops) before continuing downward. If this occurs, we will wait for confirmation before entering short positions, maintaining alignment with the overall bearish narrative.
Trading Plan:
Upon confirmation of rejection at the mitigation zone, we will seek to engage in short setups targeting liquidity pools in discount pricing zones.
Remain patient, disciplined, and ensure each trade aligns with your strategy.
Kind Regards,
The Architect

NAS - Move to the downsideTechnicals, trend and price-action is hinting towards a drop on NAS, that needs to respect 19478. I'm earmarking a 'loaded' push from there to 19571 and then conclude for the week.
Happy trading!
