Hanzo | Nas100 15 min Breaks – Will Confirm the Next Move🆚 Nas100 – Hanzo’s Strike Setup
🔥 Timeframe: 15-Minute (15M)
——————
💯 Main Focus: Bearish Breakout at 18700
We are watching this zone closely.
📌 If price breaks with high volume, it confirms Smart Money is in control, and a strong move may follow.
———
🔻 Every warrior needs a tribe.
Follow Hanzo. Support the path.
Analysis
👌 Bearish Signs (15M TF):
• Liquidity Grab + CHoCH at 18700
• Liquidity Grab + CHoCH at 18400
👌 The Market Has Spoken – Are You Ready to Strike?
US100 trade ideas

Downtrend looks to be continuing with a new lower highAre we targeting a new lower low? Time will tell, but with every passing day the true nature of a sitting president full of hot air comes to light. The words that are spewed will have less and less gravity on the markets until his words are put out onto deaf ears and the markets can get back to a functioning state. When you hear a liar speak the first time you don't know the words are lies, but eventually you just stop listening to the nonsense because it all seems like lies after. Either way the words hold little punch. Shock and Shock is the ploy, I guess? I'm not shocked any longer and maybe the markets will get it too eventually.

WHERE TO GO....NDXGood Morning,
I entered a trade with QQQ yesterday as the market has signaled a strong movement for the bulls. By no means is this a confirmed moved however I saw an opportunity for early entry.
We still need to beat out the overall trend reversal resistance which is at the 19,700 mark of April 2th.
Prior to that we need to make it through:
18,400$ First resistance.
19,000 2nd Resistance.
Trend is showing that we will break both of those levels.
Enjoy!

NSDQ100 INTRADAY resistance retest U.S. futures rose and the dollar strengthened after Donald Trump eased concerns that had been weighing on markets. He stated he has no plans to fire Fed Chair Jerome Powell, despite ongoing frustrations over interest rates. While this helped calm nerves, Bloomberg's John Authers cautions against viewing it as a major shift in sentiment.
Trump also struck a more conciliatory tone on China, saying he intends to be “very nice” in trade talks and suggested tariffs could be lowered if a deal is reached—indicating a possible softening of his approach toward Beijing.
Key Support and Resistance Levels
Resistance Level 1: 19195
Resistance Level 2: 19600
Resistance Level 3: 20080
Support Level 1: 17820
Support Level 2: 17330
Support Level 3: 16700
This communication is for informational purposes only and should not be viewed as any form of recommendation as to a particular course of action or as investment advice. It is not intended as an offer or solicitation for the purchase or sale of any financial instrument or as an official confirmation of any transaction. Opinions, estimates and assumptions expressed herein are made as of the date of this communication and are subject to change without notice. This communication has been prepared based upon information, including market prices, data and other information, believed to be reliable; however, Trade Nation does not warrant its completeness or accuracy. All market prices and market data contained in or attached to this communication are indicative and subject to change without notice.

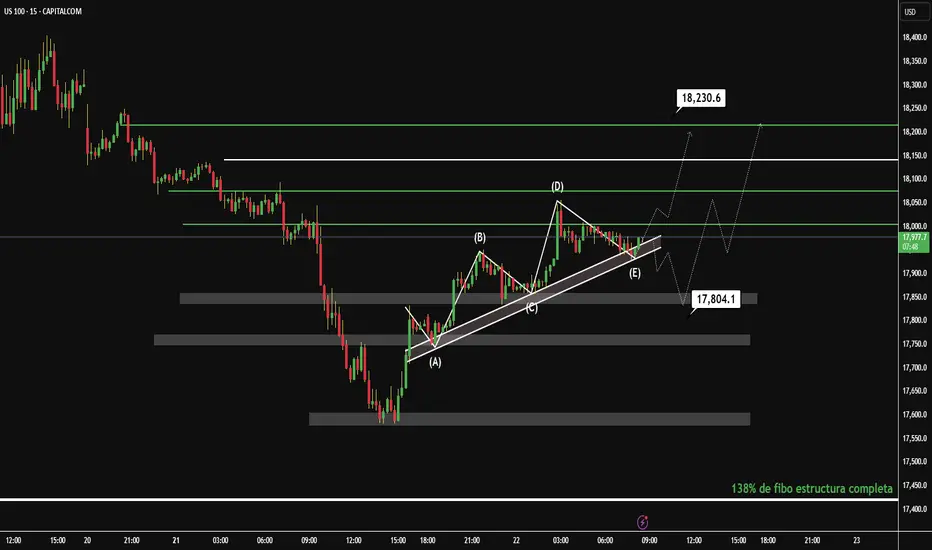
Ready for Takeoff: Buy Signal DetectedThe 15-minute chart of the NASDAQ shows a recent bullish move following a correction. I identify an interesting technical structure that could indicate an upcoming directional move.
Technical Analysis:
Patterns and Structure:
Symmetrical Triangle (A): The price has formed a symmetrical triangle between points (B) and (D), suggesting consolidation before a breakout. This pattern is neutral, but the recent upside breakout indicates a possible bullish continuation.
Fibonacci: The retracement from the high at (D) to the low at (E) reached the 38.2% Fibonacci level, which acted as dynamic support (17,804.1). This level is key and reinforces the validity of the current rebound.
Support and Resistance:
Support: The 17,804.1 level (38.2% Fibonacci) and the triangle base at 17,797.2 are key supports.
Resistance: The next upside target is at 18,230.6, a previous resistance level. If the price breaks above it, it could target 18,400.
Trend:
The breakout of the symmetrical triangle and the rebound from the 38.2% Fib confirm a short-term uptrend. The price is breaking the triangle's downtrend line (E), reinforcing the bullish momentum.
Trading Idea:
Entry: Consider a long entry (buy) at the current level (~18,000) or wait for a pullback to the support at 17,804.1 for a better risk-reward ratio.
Target: First target at 18,230.6 (resistance). If the momentum continues, the next level to watch is 18,400.
Stop Loss: Below the support at 17,797.2, to protect against a false breakout.
Risk/Reward: An entry at 18,000 with a stop at 17,797 and a target at 18,230 offers an R/B ratio of approximately 1:1.2.
Conclusion:
The NASDAQ at 15M shows a bullish breakout following a symmetrical triangle, with support at the 38.2% Fibonacci level. The short-term trend is bullish, with an initial target at 18,230.6. Monitor support at 17,804.1 to confirm the continuation of the move.
This analysis is concise and structured for a TradingView post. If you need adjustments or more details, please let me know.
Disclaimer: Grok is not a financial advisor; please consult one. Do not share information that could identify you.
Bullish Breakout on NAS100 – Momentum ShiftingNASDAQ 100 (US100) – Bullish Setup Developing
1. Falling Wedge Breakout:
Price has broken out of the falling wedge (purple trendlines), signaling a potential reversal to the upside.
2. Retesting Breakout Zone:
Current price action is retesting the breakout level near the 18,000 zone, indicating potential support forming.
3. Trendline Confluence:
The breakout aligns with the lower boundary of the broader ascending channel (blue), acting as dynamic support.
4. Strong Bullish Rejection at Lows:
Price showed strong buying interest near 17,700, forming a bullish rejection wick and bounce.
5. Clean Target Ahead:
Next key resistance zone lies around 18,540, where price may face selling pressure again – this matches previous structure and descending channel resistance.
6.Momentum Shift Noted:
Lower highs and lower lows structure has been invalidated, hinting at a possible trend shift.
Thanks for your Time..

Hanzo | Nas100 15 min Breaks – Will Confirm the Next Move🆚 Nas100 – Hanzo’s Strike Setup
🔥 Timeframe: 15-Minute (15M)
———————
💯 Main Focus: Bullish Breakout at 18030
We are watching this zone closely.
📌 If price breaks with high volume, it confirms Smart Money is in control, and a strong move may follow.
💯 Main Focus: Bearish Breakout at 17830
We are watching this zone closely.
📌 If price breaks with high volume, it confirms Smart Money is in control, and a strong move may follow.
———
🔻 Every warrior needs a tribe.
Follow Hanzo. Support the path.
Analysis
👌 Bearish Signs (15M TF):
• Liquidity Grab + CHoCH at 18700
• Liquidity Grab + CHoCH at 18400
• Strong Rejections seen at:
➗ 18400 – Major support
➗ 19000 – Proven resistance
———
🩸 Key Zones to Watch:
• 18700 – Bearish breakout level
• 19130 – Strong resistance (tested 6 times)
• 18400 – Equal lows
Hanzo | Nas100 15 min Breaks – Will Confirm the Next Move

Nasdaq-100 H4 | Potential bearish reversalThe Nasdaq-100 (NAS100) could rise towards an overlap resistance and potentially reverse off this level to drop lower.
Sell entry is at 18,144.20 which is an overlap resistance.
Stop loss is at 18,800.00 which is a level that sits above an overlap resistance.
Take profit is at 16,779.34 which is a swing-low support.
High Risk Investment Warning
Trading Forex/CFDs on margin carries a high level of risk and may not be suitable for all investors. Leverage can work against you.
Stratos Markets Limited (tradu.com):
CFDs are complex instruments and come with a high risk of losing money rapidly due to leverage. 63% of retail investor accounts lose money when trading CFDs with this provider. You should consider whether you understand how CFDs work and whether you can afford to take the high risk of losing your money.
Stratos Europe Ltd (tradu.com):
CFDs are complex instruments and come with a high risk of losing money rapidly due to leverage. 63% of retail investor accounts lose money when trading CFDs with this provider. You should consider whether you understand how CFDs work and whether you can afford to take the high risk of losing your money.
Stratos Global LLC (tradu.com):
Losses can exceed deposits.
Please be advised that the information presented on TradingView is provided to Tradu (‘Company’, ‘we’) by a third-party provider (‘TFA Global Pte Ltd’). Please be reminded that you are solely responsible for the trading decisions on your account. There is a very high degree of risk involved in trading. Any information and/or content is intended entirely for research, educational and informational purposes only and does not constitute investment or consultation advice or investment strategy. The information is not tailored to the investment needs of any specific person and therefore does not involve a consideration of any of the investment objectives, financial situation or needs of any viewer that may receive it. Kindly also note that past performance is not a reliable indicator of future results. Actual results may differ materially from those anticipated in forward-looking or past performance statements. We assume no liability as to the accuracy or completeness of any of the information and/or content provided herein and the Company cannot be held responsible for any omission, mistake nor for any loss or damage including without limitation to any loss of profit which may arise from reliance on any information supplied by TFA Global Pte Ltd.
The speaker(s) is neither an employee, agent nor representative of Tradu and is therefore acting independently. The opinions given are their own, constitute general market commentary, and do not constitute the opinion or advice of Tradu or any form of personal or investment advice. Tradu neither endorses nor guarantees offerings of third-party speakers, nor is Tradu responsible for the content, veracity or opinions of third-party speakers, presenters or participants.

today igot 1:650 RR trade in #nas100today igot 1:650 RR trade in #nas1004ht pd aray
and
15min aray
and
1 min entry

NQ/US100/NAS100 Short - Day Trades 1:2 RRRisking 1% to make 2%
NAS100, US100, NQ, NASDAQ short for day trade, with my back testing of this strategy, it hits multiple possible take profits, manage your position accordingly.
Risking 1% to make 2%
Use proper risk management
Looks like good trade.
Lets monitor.
Use proper risk management.
Disclaimer: only idea, not advice

NASDAQ-100 (NDX) daily analysis by TradingDONAlright, folks: here’s my take on today’s 15‑minute CAPITALCOM:US100 action—Buckle up.📈
**When the Market Faked Us Out**
I was watching price flirt with a fresh high up around 18,500–18,550, but it couldn’t stick. You know that moment: the rally teases you into thinking bulls have taken over, then promptly rolls over. I marked the false higher‑high with a tiny red “X” on my chart—classic stop‑hunt before the reversal. In plain English: institutions swept buy stops, then handed off into those get‑rich‑quick hopes.
**Key Zones:**
- **Premium (18,800+):** Smart money sells here—price always stalls or dumps.
- **Discount (18,000–18,100):** Institutions buy the dip—bounces here carry weight.
**FVGs & Stop‑Hunt:**
I’ve got Fair Value Gaps around 17,600–17,750 that act like magnets on a pullback. The drop to 17,562.6 was a classic sell‑side stop hunt before the big reversal.
- Distribution hit the Premium zone.
- Accumulation’s brewing in the Discount zone + FVGs.
- That sweep of 17,562.6 was classic smart‑money stop‑hunt + scoop.
- 💡My long at ~17,880 sits at a neat support confluence—so, for now, I’m leaning bullish to the next structural level.
*This is my educational breakdown of ICT concepts—not trading advice. Do your own homework and manage risk.*

NAS100 Buy Trade Analysis (4H Timeframe)Entered a buy position on NAS100 after price retraced to the 0.618 Fibonacci level, which also aligns perfectly with the ascending trendline support. This area has acted as a strong confluence zone, showing signs of a potential higher low (HL) formation on the 4H chart.
✅ Confluences supporting the trade:
Price bounced from the 0.618 Fib retracement.
Respecting the trendline support indicating bullish structure continuation.
Formation of Higher Low on both the 4H timeframe and also clearly visible on Daily and Weekly charts, indicating strong bullish momentum from a higher timeframe perspective.
RSI is near the oversold zone (~30), showing signs of a potential bullish reversal.
🎯 Targets:
First TP around the 18,863 zone (previous resistance area).
Final TP in the region of 19,161–19,250, aligning with the 200 EMA and psychological resistance levels.
🛡️ Stop Loss: Placed below the trendline and previous swing low for protection in case of invalidation.

STOCKS LOWER??This is what Im gauging on the NAS100, as well as the Dow Jones and SnP500 (even though the charts aren't presented).
Technically, I see a 4H QM which sets the high, with the lows not giving the same HTF strength that the highs have given. We've got a nice trading range as price hasn't realigned for the stocks to show its true bullish direction to the ATHs, meaning I see this huge sell off continue until those lows have been ran. I see price printing lower.
Fundamentally, I like to think of the worst case scenario for Trump and the season we're in currently, its made me nice trades. Lets see

X2: NQ/US100/NAS100 Long - Day Trades 1:2X2:
Risking 1% to make 2%
NAS100, US100, NQ, NASDAQ Long for day trade, with my back testing of this strategy, it hits multiple possible take profits, manage your position accordingly.
Risking 1% to make 2%
Use proper risk management
Looks like good trade.
Lets monitor.
Use proper risk management.
Disclaimer: only idea, not advice


My NQ Long Idea 5/5/2025Been a while but I haven't been posting ideas because I have been scalping and doing smaller time frame trades. I think we have NQ at a nice price level where we might see a bull run soon with the market sentiment slowly "thawing" on the idea of "risk-off" sentiment to "risk-on" sentiment and environment with more uncertainties clearing out of the market scenes.
We have US trying to negotiate deals with many countries including China which is very challenging and we can never know if it will be achieved or not. However, from an economic point of view we can agree that the US economy is in the Neutral-bullish. We have a very bullish price action in the past week or so. We also have healthy economic numbers but it is still unclear until Wednesday.
On Wednesday the FED will speak on this matter and give us some clarity on whether it is a Risk-on or Risk-off environment. Anything will happen but I can see the "Gap" getting filled on FED day due to the SPIKE that will be delivered to us.
Currently Edgefinder tool is giving us 8 for NQ with only the GDP and sPMI scores in the negative. However the net score is bullish and on the positive.
I think 1 of those two ideas will be played out sooner or later anything can happen but from a technical view I would like to see the price reaching the 50% FIB and then take off from there.
It is subjective though and everything in trading is subjective including what I do and say.

NAS100 and the analysis that has reached a conclusion and has noToday I was reviewing my previous analyses when I came across this chart on NAS100 and after months of waiting, it had come to fruition.
It's a bit late to publish now, but I will gradually increase the number of symbols and arrange the time so that the results are available to everyone on time!!
Good luck!
MJ.REZAEI

Nasdaq-100 H4 | Falling toward a pullback supportThe Nasdaq-100 (NAS100) is falling towards a pullback support and could potentially bounce off this level to climb higher.
Buy entry is at 19,595.55 which is a pullback support.
Stop loss is at 18,900.00 which is a level that lies underneath an overlap support.
Take profit is at 20,343.35 which is a swing-high resistance.
High Risk Investment Warning
Trading Forex/CFDs on margin carries a high level of risk and may not be suitable for all investors. Leverage can work against you.
Stratos Markets Limited (tradu.com):
CFDs are complex instruments and come with a high risk of losing money rapidly due to leverage. 63% of retail investor accounts lose money when trading CFDs with this provider. You should consider whether you understand how CFDs work and whether you can afford to take the high risk of losing your money.
Stratos Europe Ltd (tradu.com):
CFDs are complex instruments and come with a high risk of losing money rapidly due to leverage. 63% of retail investor accounts lose money when trading CFDs with this provider. You should consider whether you understand how CFDs work and whether you can afford to take the high risk of losing your money.
Stratos Global LLC (tradu.com):
Losses can exceed deposits.
Please be advised that the information presented on TradingView is provided to Tradu (‘Company’, ‘we’) by a third-party provider (‘TFA Global Pte Ltd’). Please be reminded that you are solely responsible for the trading decisions on your account. There is a very high degree of risk involved in trading. Any information and/or content is intended entirely for research, educational and informational purposes only and does not constitute investment or consultation advice or investment strategy. The information is not tailored to the investment needs of any specific person and therefore does not involve a consideration of any of the investment objectives, financial situation or needs of any viewer that may receive it. Kindly also note that past performance is not a reliable indicator of future results. Actual results may differ materially from those anticipated in forward-looking or past performance statements. We assume no liability as to the accuracy or completeness of any of the information and/or content provided herein and the Company cannot be held responsible for any omission, mistake nor for any loss or damage including without limitation to any loss of profit which may arise from reliance on any information supplied by TFA Global Pte Ltd.
The speaker(s) is neither an employee, agent nor representative of Tradu and is therefore acting independently. The opinions given are their own, constitute general market commentary, and do not constitute the opinion or advice of Tradu or any form of personal or investment advice. Tradu neither endorses nor guarantees offerings of third-party speakers, nor is Tradu responsible for the content, veracity or opinions of third-party speakers, presenters or participants.

NAS100 Rejected at Key Supply Zone | Pullback in Play?The NASDAQ 100 (NAS100) just tapped into a strong supply zone around 20,000 – 20,100 and is showing signs of rejection. Price is currently at 20,007, down -0.45%, and struggling to hold above the demand turned resistance.
Chart Highlights:
Supply Zone: 20,000 – 20,100 (visible rejection area).
Key Support Levels:
19,852 – immediate structure level.
18,846 – breakout origin, potential demand zone.
17,673 – major volume and demand cluster (orange zone).
Bearish Bias:
If price loses 19,852, we could see a drop toward 18,846.
Failure there opens the path for a deeper correction to 17,673, where buyers are likely to step in.
Bullish Trigger:
A clean break and close above 20,100 would flip the script and suggest continuation of the bullish rally.
Volatility Warning:
Upcoming U.S. economic data could cause sharp moves (see calendar icon on chart). Be cautious and reactive.
Trade Setup: Watch for short opportunities below 19,852 with stops above supply and targets near the marked supports.
---
Is NAS100 gearing up for a dip or breaking out soon? Drop your forecast in the comments!
#NAS100 #NASDAQ #TechnicalAnalysis #SupplyAndDemand #VolumeProfile #LuxAlgo #PriceAction #IndicesTrading #USMarket #ForexSignals #SmartMoney

Technical Breakdown on US 100 | 1H TimeframeTechnical Breakdown on US100 1H Chart using Volume Profile, Gann, and CVD + ADX
1. Key Observations (Volume, Gann & CVD + ADX Focused)
a) Volume Profile Insights:
Value Area High (VAH): 20,035 (approx. from most recent high-volume node)
Value Area Low (VAL): 19,710
Point of Control (POC):
High-Volume Nodes: Clustered between 19,850 – 20,050 (heavy volume activity)
Low-Volume Gaps: Between 19,700 – 19,800 (could act as fast move zones)
b) Liquidity Zones:
Liquidity Pools:
Order Absorption: Observed near 19,850 (buy side absorption with wicks and CVD reaction)
c) Volume-Based Swing Highs/Lows:
Swing High: 20,035 with volume tapering and price exhaustion
Swing Low: 19,710 showing high delta rebound and large wick
d) CVD + ADX Indicator Analysis:
Trend Direction: Uptrend (price making HH/HL, supported by rising channel)
ADX Strength: ADX > 20, DI+ > DI- → Confirmed bullish trend
CVD Confirmation:
2. Support & Resistance Levels
a) Volume-Based Levels:
Support:
Resistance:
b) Gann-Based Levels:
Recent Swing Low: 19,710 (1/3 retracement zone)
Key Retracement Levels:
3. Chart Patterns & Market Structure
a) Trend: Bullish (confirmed by ADX > 20 and CVD rising)
b) Notable Patterns:
Bullish Ascending Channel clearly forming with higher lows
Price pulled back to mid-channel + POC confluence, showing signs of retest and continuation
No major bearish reversal patterns yet; healthy pullback structure
4. Trade Setup & Risk Management
a) Bullish Entry (CVD + ADX confirm uptrend):
Entry Zone: 19,850–19,875 (POC retest + trendline support)
Targets:
Stop-Loss (SL): 19,700 (below VAL and swing low)
RR: ~1:2.5
b) Bearish Entry (Only on breakdown):
Entry Zone: Below 19,700 (VAL loss + CVD breakdown)
Target: T1: 19,422.18 (previous POC support)
Stop-Loss (SL): 19,860 (back above trendline/POC)
RR: ~1:2
c) Position Sizing:
Risk only 1-2% of capital per trade for controlled exposure

Nas100 Buy Looking at the w1 chart we can spot out a strong pullback momentum which gave D1 TF a bullish bias and now on h4 price look to pullback towards an AOI for a bullish continuation. Fingers crossed

NASDAQ SELL?This is just a rough idea, I still need to wait and see where the market moves to and rejects from in order for TP and SL placement.
But, there is a Asian high, a London high and a NY high sitting closely together, causing what I call a liquidity pool, and we all know that liquidity moves the market. its like a magnet for the market.
so I'll be waiting and watching to see which session is swept and how the market reacts. But all in all, this is what i personally think Nasdaq will do
what are your thoughts? I would love to hear them.
I hope you all have a fantastic week and you rake in those profits.
God bless
J.D.L

NQ: Upcoming Weekly Analysis!FA Analysis:
1- Macro economic Indicators: Most data came red and few were inline confirming the slowing down of the economy.
2- Inflation data came better than expected.
3- Trump Tariffs: Strong rumors about deals underway from this week. The 90-day pause will become an indeterminate pause.
4- We have the FED this week. Nothing in terms of immediate rate cut, but the conference is very important for the looking forward.
5-ISM Services data is important.
From FA perspective, market is focusing on Tariffs deals. If it materializes, the ST outlook will change from Sell to Buy. MT and LT Outlook will stay Sell.
TA Analysis:
Weekly TF:
The weekly close was bullish and price retraced more than 61.8. This could be the end of this wave.
The FED and/or the tariff deals will give the signal for either the start of wave 3 or a continuation up. Until then, a consolidation is expected.
Daily TF:
Same as weekly... a bullish daily close. A consolidation is expected until the FED.
Happy and green week to Everyone!
