Hellena | Oil (4H): SHORT to support area of 54.00.Friends, what do we see after the recent downward movement? Most likely we see a continuation of the downward movement in a combined correction.
The hardest thing about compound corrections is to understand where the wave ends and begins.
I believe that the price is now in the middle wave “C” and will continue the downward movement to the target of 53.991.
Wave “B” is likely to reach the 60.00 area, but I do not recommend long positions. Work with pending limit orders.
Manage your capital correctly and competently! Only enter trades based on reliable patterns!
OIL_CRUDE trade ideas

WTI CRUDE OIL(USOIL): Classic Gap TradeI see a nice gap down on USOIL, with a strong possibility that the gap will be filled soon.
The price approached an important support level and showed signs of a potential bullish signal.
I also observed a breakout of the neckline of an ascending triangle pattern on the hourly chart.
It is likely that USOIL will continue to rise and reach the 57.7 level in the near future.

USOIL What Next? BUY!
My dear followers,
I analysed this chart on USOIL and concluded the following:
The market is trading on 58.35 pivot level.
Bias - Bullish
Technical Indicators: Both Super Trend & Pivot HL indicate a highly probable Bullish continuation.
Target - 60.83
Safe Stop Loss - 57.06
About Used Indicators:
A super-trend indicator is plotted on either above or below the closing price to signal a buy or sell. The indicator changes color, based on whether or not you should be buying. If the super-trend indicator moves below the closing price, the indicator turns green, and it signals an entry point or points to buy.
Disclosure: I am part of Trade Nation's Influencer program and receive a monthly fee for using their TradingView charts in my analysis.
———————————
WISH YOU ALL LUCK

USOIL SELL OPPORTUNITY Price is on a shorterm downtrend in M15. We recently had a pullback which is a good opportunity for shorting. A sell opportunity is envisaged from the current market price

Bullish breakout?WTI Oil (XTI/USD) is reacting off the pivot which is a pullback resistance and could potentially rise to the 1st resistance.
Pivot: 59.28
1st Support: 57.84
1st Resistance: 61.83
Risk Warning:
Trading Forex and CFDs carries a high level of risk to your capital and you should only trade with money you can afford to lose. Trading Forex and CFDs may not be suitable for all investors, so please ensure that you fully understand the risks involved and seek independent advice if necessary.
Disclaimer:
The above opinions given constitute general market commentary, and do not constitute the opinion or advice of IC Markets or any form of personal or investment advice.
Any opinions, news, research, analyses, prices, other information, or links to third-party sites contained on this website are provided on an "as-is" basis, are intended only to be informative, is not an advice nor a recommendation, nor research, or a record of our trading prices, or an offer of, or solicitation for a transaction in any financial instrument and thus should not be treated as such. The information provided does not involve any specific investment objectives, financial situation and needs of any specific person who may receive it. Please be aware, that past performance is not a reliable indicator of future performance and/or results. Past Performance or Forward-looking scenarios based upon the reasonable beliefs of the third-party provider are not a guarantee of future performance. Actual results may differ materially from those anticipated in forward-looking or past performance statements. IC Markets makes no representation or warranty and assumes no liability as to the accuracy or completeness of the information provided, nor any loss arising from any investment based on a recommendation, forecast or any information supplied by any third-party.

Hellena | Oil (4H): SHORT to support area of 55.204.Colleagues, I believe that the price will continue its downward movement. At the moment we are observing a combined correction. I expect the completion of wave “Y”. Even if it is already completed, the price is still waiting for a downward correction to the support area of 55.204. Therefore, I think that 55.204 is the 1st minimum target.
There are two possible ways to enter the position:
1) Market entry
2) Pending Limit orders.
Manage your capital correctly and competently! Only enter trades based on reliable patterns!

Bullish bounce of pullback support?WTI Oil (XTI/USD) has bounced off the pivot which has been identified as a pullback support support and could potentially rise to the pullback resistance.
Pivot: 57.60
1st Support: 56.26
1st Resistance: 59.82
Risk Warning:
Trading Forex and CFDs carries a high level of risk to your capital and you should only trade with money you can afford to lose. Trading Forex and CFDs may not be suitable for all investors, so please ensure that you fully understand the risks involved and seek independent advice if necessary.
Disclaimer:
The above opinions given constitute general market commentary, and do not constitute the opinion or advice of IC Markets or any form of personal or investment advice.
Any opinions, news, research, analyses, prices, other information, or links to third-party sites contained on this website are provided on an "as-is" basis, are intended only to be informative, is not an advice nor a recommendation, nor research, or a record of our trading prices, or an offer of, or solicitation for a transaction in any financial instrument and thus should not be treated as such. The information provided does not involve any specific investment objectives, financial situation and needs of any specific person who may receive it. Please be aware, that past performance is not a reliable indicator of future performance and/or results. Past Performance or Forward-looking scenarios based upon the reasonable beliefs of the third-party provider are not a guarantee of future performance. Actual results may differ materially from those anticipated in forward-looking or past performance statements. IC Markets makes no representation or warranty and assumes no liability as to the accuracy or completeness of the information provided, nor any loss arising from any investment based on a recommendation, forecast or any information supplied by any third-party.

Price OIL will continue falling ?!According to Global Channel
According to minor channel
According to Flag Pattern
According to CCI under zero
According to Breakout Support Level @ 66 USD.

USOIL | 4H | SWING TRADING Good morning, dear friends
Due to high demand, I’ve prepared a USOIL analysis for you. My target level is set at 63.600.
Once my target is reached, I’ll be sharing updates under this post.
Dear friends, your likes are always my biggest motivation to keep sharing analyses. That’s why I kindly ask each of my followers to show their support—please don’t hold back on the likes.
I sincerely thank everyone who supports me with their likes. It truly means a lot

Market Analysis: WTI Crude Oil TumblesMarket Analysis: WTI Crude Oil Tumbles
WTI Crude oil is down over 10% and remains at risk of more losses.
Important Takeaways for WTI Crude Oil Price Analysis Today
- WTI Crude oil prices extended downsides below the $60.00 support zone.
- A major bearish trend line is forming with resistance near $57.25 on the hourly chart of XTI/USD at FXOpen.
WTI Crude Oil Price Technical Analysis
On the hourly chart of WTI Crude Oil at FXOpen, the price struggled to continue higher above $60.00 against the US Dollar. The price formed a short-term top and started a fresh decline below $58.00.
There was a steady decline below the $57.75 pivot level. The bears even pushed the price below $56.20 and the 50-hour simple moving average. Finally, the price tested the $55.00 zone. The recent swing low was formed near $55.01, and the price is now consolidating losses.
There was a minor move above the $55.50 level. On the upside, immediate resistance is near the $56.10 level and the 23.6% Fib retracement level of the downward move from the $59.49 swing high to the $55.01 low.
The next resistance is near the $57.25 level. There is also a major bearish trend line forming with resistance near $57.25. The trend line is near the 50% Fib retracement level of the downward move from the $59.49 swing high to the $55.01 low.
The main resistance is near a trend line at $57.75. A clear move above the $57.75 zone could send the price toward $59.45. The next key resistance is near $62.25. If the price climbs further higher, it could face resistance near $63.20. Any more gains might send the price toward the $65.00 level.
Immediate support is near the $55.00 level. The next major support on the WTI crude oil chart is near $53.00. If there is a downside break, the price might decline toward $52.00. Any more losses may perhaps open the doors for a move toward the $50.00 support zone.
This article represents the opinion of the Companies operating under the FXOpen brand only. It is not to be construed as an offer, solicitation, or recommendation with respect to products and services provided by the Companies operating under the FXOpen brand, nor is it to be considered financial advice.

Triangle in oil, OPEC+ decision = gap down on Monday? 🛢️☕ #OilNotCoffee | 📐 #TECHANALYSIS
📉 Oil appears to have formed a triangle in wave 4 and is poised for a major gap down on Monday, driven by OPEC+’s decision to accelerate production increases beyond initial plans.
Position:
▫️ Entered the weekend with short positions near peak exposure.
▫️ Critical level marked by the 100% red line.
▫️ Scenario suggests WTI prices won’t drop below $50 immediately—wave completion within the highlighted range may lead to an extended sideways phase.
Strategy Status:
▫️ This scenario has been executed successfully for an extended period.
⚠️ Disclaimer:
Our analysis is food for thought 💡, not trading signals 🚫📊.
Trade with cold-headed calculation ❄️, your own plan 📝, and independent analysis 👁️🗨️.
💬 Your Forecast?
🔄 Comment below ➡️: How do you assess the risks and opportunities? 🎯

USOIL CAUTION! BREAK - TEST - GO!This is my new updated chart of Oil.
Trump's "Drill baby Drill" interfering with the free market is the absolute worst thing he could do. His ridiculous tariffs will put us in an economic depression!
Oil prices are driven by demand! As I have mentioned here on TV so many times before! Increasing supply while heading into a recession is the dumbest thing possible! You never want to consume your own oil when you can consume others first! Simultaneously, F your own nation's oil company's profit margins and gov tax revenue!
This is why we shouldn't put toddlers as POTUS!
Anyway!!! This is a break test go! setup!
If you haven't seen it before, here is an example I recently posted with AAPL.
Click Boost, follow, subscribe! Let's get to 5,000 followers so I can help them navigate these crazy markets too. ))


USOIL: Will Go Up! Long!
My dear friends,
Today we will analyse USOIL together☺️
The recent price action suggests a shift in mid-term momentum. A break above the current local range around 58.463 will confirm the new direction upwards with the target being the next key level of 59.265 and a reconvened placement of a stop-loss beyond the range.
❤️Sending you lots of Love and Hugs❤️

USOIL:Strategic Analysis on ThursdayThe interest rate decision of the Federal Reserve is in line with market expectations.
Regarding the trend of USOIL, the price of $57.5 serves as the watershed between the bullish and bearish trends, and whether this price level rises or falls will directly affect the subsequent market trend.
At the same time, the conflict between India and Pakistan has recently escalated, with the most severe military confrontation in the past decade, and the civil war in Sudan is also intensifying. These geopolitical conflicts not only pose a serious threat to regional and global peace and stability but will also stimulate the commodity market. The potential threat of war to energy supply may also drive up the prices of energy sources such as crude oil.
USOIL
buy@57.5-58
tp:59-59.5
I am committed to sharing trading signals every day. Among them, real-time signals will be flexibly pushed according to market dynamics. All the signals sent out last week accurately matched the market trends, helping numerous traders achieve substantial profits. Regardless of your previous investment performance, I believe that with the support of my professional strategies and timely signals, I will surely be able to assist you in breaking through investment bottlenecks and achieving new breakthroughs in the trading field.

Short on Oil/Back to 57$ SOONI believe we can continue the retest of previous major support level at 65-66$ and fibonacci 0.618. This major support will be flipped to resistance in my opinion. We can see a significant sell-off back towards the 57$ area and below from this location.
I will be looking to enter a short trade from the 0.618 region/66$ if there is a rejection.
My mid-term/end-of-year prediction for US OIL is between 45-50$ and possibly lower.
If you believe in the fundamentals and idea of this setup, feel free to follow and use it.
Not financial advice.

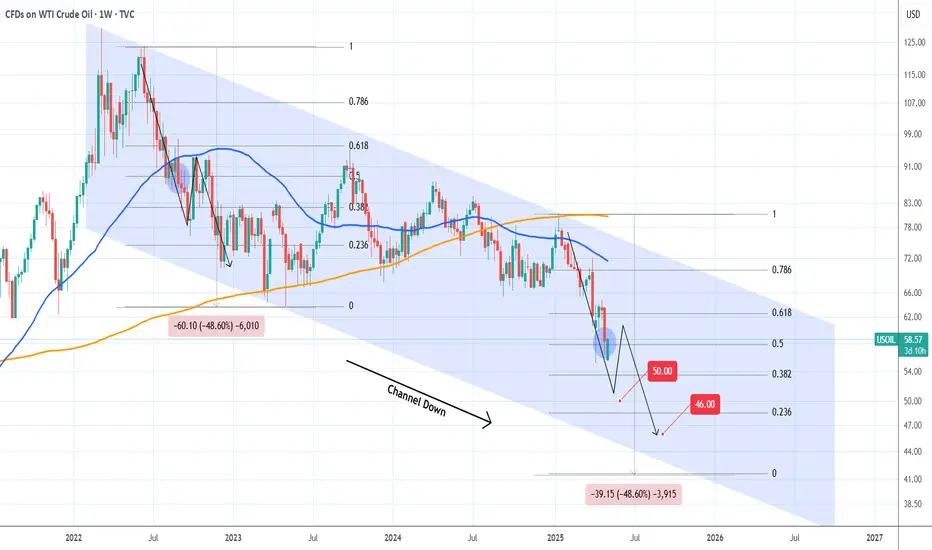
WTI OIL May be closer to $50 and below than a recovery.WTI Oil (USOIL) is having a strong green 1W candle but remains on a strong selling sequence since the January 13 2025 rejection on its 1W MA200 (orange trend-line). So far this is technically the Bearish Leg of the Channel Down that started after the March 07 2022 market top.
The Bearish Leg that was initiated then, declined by -48.60% so if the current one repeats this we are looking at prices close to $41 by the end of the year or beginning of 2026. Technically, as long as the 1W MA50 (blue trend-line) holds, the immediate Targets within a 3-month horizon are $50 and $46.
-------------------------------------------------------------------------------
** Please LIKE 👍, FOLLOW ✅, SHARE 🙌 and COMMENT ✍ if you enjoy this idea! Also share your ideas and charts in the comments section below! This is best way to keep it relevant, support us, keep the content here free and allow the idea to reach as many people as possible. **
-------------------------------------------------------------------------------
💸💸💸💸💸💸
👇 👇 👇 👇 👇 👇
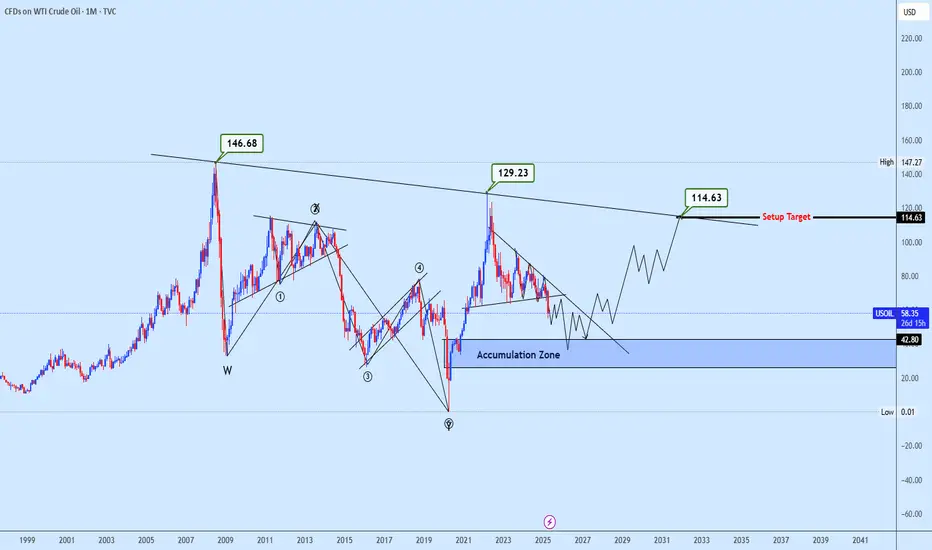
Crude Oil Macro Setup Structural Bottoming cascadeWTI Crude Oil has completed a prolonged complex correction from its historical high of $146.68, forming a structurally mature accumulation base between the $33.06–$42.80 demand zone. This zone aligns with multi-year support and marks the potential terminal point of a corrective macro structure positioning the asset for a major impulsive phase within either Wave 3 or Wave 5 of the broader cycle.
Recent price behavior near $33.06 reflects a critical inflection, signaling strong institutional absorption and suggesting exhaustion of the long-term bearish momentum. The projected bullish scenario envisions a reversal targeting $114.63 as the primary technical pivot, corresponding with significant resistance and the neckline of the long-term structural setup. A confirmed breakout above this level would unlock higher targets toward $129.23 and potentially a full retracement to the $146.68 high, contingent on macroeconomic alignment.
Fundamentally, this scenario is underpinned by key catalysts including OPEC+ production adjustments, U.S. inventory dynamics, geopolitical instability across major oil-exporting nations, and global macro data such as GDP trends, inflation prints, and energy demand forecasts. These elements are poised to fuel volatility but also support a sustained recovery phase, provided demand fundamentals remain intact.
USOIL Bullish Shark PatternBased on harmonic Shark pattern analysis, the potential future trajectory of oil prices suggests an upward trend, initiated by a "Shark Dive" reversal pattern from the $54 level.
This indicates a likely bullish continuation contingent upon confirmation of the pattern's validity through subsequent price action.

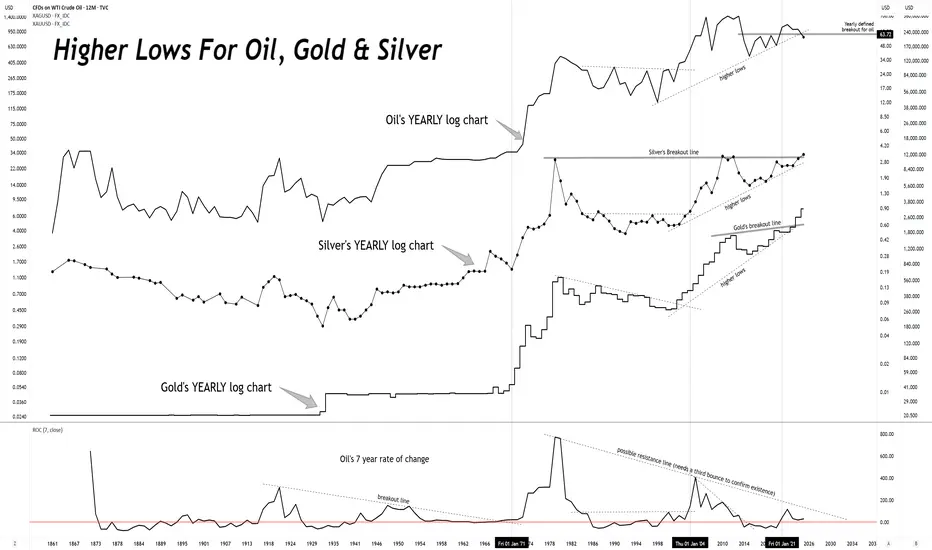
What do silver and oil have in common? Price.Since 1861, silver and crude oil charts have trended together rather well.
So, if you think there is a "cartel" which manipulates the silver, there must also be manipulating crude oil.
Or, the more logical explanation is that capital flows are carving out these price charts.

Bearish reversal off pullback resistance?USO/USD is reacting off the resistance level which is a pullback resistance that is slightly below the 50% Fibonacci retracement and could drop from this level to our take profit.
Entry: 60.04
Why we like it:
There is a pullback resistance level that is slightly below the 50% Fibonacci retracement.
Stop loss: 62.00
Why we like it:
There is a pullback resistance level that is slightly below the 71% Fibonacci retracement.
Take profit: 56.89
Why we like it:
There is a pullback support level.
Enjoying your TradingView experience? Review us!
Please be advised that the information presented on TradingView is provided to Vantage (‘Vantage Global Limited’, ‘we’) by a third-party provider (‘Everest Fortune Group’). Please be reminded that you are solely responsible for the trading decisions on your account. There is a very high degree of risk involved in trading. Any information and/or content is intended entirely for research, educational and informational purposes only and does not constitute investment or consultation advice or investment strategy. The information is not tailored to the investment needs of any specific person and therefore does not involve a consideration of any of the investment objectives, financial situation or needs of any viewer that may receive it. Kindly also note that past performance is not a reliable indicator of future results. Actual results may differ materially from those anticipated in forward-looking or past performance statements. We assume no liability as to the accuracy or completeness of any of the information and/or content provided herein and the Company cannot be held responsible for any omission, mistake nor for any loss or damage including without limitation to any loss of profit which may arise from reliance on any information supplied by Everest Fortune Group.

Crude oil and silver ultimately go where gold goes.Crude oil and silver ultimately go where gold goes.
Oil's YEARLY log chart
Silver's YEARLY log chart
Gold's YEARLY log chart
Crude Oil Outlook and Trading Tips for Next WeekThe expected production increase by OPEC+, trade concerns triggered by Trump, and the risk aversion sentiment in the global economy dominate the price trend of crude oil. On Saturday, OPEC+ confirmed a production increase of 411,000 barrels per day in June, intensifying concerns about oversupply. Technically, the bearish trend dominates the crude oil market. Due to the low liquidity in the Asian market caused by holidays next Monday, the oil price is likely to fluctuate significantly.
Last week, crude oil continued to decline and closed with a large bearish candlestick on the weekly chart. Next week, the focus is on whether the oil price will break below the previous double-bottom support. In the short term, the oil price has been fluctuating within a range. Currently, it is under pressure and adjusting around $64.88 per barrel, and there are signs of it encountering resistance for the second time around the $60.2 resistance level.
In conclusion, it is highly probable that crude oil will continue to be under pressure. On Monday, it is advisable to mainly consider shorting on rebounds and supplement with going long at low levels. Pay attention to the resistance levels of $59.3 - $60.3 per barrel on the upside and the support levels of $57.7 - $56.3 per barrel on the downside.
USOIL
sell@59.5-59.20
tp:58.00-57.50
Investment itself is not risky; it is only when investment is out of control that risks occur. When trading, always remember not to act on impulse. I will share trading signals every day. All the signals have been accurate without any mistakes for a whole month. No matter what gains or losses you've had in the past, with my help, you have the hope of achieving a breakthrough in your investment.
